Scientific Report 915
This report is also available as a PDF document .
Abstract
During June/July/August 2010 magnetotelluric surveying was conducted in Sri Lanka along profiles over several hot springs with the object of locating possible deep sources of geothermal energy and providing information on deep structure associated with the Highland/Vijayan boundary.
A total of 86 MT stations were obtained over 7 hot springs and almost all stations were supported by TEM measurements for the control of static shift. A further 27 stations were occupied in the NW basin area of Puttalam. The Highland/Vijayan boundary can be seen as a thin, vertical section separating the low resistivity Vijayan complex from the more resistive Highland formation. Evidence from pseudo-sections indicates areas of possible geothermal interest in 2 of the 3 profiles so far analysed. Data have been provided to the University of Edinburgh for final year undergraduate projects and to two major MT groups for 3D inversion. Preliminary information regarding the project was made available through a presentation at the 20th IAGA Electromagnetic Induction Workshop in Giza, September 2010.
Background
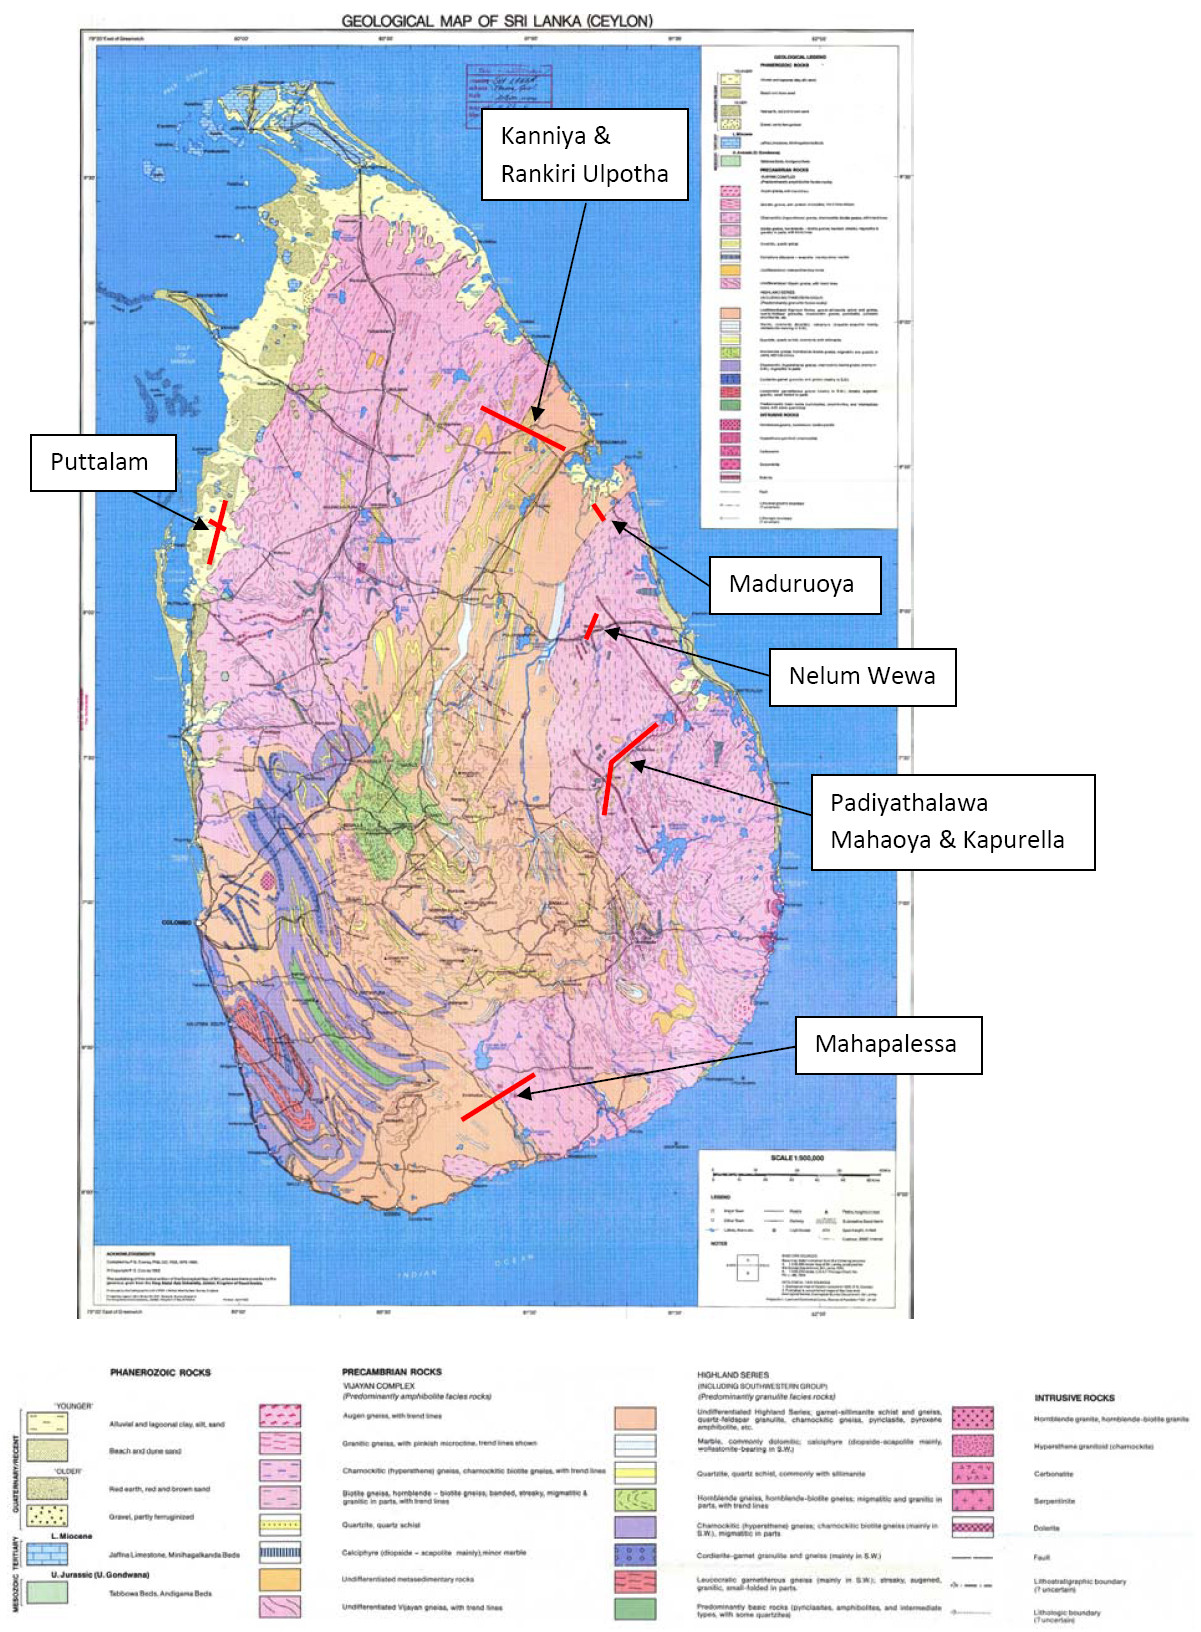
During June/July/August 2010 the first ever magnetotelluric survey in Sri Lanka was conducted along profiles over 7 hot springs with the object of locating possible deep sources of geothermal energy. One profile in the south, encompassing the Mahapalessa hot spring, was extended laterally to address the nature of the Highland/Vijayan boundary fault, which is currently the subject of conflicting hypotheses. The locations of the profiles are shown in Figure 1 superimposed on a geological map of Sri Lanka.
The project is a joint venture between privately funded personnel in the UK and Canada; the University of Edinburgh, UK; the Geological and Mines Bureau, Sri Lanka; the Institute for Fundamental Studies, Sri Lanka; and the water Supply and Drainage Board, Sri Lanka.
Survey Procedure
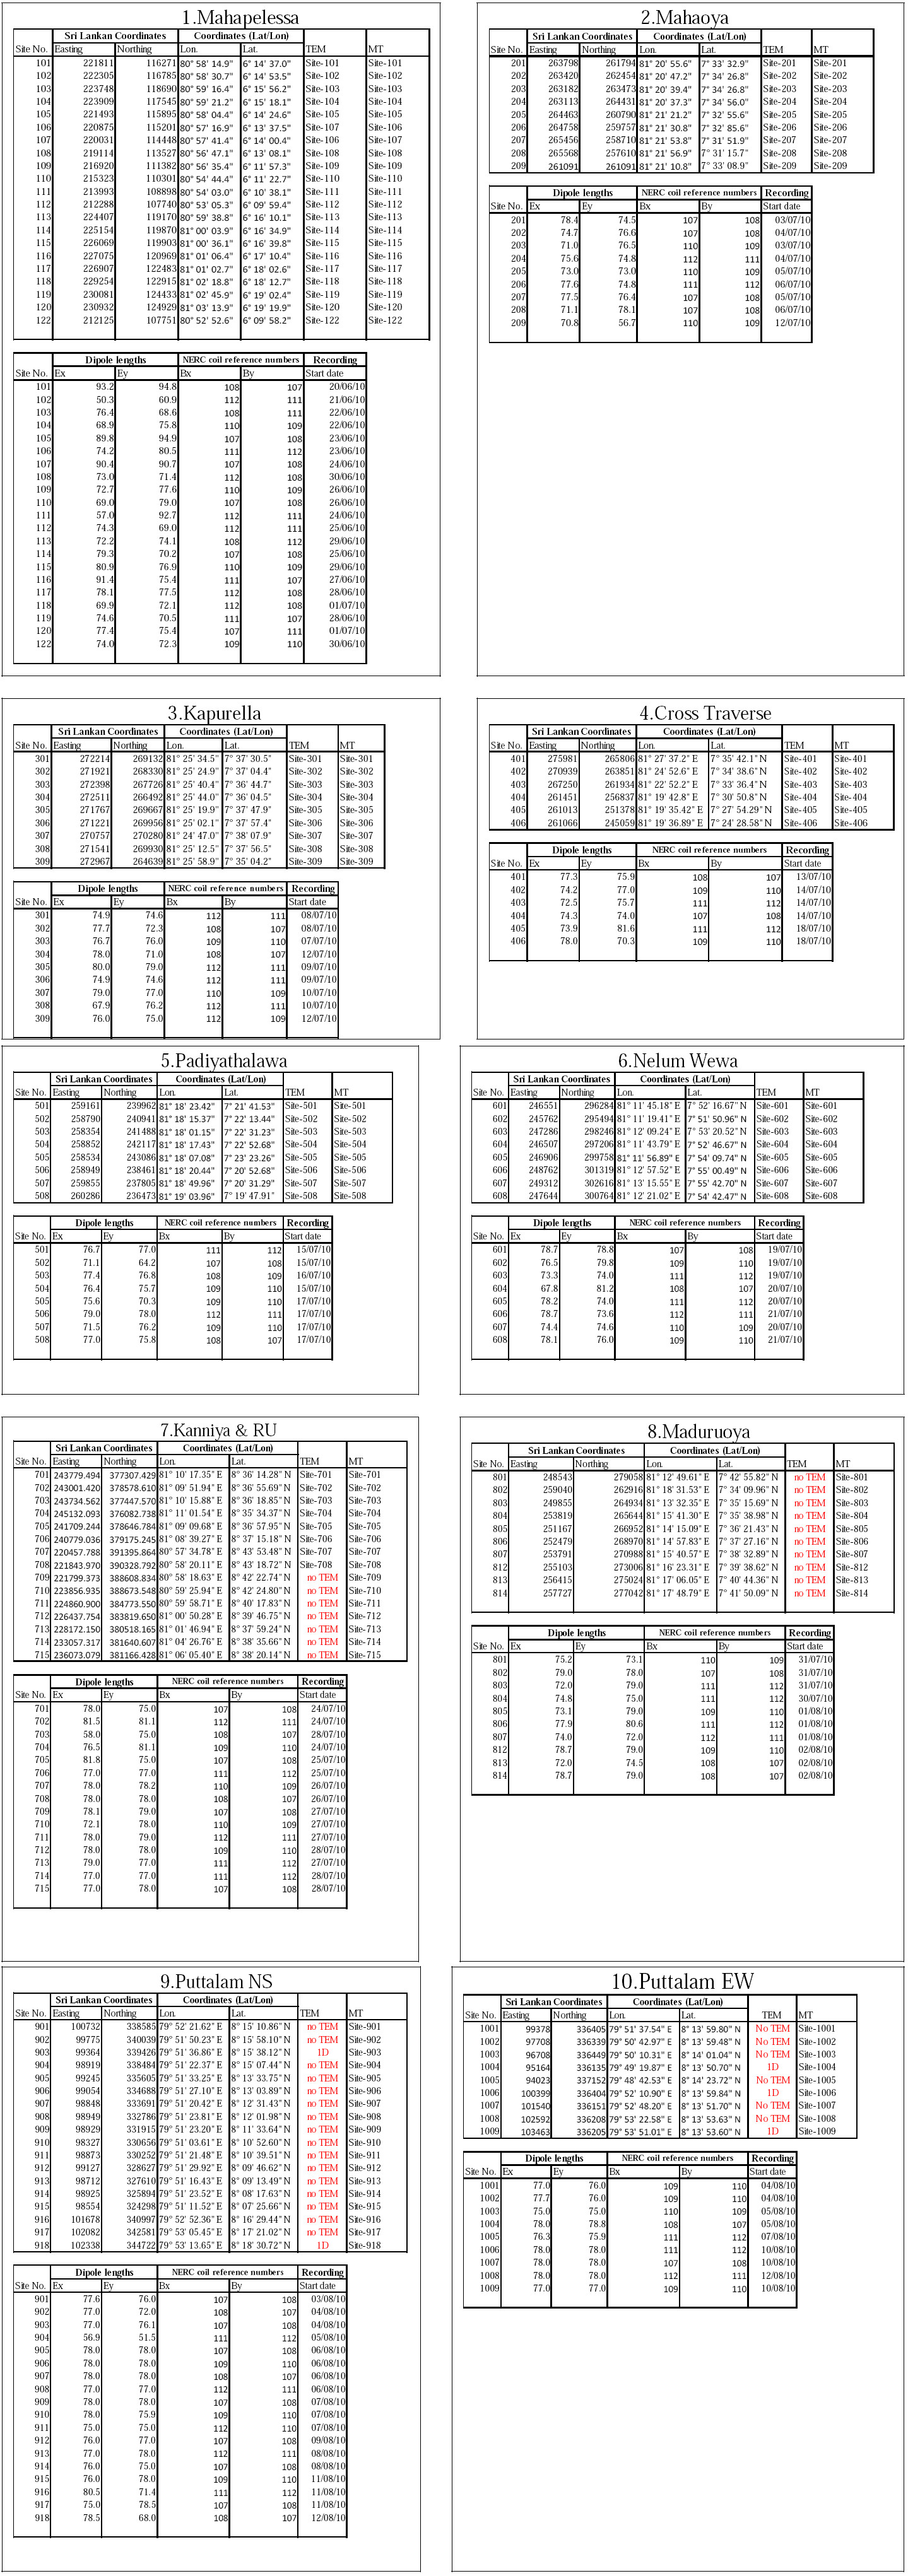
In advance of the field campaign, staff in Sri Lanka visited all the hot spring sites designated for study and selected a number of potential sites where MT might be possible. Site selection was somewhat problematic with many areas of paddy fields unavailable and there were indications of much potential interference from cultural sources. During the campaign at the start of each traverse these sites were revisited and a final selection made. Campaign participants were split into four groups two manual groups for establishing an MT site and for its subsequent close down, one group for MT data acquisition and one group for TEM data acquisition. MT site preparation comprised laying out telluric lines along magnetic north and east directions, burying and connecting electrodes, digging trenches around 0.5 m deep in magnetic north and east directions, placing, levelling, burying and connecting magnetic coils, measuring telluric line lengths and recording serial numbers of the magnetic coils. No vertical magnetic field measurements were made. The MT acquisition group recorded GPS locations for each site, logged the MT measurements and made back-up disks of all field data for separate storage. The group had six coils and hence three sets of MT equipment. At any one time there were usually two in operation with one in transit to a new site. Before MT recordings began, TEM measurements were made with, where possible, a transmitter loop size of 100 m by 100 m. An average of two MT stations per day was achieved throughout the survey even with long moves between traverses. Details of the site locations, telluric line lengths, magnetic coil reference numbers and acquisition dates are given in Appendix 1 for all occupied sites.
Along profiles crossing each spring site MT stations were occupied approximately every 1 km and traverse lines were around 7 - 8 km long. At Mahapalessa the profile was extended to 27 km to investigate the Highland/Vijayan boundary. Sites were generally occupied for several hours during one day and for each profile, one or two sites were occupied continuously for several days to provide remote reference possibilities.
Data quality
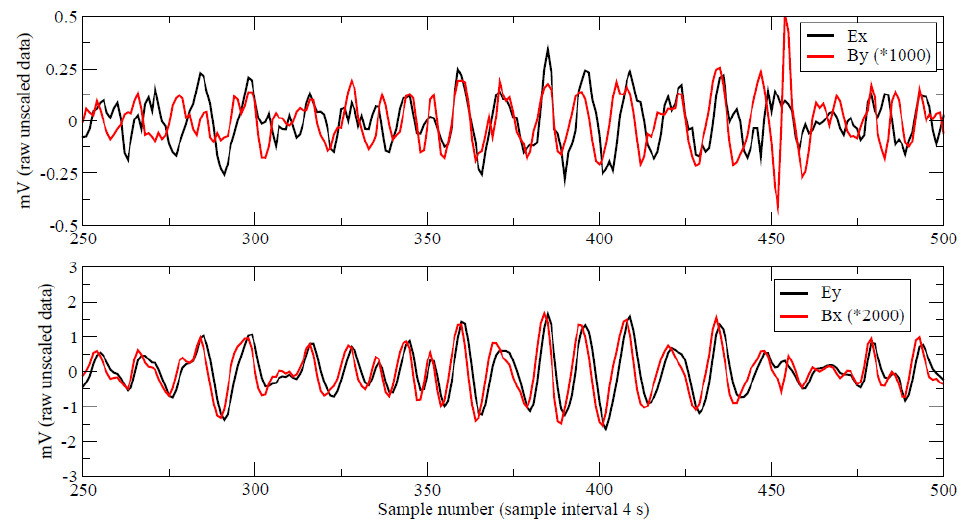
Figure 2 shows some raw data time variations for station 104 along the Mahapalessa profile. Correlation is very good for Ey-Bx but for Ex-By the correlation is poorer and the Ex data are noisier. Sites were generally quite noisy throughout the Mahapalessa profile and we suspect this was due to a combination of power cables, electric elephant fences and irrigation pumps. Data further north are of better quality.
Processing and modelling
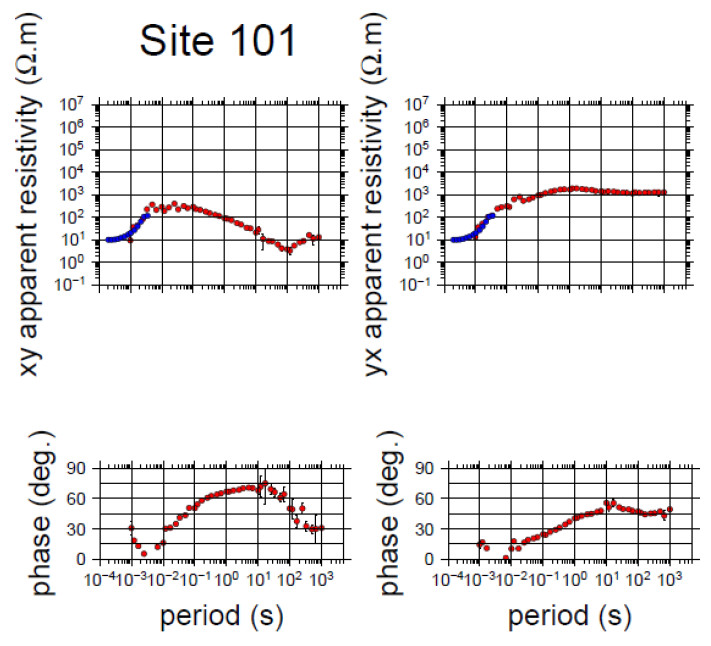
MT responses for all stations along 3 profiles were obtained using the robust data processing algorithm of Chave and Thompson, 19891. Estimates were generally obtained over the 6decade period range 10-3 to 103 s, with TEM providing coverage over 2 10-4 to 5 10-3 s. TEM data were used to estimate static shift corrections for the MT data and an example of the TEM response and corrected MT response is shown in Figure 3 for Mahapalessa site 101.
Processed data for the long Mahapalessa profile was passed to the University of Edinburgh and used for a final year Geophysics undergraduate project based on impedance phase analysis. The data have also been passed to two modelling groups: the Consortium for Electromagnetic Modelling and Inversion (CEMI) at the University of Utah, and the Magnetotellurics Division, National Geophysical Research Institute (NGRI), Hyderabad. Modelling results are currently awaited.
Interpretation to date
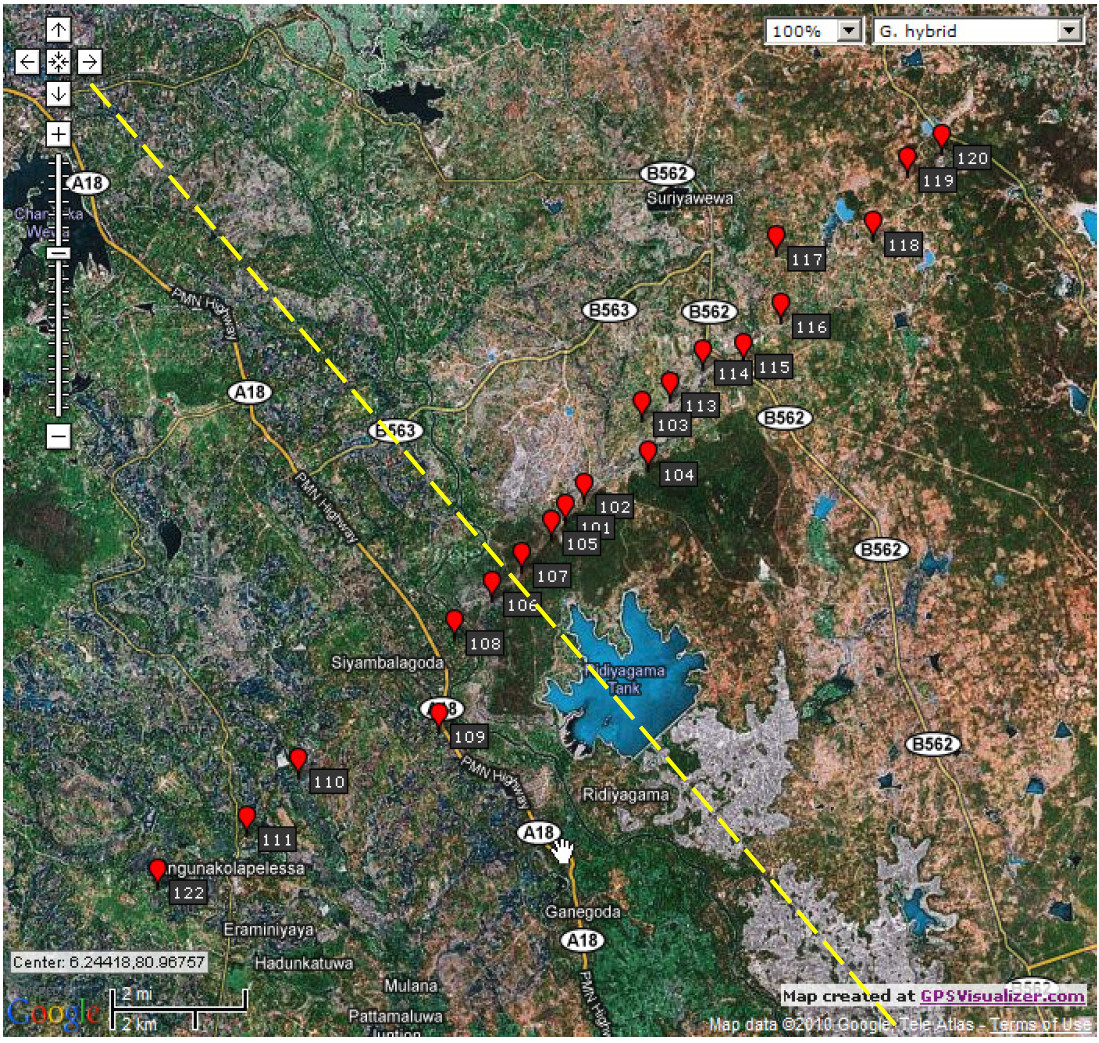
Statically shifted xy and yx apparent resistivities have been collated to form pseudo-sections for Mahapalessa, Kapurella and Mahaoya as a first possible indication of resistivity variations beneath the profiles. The Mahapalessa profile of stations is shown in Figure 4.
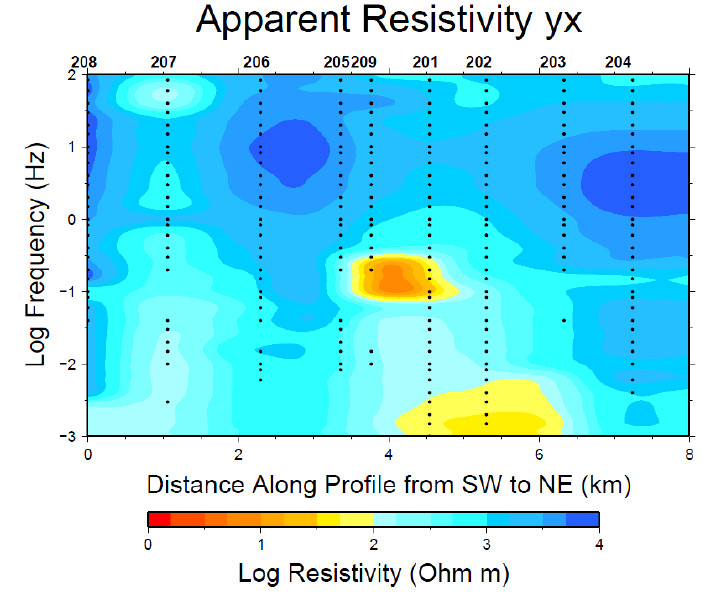
An apparent resistivity pseudo-section for Mahapalessa is shown in Figure 5 and examples for Kapurella and Mahaoya are shown in Figures 6 and 7.
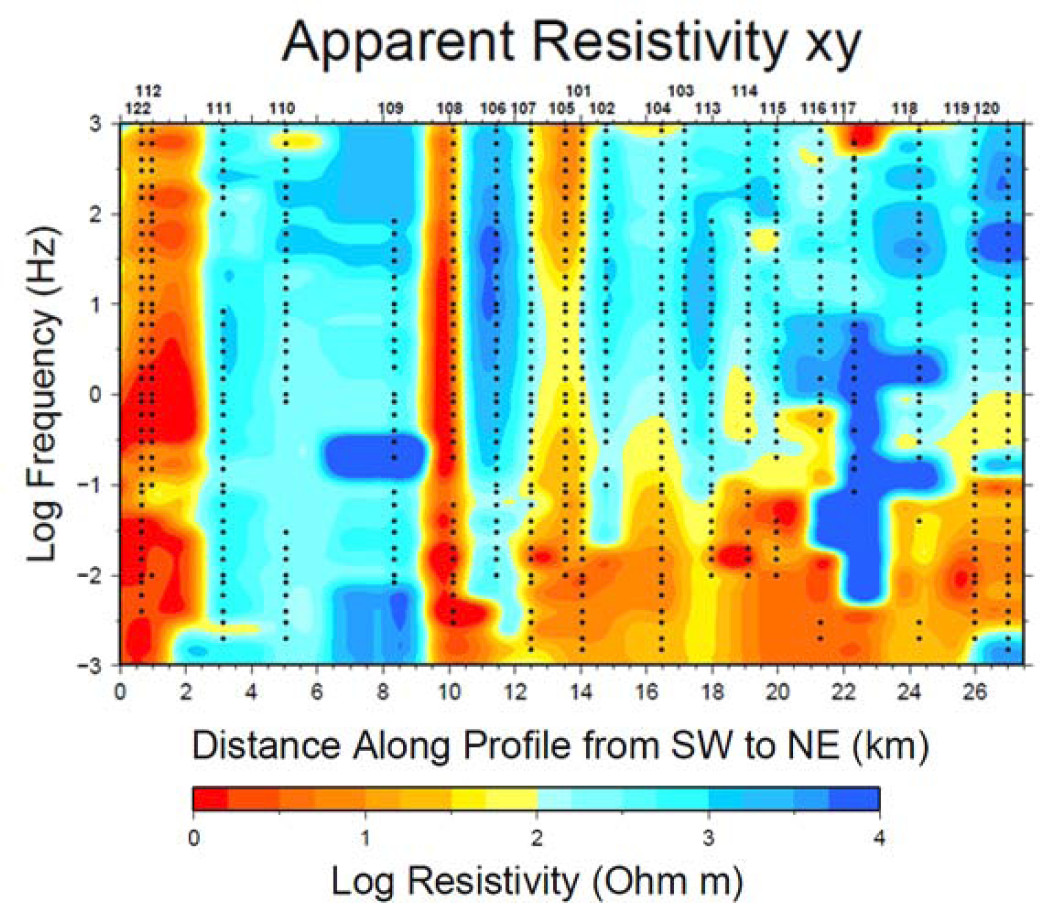
The vertical low resistivity section beneath station 108 (confirmed independently by TEM) may be interpreted as the Highland/Vijayan boundary, possibly containing water or graphite, which separates low resistivity to the east from higher resistivity to the west (apart from the very low resistivity beneath stations 112/122). This position is somewhat displaced from that conjectured (Figure 2) and the discrepancy will be investigated during modelling. Lower resistivity associated with the hot spring can be seen beneath station 104 and there is a suggestion that this may connect to the deeper low resistivity through a conduit beneath station 105.
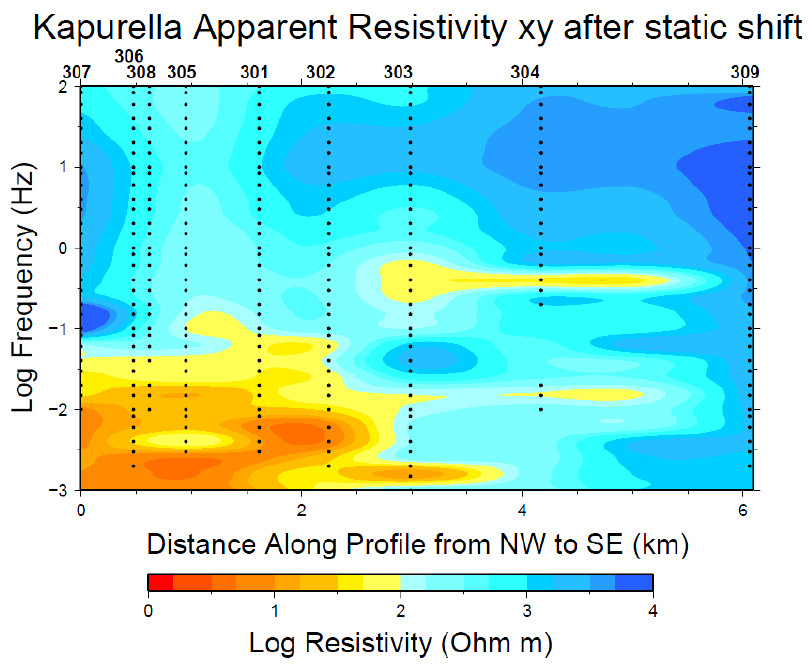
The Kapurella hot spring is located around station 305 and the apparent resistivity shows an increase there. A strong low resistivity region exists directly beneath which may, after 3D modelling, prove of geothermal interest.
Preliminary findings
The above pseudo-sections give the first indication of resistivity variations along the profiles and with depth but a true depth scale awaits 3D inversion. Preliminary results, using frequencies down to 0.1 Hz, yield background resistivities around 200Ωm and thus relate to depths of a few kilometres. The findings show, at least at Mahapalessa and Kapurella, that there are possibly commercially exploitable geothermal targets of interest.
As is seen e.g for the possible Highland/Vijayan boundary association, our data will also be of use in furthering a better geological understanding of deep structure hitherto unavailable to Sri Lankan geologists due to the lack of penetrating geophysical data. Moreover, we have recorded magnetotelluric data to frequencies as low as 0.001 Hz which gives penetration depths to several hundred kilometres and may be of use, for example, in aiding the reconstruction of Gondwanaland.
Conclusions and recommendations
We have obtained MT data at 113 sites in Sri Lanka in what is the first large scale modern geophysical survey of the island. We hope the data will be of use to geologists in Sri Lanka in obtaining structural information to depths of several hundred kilometres. We hope also that the survey will provide impetus internally for an extension to a wider coverage, not just areas of potential geothermal interest.
There is much analysis still to complete including: revision of MT response estimates using remote referencing, strike direction analysis, decomposition analysis, inversion and full analysis of 4 remaining profiles.
It is intended to make the data available to the wider geophysical community through a depository in the National Geoscience Data Centre.
Publications
I presented a paper at the 20th IAGA Electromagnetic Induction Workshop in Giza, September 2010. A preliminary report “Magnetotellurics in Sri Lanka, July 2011” was submitted to the Ministers of Power and Energy, Technology and Research, and the Environment, Sri Lanka. I intend to present papers at the 21st IAGA Workshop, Darwin, 2012 and at the SEG, Las Vegas, 2012. I intend to write a manuscript for publication in an international, peer-reviewed, journal after modelling studies have been completed.
References
Appendix
