Scientific Report 1133
This report is also available as a PDF document .
Abstract
SeisUK supplied a total of 12 16Gb CMG-6TD seismometers for the Cambridge Volcano Seismology group project in the Highlands of Iceland between 2021-2023. This formed part of an array of ~50 broadband seismic stations (largely 6TD, 3ESPCD and Certimus seismometers owned by Cambridge) that has been continuously operating (with varying numbers of instruments) for >15 years. The goal of loan 1133 was to build on the long term monitoring of the tectonically and magmatically active Northern Volcanic Zone (NVZ) of Iceland, which since 2007 has yielded >40 papers in international peer-reviewed journals and has supported 16 PhD projects. In 2014-2015, the array recorded the Bárðarbunga-Holuhraun dyke intrusion and subsequent eruption in unprecedented detail. With the current loan, we were able to record the effects of ongoing reinflation beneath Askja caldera that started in late July 2021. To date, it has produced >85 cm of peak surface uplift on the northwest edge of Lake Öskjuvatn, and has been accompanied by a surge in seismicity. Results from this deployment so far include: (1) A new earthquake catalogue for the NVZ, built using automatic detection and location methods; (2) local earthquake shear wave splitting results, which show that azimuthal anisotropy is largely aligned with the strike of the rift, but significantly deviates from this trend in the neighbourhood of Askja; (3) focal mechanism solutions within Askja caldera, which appear to show no appreciable change in the strike, dip or slip direction of faults before and after inflation; (4) a new local earthquake tomography model of the shallow plumbing system beneath Askja, which has revealed for the first time a shallow low velocity and high Vp/Vs anomaly that represents a body of partial melt; (5) an even more recent ambient noise tomography model of the Askja neighbourhood, which also reveals the presence of the same shallow crustal anomaly, both as a low velocity zone and a zone of elevated radial anisotropy; and (6) a catalogue of deep earthquakes beneath Vatnajökull icecap and Askja volcano, which provides new insight into deep melt migration in the crust.
Background
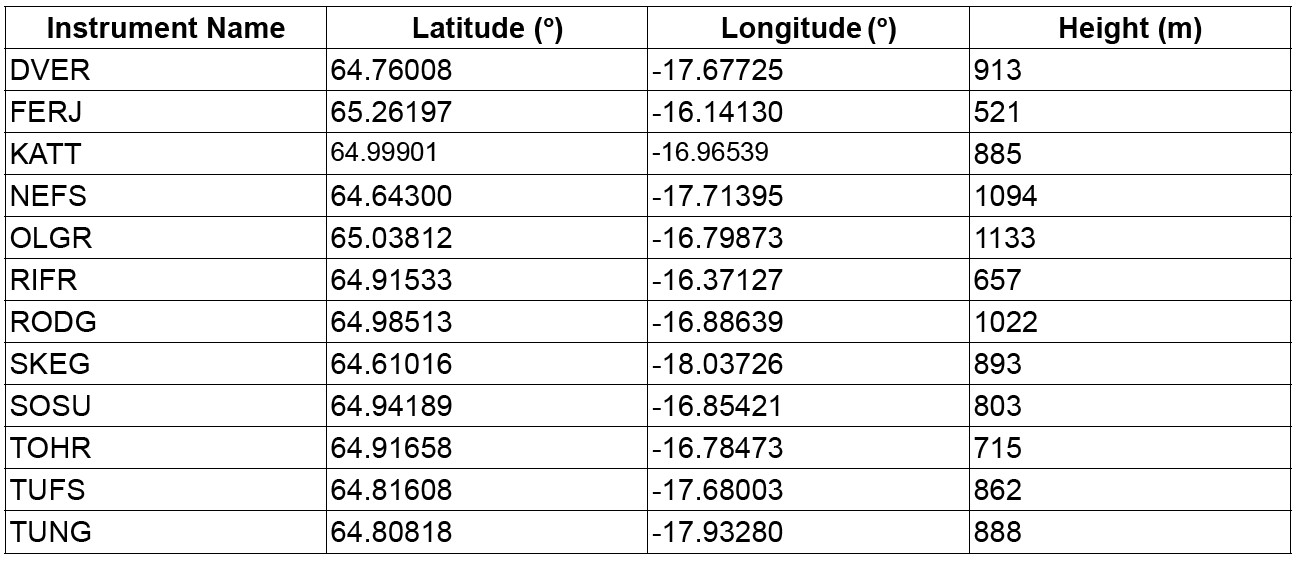
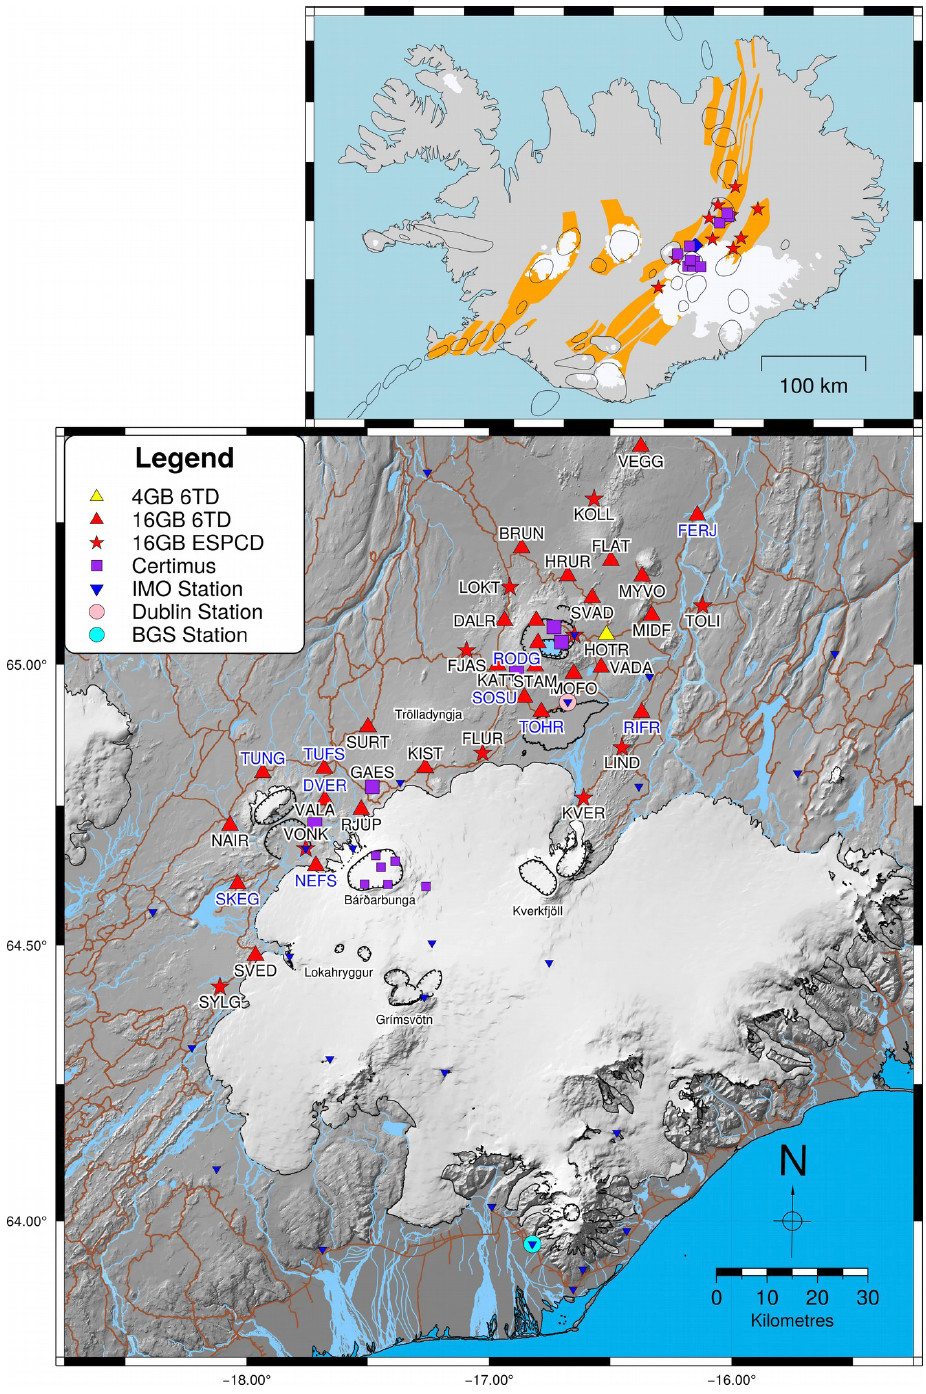
Iceland lies at the confluence of the divergent plate boundary that separates the North American and Eurasian continents in the North Atlantic. The enhanced melting that has given rise to a relatively thick crust (up to ~40 km) and subaerial exposure is generated by the combined effects of the Iceland plume and mid-Atlantic ridge spreading and upwelling. A complex network of enéchelon axial rift zones and transform faults accommodate rifting, which progresses at a full spreading rate of ~18 mm/yr. The NVZ consists of multiple rift systems, each characterised by a central volcano and elongated fissure swarm (Einarsson, 1991 1). Askja is a large central volcano that sits at the southern end of the NVZ, and comprises a nested system of calderas that reflect its eruption history. Its last Plinian eruption took place in 1875, and formed the 11 km2 crater lake Öskjuvatn. The most recent eruption took place in 1961, and after an initial period of flux, settled down to a monotonic deflation period that spanned the early 1980s until 2021 (as determined by repeat levelling measurents see Sturkell et al., 2006 2), when reinflation was first detected. To explain the deflation, Drouin et al. (2017) 3 undertook forward modelling based on geodetic data, and found that the surface displacement could be explained by a Mogi-type source located ~3.5 km below the surface. Recent geodetic inversion modelling of the ongoing inflation episode (Parks et al., 2024) 4 identified two sources between July 26 September 20, 2021: an inflating source at a depth of 2.8 km, and slightly smaller deflating source at 3.3. km depth. For the period September 20, 2021 September 10, 2023, an inflation source at 2.7 km depth was identified, but with no accompanying deflation source. The Cambridge Volcano Seismology group NVZ seismic array has formed the basis of many observational studies that seek to understand key processes and structures associated with rifting, volcanism, crustal growth and melt migration (White et al., 2011 5, Green et al., 2014 6, Ágústsdóttir et al., 2016 7, Woods et al., 2019 8, Volk et al., 2021 9). It has also been the test-bed for the development of cutting edge techniques that are now widely used. This includes QuakeMigrate (Winder et al., 2022 10), an open source code for the automatic detection and location of microseisms, and MTfit (Pugh and White, 2018 11), a Bayesian moment tensor inversion scheme for determining earthquake focal mechanisms. The deployment period from 2021-2023, in which the 12 SeisUK 6TDs (see Table 1, appended) formed part of the larger array (see Figure 1), enabled numerous local earthquakes, regional earthquakes and teleseisms to be recorded, in addition to ambient seismic noise. This allows important questions to be addressed, including (i) how numerous are earthquakes in the 10-30 km depth range, which are related to melt migration and crustal formation?; (ii) to what extent can seismicity inform the process of caldera reinflation?; (iii) can temporal changes in structure and processes be detected? During and following the deployment period, various methods were used to analyse and model the data, which have yielded important insights into the evolution of the NVZ and Askja, as detailed below. Ongoing work is expected to produce even more results in the coming months and years.
Survey procedure
The fieldwork was a collaborative effort between the University of Cambridge and the University of Iceland. Eight of the SeisUK 6TDs were already in place, with four more dispatched to Iceland by SeisUK in 2021. Due to their location in the Vatnajökull National Park, a permit was obtained from national park authorities well in advance of their deployment.
Installation and servicing was carried out using three separate 4WD vehicles, each with teams of at least three people. This was done in summer, since at other times of the year, the Highlands can be impassable due to snow accumulation, with high winds and extreme temperatures adding to the challenge. The entire network lies in a region spanned by only dirt roads and tracks, some of which are only passable with specialist 4WD vehicles with significant ground clearance. While it was possible to drive up to most sites, some required hiking to access, including those in Askja caldera and FLAT, which is in the northern sector of the array. To meet health and safety requirements, all participants were trained in first aid and the use of 4WDs in off-road conditions. First aid kits, radios and satellite phones were also used for communications. Accommodation was in huts with oil heaters, a network of which can be found throughout the Highlands.
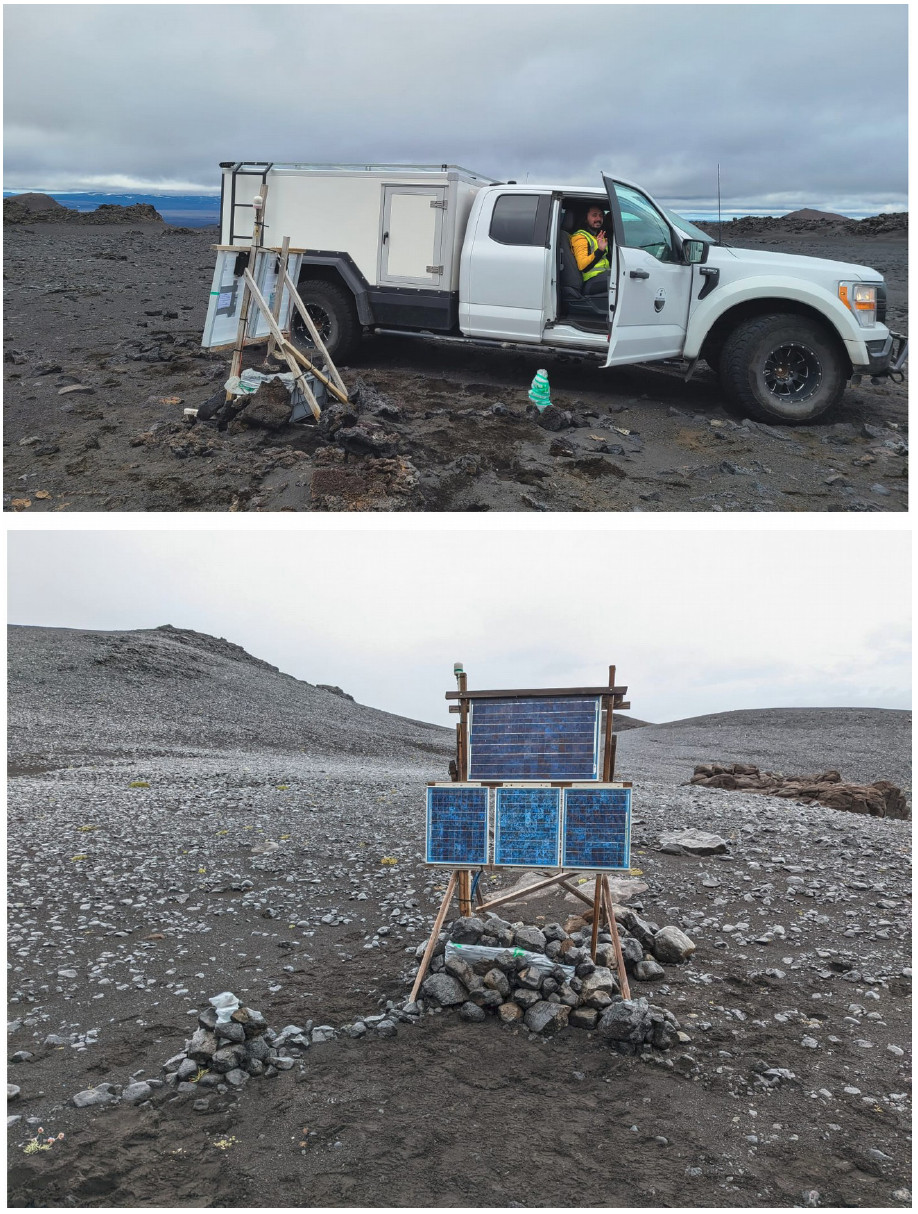
The standard deployment (see Figure 2) involved the construction of a wooden solar panel stand, which faced south at a relatively high angle due to the latitude, with the added benefit of shedding snow more easily. Typically, solar panels with a total output of at least 80W were installed on the stands, and connected to a minimum of three 115Ah truck batteries. Earlier designs had the batteries buried along with the solar panel regulator(s), but this made access more difficult, and appeared to result in a higher rate of regulator failure than expected (owing to water ingress). The new approach, used for these stations, involved placing the batteries and regulator(s) in a strong plastic box with a lid, and placing it on the ground supports of the solar panel assembly. This has the dual advantage of heavy ballast for the solar panel stand (which can encounter winds in excess of 100 mph), and keeping the batteries readily accessible and dry. A strong plastic sheet was taped around the box to minimise water ingress, although holes were drilled in the bottom of the box just in case. In this set-up, the break-out box is attached to a stake hammered into the ground, and wrapped in a plastic bag. The GPS antenna is screwed onto the top of the solar panel stand. The 6TD itself is directly buried in the ground, wrapped up several times in strong plastic bags. Care has to be taken to orient the instrument (here using GPS) and ensure that it is level. Experience shows that direct burial of the 6TD generally produces better signal, since the instrument is in contact with dirt on all sides. In winter, when the ground freezes, the tendency is for even better recordings. Water ingress was generally not a problem, since in most places the soil is quite sandy, and therefore drains the water well.
When servicing the sites, it was simply a case of unwrapping the break-out box, and plugging in a computer. The procedure from there was to download the data onto a local disk and do a quick QC check, which summarised timing drift and mass positions. Before leaving the site, a jump test was performed, and all input parameters carefully checked. At the end of each day, the data were backed up onto external disks. On return from the field, the data were backed up on servers, and then processed and archived using standard SeisUK procedures.
Data quality
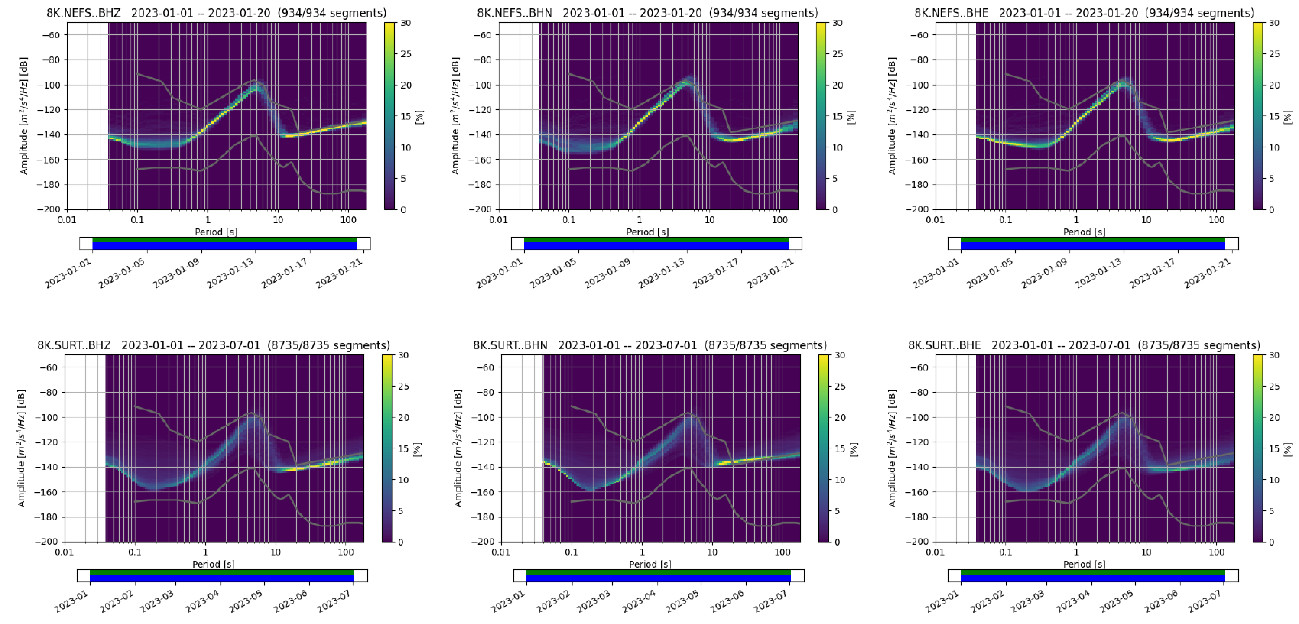
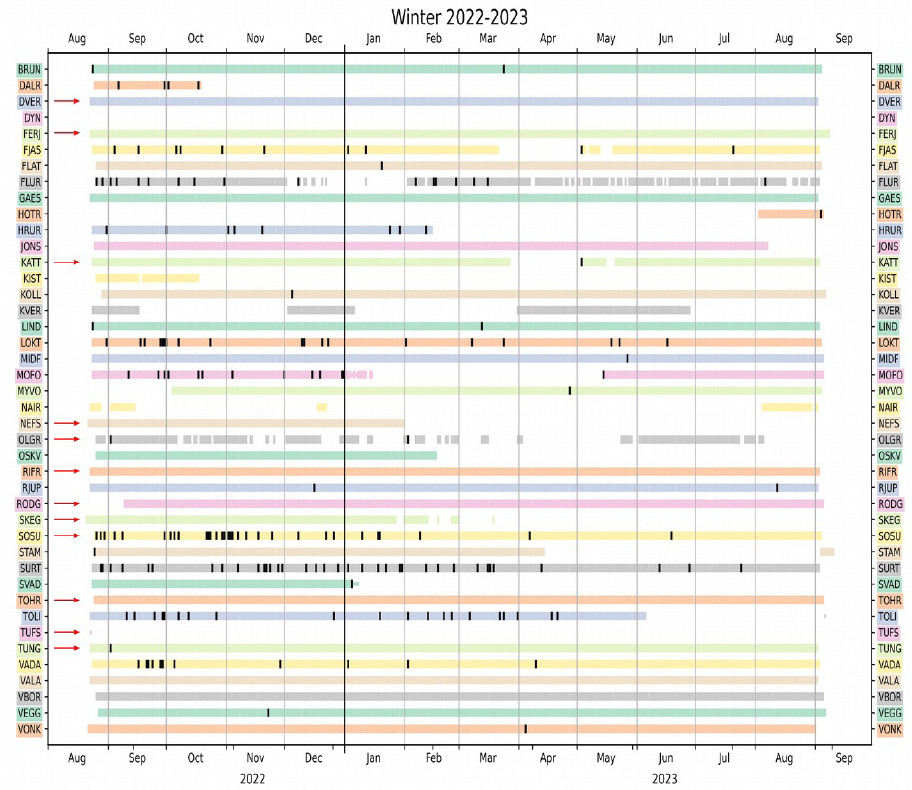
In the Highlands, the data quality is generally excellent. This is due to an absence of anthropogenic noise sources, trees or shrubs that move in the wind, and a considerable distance to the oceans. Within the array, we are able to detect earthquakes with a magnitude of completeness of about zero. Figure 3 shows two examples of PPSDs (probabilistic power spectral density plots) from 6TD instruments in the Highlands. In general, the background noise is below the high noise model, although at periods longer than 20s, they tend to be more marginal. This is to be expected, given that the corner period of a 6TD is 30s. In Figure 4, the data return as a function of time is shown for the last year of the deployment. While there were a few instrument problems (e.g. faulty regulators), most of the data loss is associated with winter and immediately post-winter, when little sunlight reaches the solar panels and the batteries get depleted over time. However, this only occurred at a minority of the stations.
Processing and modelling
The data and results presented below focus largely on Askja and its neighbourhood. Outputs on the region further south, including beneath Bárðarbunga, are forthcoming, and will be tied in with data we are in the process of collecting in a separate experiment involving seismometers deployed on the icecap.
1. Earthquake catalogue:
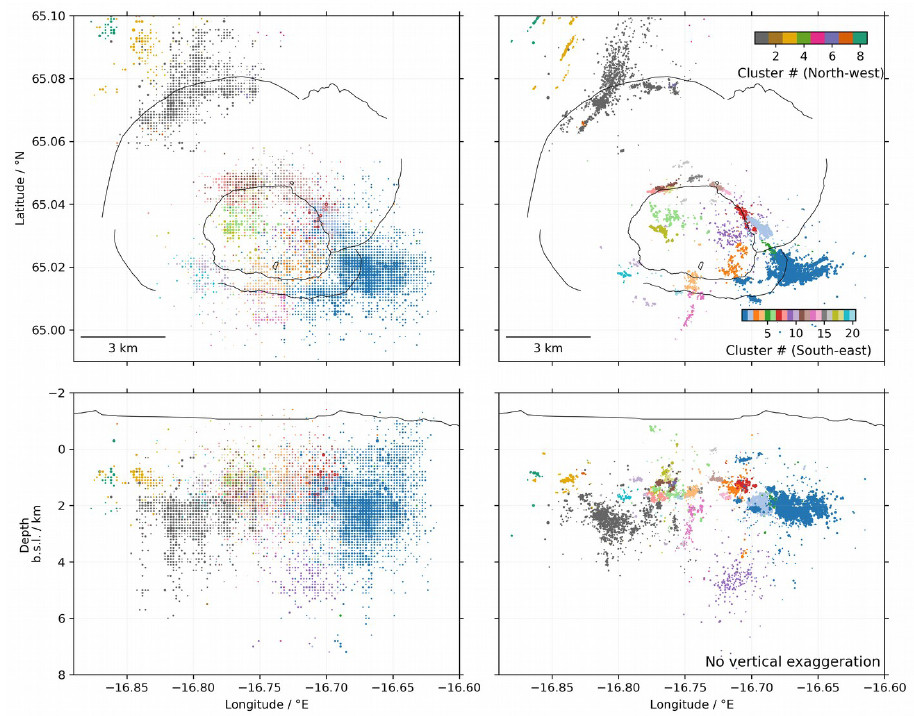
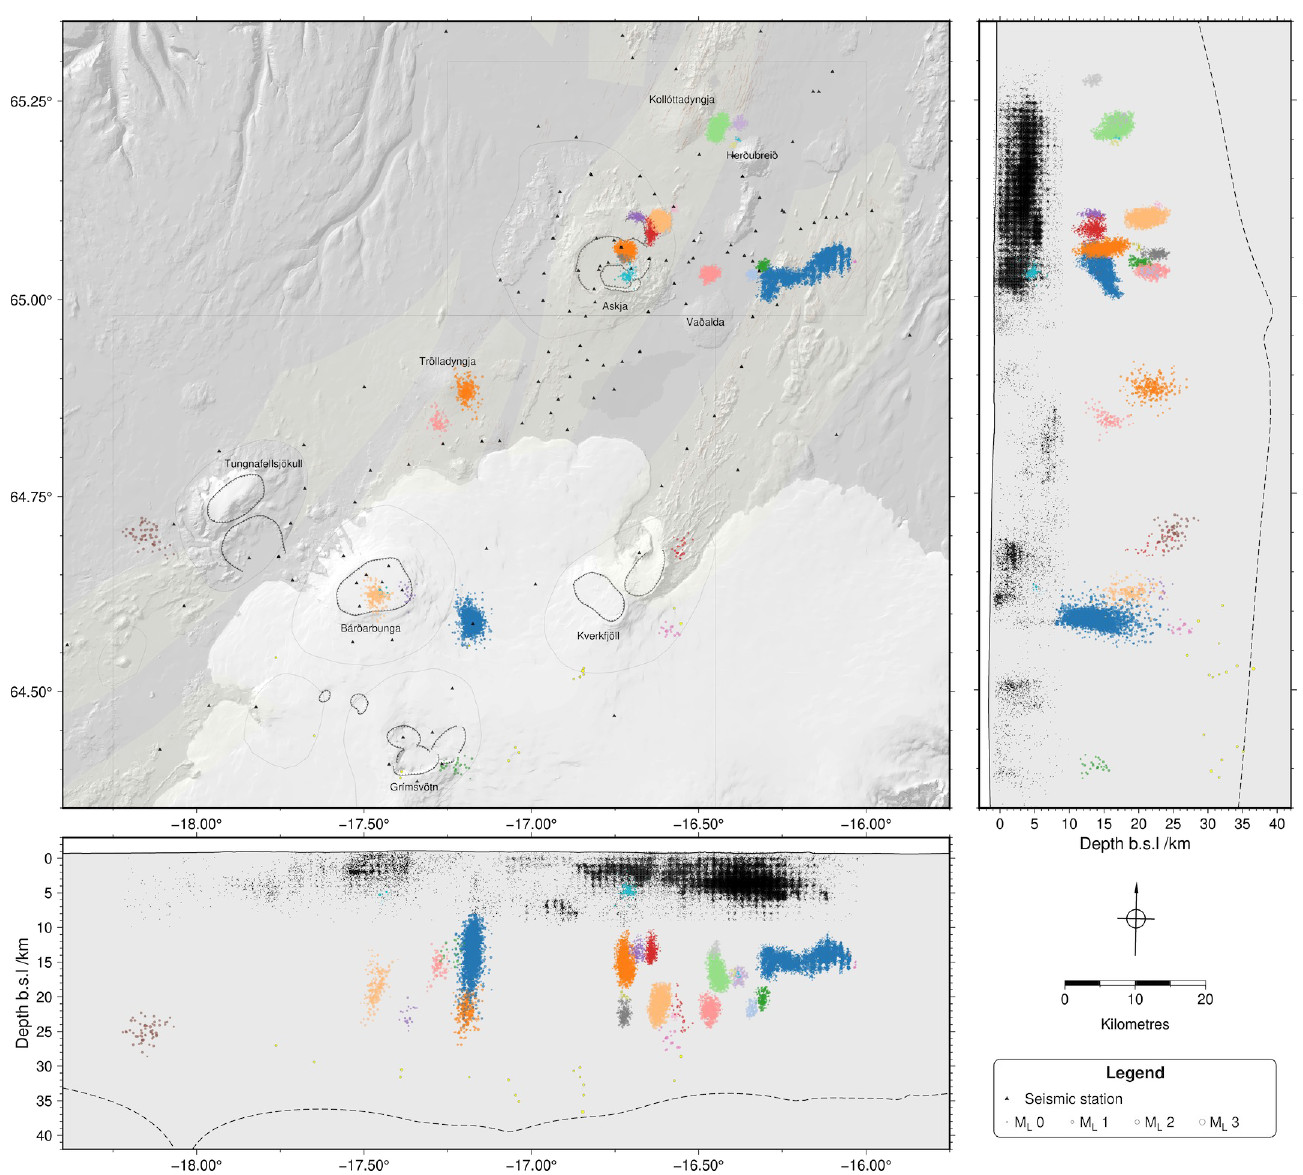
During the deployment period, earthquakes were automatically detected and located from the continuous 3-component data at all stations using QuakeMigrate (Winder et al., 2021) 10, a software package that applies waveform migration and stacking across an array of seismometers. In the period 2022-2023 around Askja, 27,000 events were detected. Figure 5 shows a QuakeMigrate catalogue for the Askja region that spans up to mid 2022. GrowClust (Trugman and Shearer, 2017) 13 a relative relocation method that exploites cross-correlation, can be readily applied to output from QuakeMigrate in order to refine the locations; Figure 5 shows the level of detail that can be achieved with this approach, with clusters of seismicity delineating clear features including active faults. The detection and location of local events is vital for subsequent analysis, including local earthquake shear wave splitting, local earthquake tomography and the determination of focal mechanisms.
2. Local Earthquake shear wave splitting:
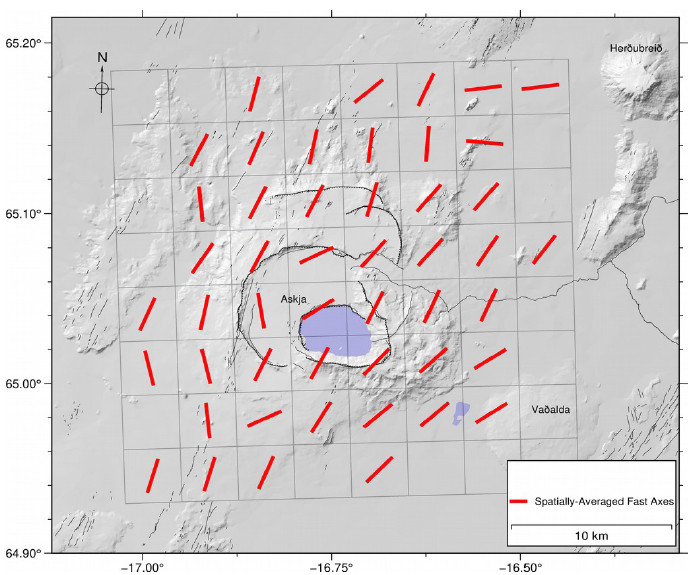
The profusion of local earthquakes in the NVZ, coupled with the large number of stations that are present (Figure 1), means that local earthquake shear wave splitting is a potentially profitable technique to apply. Shear wave splitting parameters in the form of delay time and the orientation of the fast axis of anisotropy are obtained through the application of the Multiple Filter Automatic Splitting Technique, or MFAST (Savage et al., 2010) 14, which uses the eigenvalue minimization algorithm of Silver and Chan (1991) 15. Strict criteria, including a minimum signal to noise ratio of 4, and errors of less than 0.05s delay time and 10° azimuth, are applied to ensure that only good split measurements are retained. Figure 6 shows a plot of the fast axis of orientation in the Askja region.
3. Focal Mechanism solutions in Askja Caldera:
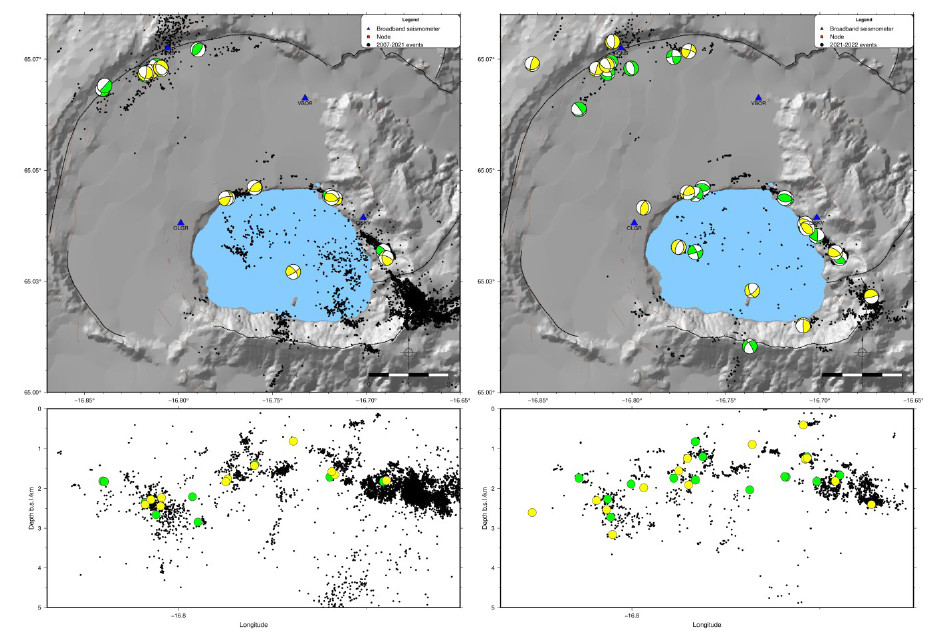
In order to asses whether the switch from deflation to uplift in late July 2021 resulted in any changes to fault orientation or slip, moment tensor solutions were constructed from a subset of events beneath Askja caldera, both before and after the start of re-inflation. From the automatic catalogue results, the locations of which have been refined using GrowClust relative relocations, manual picking of P-wave arrival times and polarities was undertaken. Nonlinloc (Lomax et al., 2000) 16 was then applied to invert arrival times to obtain accurate absolute locations, and MTfit (Pugh and White, 2018) 11 was used to implement a Bayesian moment tensor inversion to constrain a double-couple solution from the first motion dataset. Preliminary results from before and after the switch to reinflation are shown in Figure 7.
4. Local earthquake tomography:
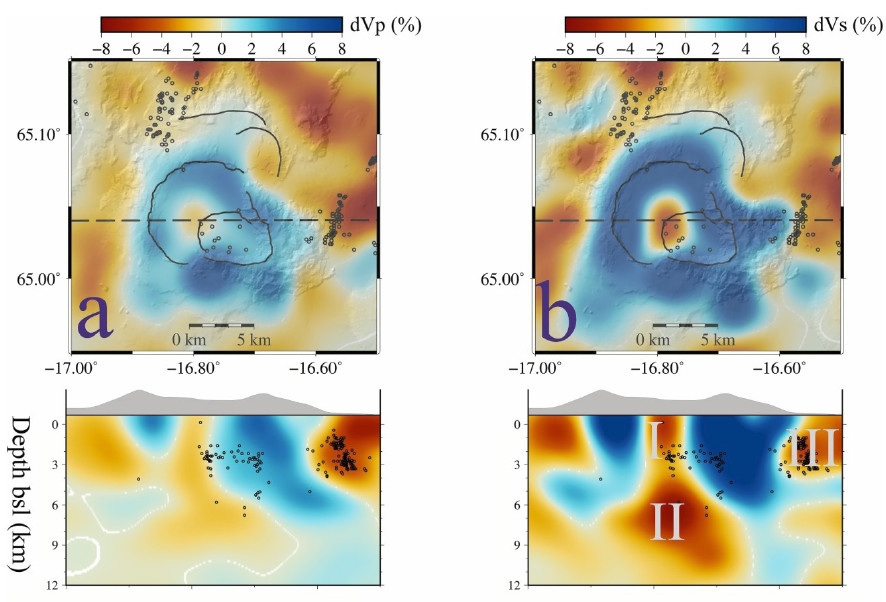
A total of 3,348 local earthquakes that occurred between 2006 and 2022 and recorded by up to 92 seismic stations were exploited for body wave traveltime tomography. Manual picking of P-wave and S-wave arrivals yielded 53,474 P-wave arrival times and 47,231 S-wave arrival times. The dominant frequency of most local earthquakes tends to be between 8-12 Hz, with band-pass filtering between 0.5-20 Hz resulting in the clearest signals. Local Figure 8: Local earthquake tomography results from Askja. (a) dVp earthquake tomography was model; (b) dVs model. I, II and III refer to low velocity anomalies of undertaken using FMTOMO note. (Rawlinson and Urvoy, 2006 17, Pilia et al., 2013 18), which allowed for the joint inversion of P-wave and S-wave arrival times for Vp, Vs and hypocenter location. Since the data coverage between both velocity models was similar, Vp/Vs was obtained by direct division of Vp by Vs. The initial 1-D model used for the inversion was obtained from Velest (Kissling et al. 1994) 19. The hypocenter location was undertaken using a fully non-linear grid search, and was performed in sequence with the velocity inversion. The final results are show in Figure 8, and published in Han et al. (2024) 20.
5. Ambient noise tomography
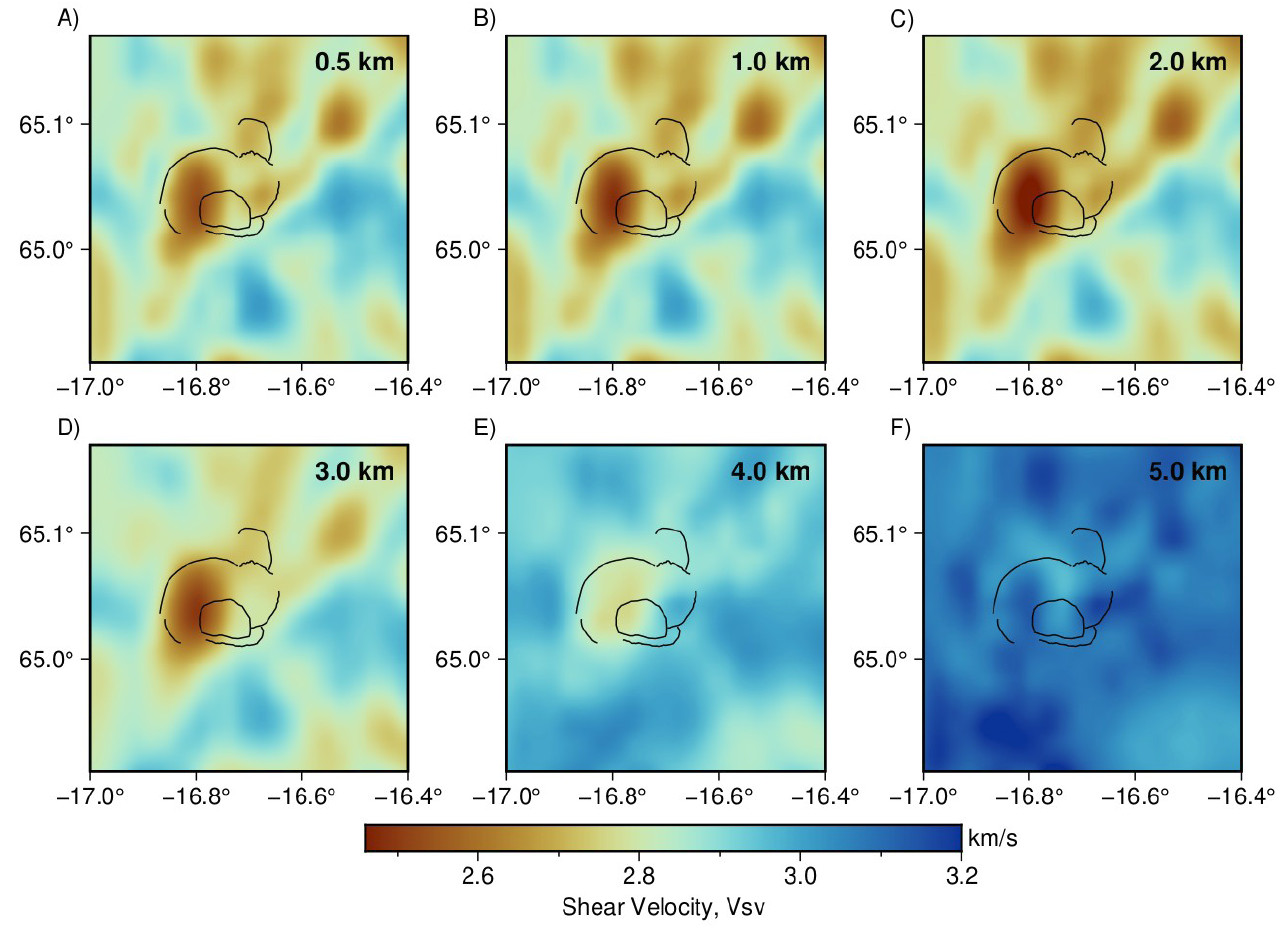
In this study, data covering the Askja region of the NVZ from 2011-2023 is used. The Python package MSNOISE (Lecocq et al., 2014) 21 is applied to produce daily cross-correlations of the components ZZ, EE, EN, NN and NE. The final sets of daily cross-correlations are then stacked using non-linear phase-weighted stacking (Ventosa et al., 2017) 22. TT and RR cross-correlations can then be otained by application of a rotational matrix. FTAN analysis was then used to extract Rayleigh and Love wave phase velocity dispersion. A two step Bayesian transD inversion approach was then applied to first obtain period dependent phase velocity maps, and then 1-D shear wave velocity models on a grid (Bodin et al., 2012) 23. Figure 9 shows a zoomed in plot of the shallow Vsv velocity structure in the upper crust beneath Askja and its neighbourhood, revealing a clear low velocity zone beneath the caldera.
6. Deep earthquakes
A new earthquake catalogue that focuses on deep events beneath the entire study region has been generated using QuakeMigrate, with the search grid set to 60 km b.s.l. Figure 10 shows the results from this procedure, which reveals that deep seismicity tends to occur in “bursts”. Exsolution of magmatic CO2 has previously been suggested as a key mechanism for generating high strain-rates in the vicinity of mid-crustal sills. The distribution of deep seismicity suggests that upward migration of melt is widespread in the central and southern region of the NVZ.
Interpretation to date and preliminary findings
Some of the above results are preliminary, in which case any findings pertaining to them are also preliminary. Local earthquake shear wave splitting demonstrates that the fast axis of anisotropy is aligned with the strike of the rift, which is consistent with Shmax. However, in the neighbourhood of Askja, the pattern becomes disrupted, which may be a signature of the change in fabric, as well as stress imparted by the deflation and subsequent reinflation, as discussed in Drouin et al. (2017) 3 and Parks et al. (2024) 4.
The focal mechanism solutions, although preliminary, generally show that seismicity in the neighborhood of the inner caldera around the crater lake exhibits thrust fault mechanisms, with strikes parallel to the shoreline. This would be consistent with inflation if the fault surfaces are inward dipping, or deflation if they are outward dipping. Either way, it appears that the pattern of fault mechanisms is unchanged from before to after inflation, although the relatively low number of mechanisms needs to be accounted for in any analysis. If this was true, then it appears that the inflation episode has not significantly affected deformation around the lake.
The local earthquake tomography results reveal for the first time a low velocity and high Vp/Vs zone in the shallow crust beneath Aska (Han et al., 2024) 20, at approximately the same depth that geodetic studies image deflation and inflation sources associated with the recent switch to uplift. This shallow anomaly sits above a deeper anomaly at ~6 km bsl that has been imaged in our previous studies. Estimates of melt fraction from Vs and Vp/Vs values, although approximate, appear to suggest that the shallow body comprises between 12-15% partial melt. Also of interest is the fact that this shallow anomaly sits directly beneath the zone of uplift on the western margin of the crater lake, suggesting a direct relationship between it and what is happening at the surface.
The ambient noise tomography results, which are completely independent of the local earthquake tomography results, also show a shallow low velocity zone beneath the caldera. This is imaged between 0.5 and 4 km depth, although this likely contains some component of smearing, due to the depth sensitivity of surface waves. The low velocity zone also corresponds to a zone of elevated radial anisotropy, which effective media modelling suggests can be attributed to sill like intrusions of melt beneath the ediface.
Equipment issues
Overall, the Guralp 6TDs borrowed from SeisUK worked well. However, we had issues with four units from which data were downloaded in August 2023. In each case, the expected volume of data was flushed (~9.2 Gb for 12 months at 50 sps on ZNE, plus 1 sps on ZNE, mass positions and temperature), but on conversion, the data was taken up largely with blank log files and MUX streams. These stretched far into the future, seemingly inversely proportional to how much “real” data the instrument recorded before falling into this state - the most extreme case only recorded 6 weeks of “real” data, followed by blank log files stretching to 2029. Two of the same sensors exhibited similar behaviour when downloaded in 2022, and while there was some suspicion that it might be GPS related, replacing the GPS cable and antenna did nothing to fix the problem, nor did changing the breakout box. This suggests that it is likely related to the inner workings of the 6TD itself. A second feature of the bug is that all stations still stuck in this not-recording state when the servicing team arrived did not communicate over the serial connection until after being powercycled. This further suggests that it is a digitiser-related fault. In summary, this is a serious issue that afflicts the 6TDs, and while apparently not common enough to trigger a widespread community response, effort should be expended to seek a resolution. This problem has been reported multiple times to Guralp, and in a lot more detail, by Tom Winder and Tim Greenfield. However, no solution has been forthcoming, and the extent to which Guralp investigated the problem is not clear.
Conclusions, recommendations and location of the archived dataset
The quality and quantity of 3-component broadband data that the Cambridge Volcano Seismology Group has managed to collect in the Northern Volcanic Zone of Iceland is unprecedented, and has enabled many high impact papers to be published, particularly by graduate students. The support of GEF via SeisUK has been essential, and we are pleased that over the last two years, the contribution of 6TDs has enabled our important work to continue. Our main recommendation from the 2021-2023 period is that burial of the batteries and regulators tends to produce more faults, including shorted-out regulators and battery corrosion due to water ingress, without any measurable benefit. Instead, it is recommended that batteries and regulators be installed in boxes above the surface, which can be used as ballast for the solar panel stand. While this arrangement may not be suitable in other locations, at high latitudes and in extreme environments, it appears to be very successful. Our other recommendation is that SeisUK/GEF engages with Guralp in an attempt to resolve the 6TD issue described above. Data from 2021-2023 is currently archived at the University of Cambridge, but will be made available on the IRIS DMC in the next 12 months.
Publications to date
Han, J., Rawlinson, N., Greenfield, T., White, R. S., Brandsdóttir, B., Winder, T., & Drouin, V. (2024). Evidence of a shallow magma reservoir beneath Askja caldera, Iceland, from body wave tomography. Geophysical Research Letters, 51, e2023GL107851.
Selected international conference presentations
Tom Winder and Robert S White (2021). Slowly migrating tectonic microearthquake swarms in the Icelandic Rift Zone: driven by pore-pressure or aseismic slip transients? EGU General Assembly 2021, Abstract EGU21-15544.
Tom Winder, Robert S White and Bryndís Brandsdóttir (2021). Investigating shallow seismic swarms between Askja and Herðubreið with QuakeMigrate: a new, open-source Python package for automatic earthquake detection and location. Nordic Seismology Meeting
Conor Bacon, et al. (2022). Investigating the response of seismic anisotropy in the crust to the 201415 Bárðarbunga-Holuhraun dyke intrusion and eruption, EGU General Assembly 2022, Abstract EGU22-370.
Tom Winder, Nick Rawlinson, Bryndís Brandsdóttir, Kristín Jónsdóttir and Robert S. White (2022). Microseismicity reveals the fault geometry and internal structure of the re-inflating Bárðarbunga caldera, EGU General Assembly 2022, Abstract EGU22-6071
Glastonbury-Southern, E., Winder, T., White, R. S. & Brandsdóttir, B. (2023). Ring fault slip reversal at Bárðarbunga volcano, Iceland: seismicity during caldera collapse and re-inflation 2014 2018, IAVCEI, New Zealand 2023
Jifei Han, Nicholas Rawlinson, Tom Winder, Tim Greenfield, Robert White, and Bryndís Brandsdóttir (2023). Imaging the Magmatic Plumbing System beneath Askja Caldera, Iceland with Seismic Tomography, EGU General Assembly 2023, EGU23-5638
Tom Winder, Isabel Siggers, Nicholas Rawlinson, Robert White, and Bryndís Brandsdóttir (2023) Earthquake cluster analysis reveals the complex response of microseismicity to the ongoing 2021-2023 inflation at Askja caldera, Iceland, EGU General Assembly 2023, EGU23-13838.
Tom Winder, Isabel Siggers, Nick Rawlinson, Bryndís Brandsdóttir and Robert S. White (2024) The response of microseismicity to re-inflation at Askja caldera, Iceland: new insights from a dense nodal deployment, EGU General Assembly 2024
I. Siggers, T. Winder, N. Rawlinson, R. S. White and B. Brandsdóttir (2024) Earthquake focal mechanisms before and after the onset of re-inflation at Askja caldera, Iceland, EGU General Assembly 2024, EGU24-19414
I. Siggers, T. Winder, N. Rawlinson, R. S. White and B. Brandsdóttir (2024) Re-inflation at Askja caldera, Iceland, as seen by earthquake focal mechanisms, AGU, San Francisco
Tom Winder, Elías Rafn Heimisson, Nick Rawlinson, Bryndís Brandsdóttir, Kristín Jónsdóttir and Robert S. White (2025) High-Resolution Microseismicity Provides Insights into Ring-Fault Geometry at the Re-inflating Bárðarbunga Caldera, Iceland, AGU Chapman Conference, Hawaii
Joe Fone, Tom Winder, Nick Rawlinson, Bob White, Bryndís Brandsdóttir (2025) A detailed view of the magmatic plumbing system beneath Askja Volcano, Iceland, from shear velocity and radial anisotropy extracted from ambient noise tomography, AGU Chapman Conference, Hawaii
I. Siggers, T. Winder, N. Rawlinson, R. S. White and B. Brandsdóttir (2025) Re-inflation at Askja caldera, Iceland, as seen by earthquake focal mechanisms, AGU Chapman Conference, Hawaii
References
-
Einarsson, 1991: Earthquakes and present-day tectonism in Iceland. Tectonophysics, 189, 261-279 ↩
-
Sturkell et al. 2006: 1983-2003 decaying rate of deflation at Askja caldera: Pressure decrease in an extensive magma plumbing system at a spreading plate boundary. Bulletin of Volcanology, 68, 72773 ↩
-
Drouin et al. 2017: Deformation in the Northern Volcanic Zone of Iceland 20082014: An interplay of tectonic, magmatic, and glacial isostatic deformation. Journal of Geophysical Research: Solid Earth, 122, 31583178 ↩ ↩2
-
Parks et al., 2024: 20212023 unrest and geodetic observations at Askja volcano, Iceland. Geophysical Research Letters, 51, e2023GL106730 ↩ ↩2
-
White et al. 2011: Dynamics of dyke intrusion in the mid-crust of Iceland, Earth and Planetary Science Letters, 304, 300312 ↩
-
Green et al. 2017: Ambient noise tomography reveals upper crustal structure of Icelandic rifts. Earth and Planetary Science Letters, 466, 20-31 ↩
-
Ágústsdóttir et al. 2016: Strike-slip faulting during the 2014 Bárðarbunga-Holuhraun dike Intrusion, central Iceland. Geophysical Research Letters, 43, 1495-1503 ↩
-
Woods et al. 2019: Evolution of a lateral dike intrusion revealed by relatively relocated dikeinduced earthquakes: the 2014-15 Bárðarbunga-Holuhraun rifting event, Iceland, Earth and Planetary Science Letters, 506, 53-63 ↩
-
Volk et al. 2021: Oceanic crustal flow in Iceland observed using seismic anisotropy. Nature Geoscience, 14, 168-173. ↩
-
Winder et al 2021: QuakeMigrate: a modular, open-source python package for automatic earthquake detection and location. Authorea Preprints ↩ ↩2
-
Pugh and White 2018: MTfit: A Bayesian approach to seismic moment tensor inversion. Seismological Research Letters, 89,1507-1513 ↩ ↩2
-
Peterson, 1993: Observations and modeling of seismic background noise, Open_File Report 93-322, USGS ↩
-
Trugman and Shearer 2017: GrowClust: A Hierarchical Clustering Algorithm for Relative Earthquake Relocation, with Application to the Spanish Springs and Sheldon, Nevada, Earthquake Sequences. Seismological Research Letters, 88, 379-391 ↩
-
Savage et al. 2010: Automatic measurement of shear wave splitting and applications to time varying anisotropy at Mount Ruapehu volcano, New Zealand. Journal of Geophysical Research, 115, 117 ↩
-
Silver and Chan 1991: Shear wave splitting and subcontinental mantle deformation, Journal of Geophysical Research, 96, 1642916454 ↩
-
Lomax et al. 2018: Probabilistic earthquake location in 3D and layered models. In Advances in seismic event location, pp. 101134 ↩
-
Rawlinson and Urvoy 2006: Simultaneous inversion of active and passive source datasets for 3-D seismic structure with application to Tasmania, Geophysical Research Letters, 33, L24313 ↩
-
Pilia et al. 2013: Structural controls on localized intraplate deformation and seismicity in southern Australia: insights from local earthquake tomography of the Flinders Ranges, Journal of Geophysical Research: Solid Earth, 118, 21762190; ↩
-
Kissling et al. 1994: Initial reference models in local earthquake tomography, Journal of Geophysical Research: Solid Earth, 99, 19635-19646 ↩
-
Han et al. 2024: Evidence of a shallow magma reservoir beneath Askja caldera, Iceland, from body wave tomography. Geophysical Research Letters, 51, e2023GL107851 ↩ ↩2
-
Lecocq et al. 2014: MSNoise, a Python Package for Monitoring Seismic Velocity Changes Using Ambient Seismic Noise, Seismological Research Letters, 85, 715-726 ↩
-
Ventosa et al. 2017: Extracting surface waves, hum and normal modes: time-scale phase-weighted stack and beyond. Geophysical Journal International, 211, 30-44 ↩
-
Bodin et al. 2012: Transdimensional tomography with unknown data noise. Geophysical Journal International, 189, 1536-1556 ↩