Scientific Report 1127
This report is also available as a PDF document .
Abstract
SEIS-UK supplied seven Güralp 6TD seismometers to monitor landslide processes at the Hollin Hill Landslide Observatory, North Yorkshire, UK. All stations were deployed in March 2020 and removed in March 2022, complementing a pre-existing deployment of three seismometers at the site. A sampling rate of 200 sps was used for the GEF seismometers, and data recovery was 85%. Eight service runs were completed over the two-year monitoring period, retrieving data and servicing the seismometers at an average interval of four months. The data have been archived in the SEIS-UK data management system Octomore and have been uploaded to the Incorporated Research Institutions for Seismology (IRIS) data management centre (Network code YJ, station IDs 2001 - 2007). The main purpose of the deployment was to investigate the transfer of seismological tools traditionally used for monitoring large-scale geohazards (volcanoes, earthquakes, etc.) to slowly deforming, smaller-scale, high-risk slope hazards, in response to increasing demand for slope monitoring solutions in the UK to protect people and critical infrastructure. Preliminary analyses of the data have investigated i) data quality, ii) automatic event detection of slope failures, iii) horizontal-to-vertical (H/V) ratio of individual stations, and iv) cross-correlation of ambient noise to identify slope-scale changes in shear wave velocity.
Background
The Hollin Hill Landslide Observatory (HHLO) is a field observatory and laboratory that has been operated by the British Geological Survey (BGS) for over 15 years. The site has been important in the research and development of novel geophysical, geotechnical and remote sensing technologies for the observation and monitoring of natural landslide processes. The HHLO is representative of many UK landslide hazards, as the underlying Lias Group rocks account for 15% of all landslides in the UK (Hobbs et al., 2012). The Hollin Hill landslide is a slow moving, clay-rich landslide, which is seasonally reactivated when soil moisture increases in winter. In summer, it experiences high shrinkage and surface fissuring. The HHLO is located on a south facing slope which comprises a series of interbedded, north-dipping, shallow marine mudstones and sandstone, comprising (in descending order) the Dogger Formation (DF), which is a limestone and sandstone unit acting as a minor aquifer, the Whitby Mudstone Formation (WMF), the Staithes Sandstone Formation (SSF), and the Redcar Mudstone Formation (RMF). The WMF is the main unit prone to failure. The top of the slope exhibits rotational failures in the WMF with several prominent backscarps, the most recent of which has been developing since 2016. The landslide shifts to translational displacement mid-slope, with some large flow lobes of mudstone materials creeping on top of the SSF toward the base of the slope (Figure 1).
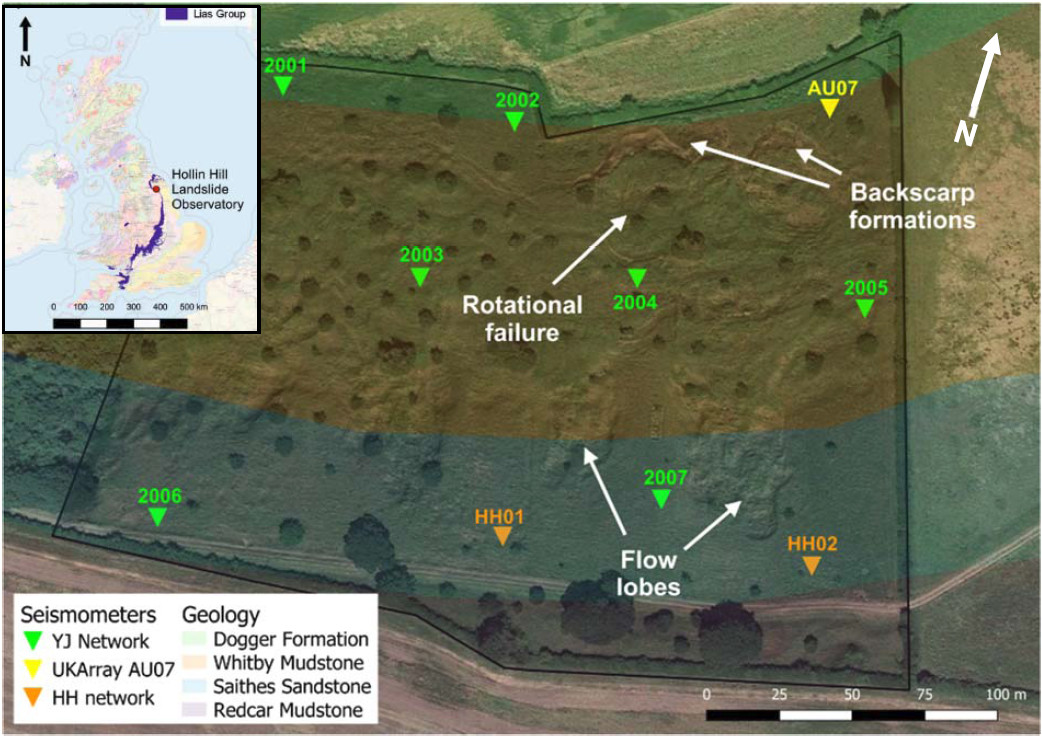
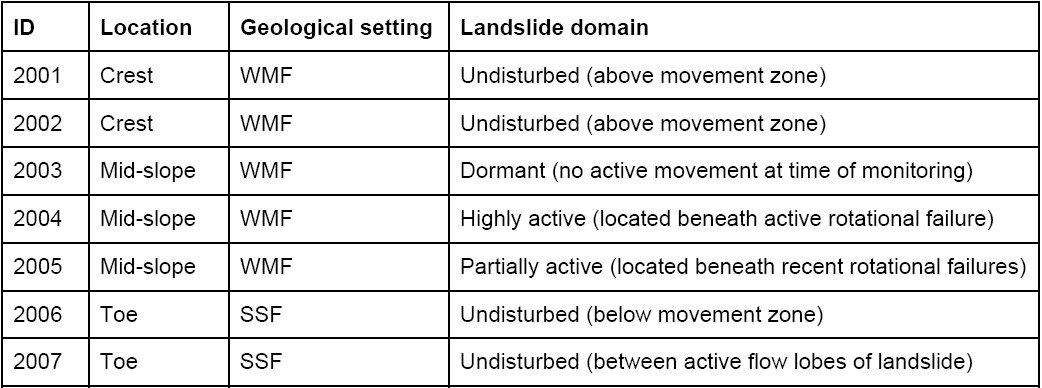
Past research at the HHLO has highlighted the advantages of using continuous passive seismic monitoring approaches to complement other spatially high-resolution geophysical methods, such as geoelectrics, to provide combined high resolution spatiotemporal monitoring of the subsurface (Whiteley et al., 2019). A PhD studentship, concluded in 2022, demonstrated that seismological monitoring at the HHLO via a sparse network of three broadband seismometers, comprising two Nanometrics Trillium 120 seismometers (University of Bristol; not currently archived, local station IDs HH01 and HH02) and a Güralp CMG-3ESP (British Geological Survey; network UR 2015 present, station ID AU07). A key finding of this PhD research is that variations in the elastic properties of landslide materials are controlled by saturation levels (Whiteley et al., 2020). GEF loan 1127 allows us to test the hypothesis that seismometer setting, e.g., siting seismometers on different landslide domains, comprising areas with different failure mechanisms (i.e., translational/creep), underlying geology (i.e., WMF/SSF) (Table 1), will have an influence on the single-station analysis of seismological data, providing landslide domain characterisation and monitoring using passive seismic data. Additionally, GEF loan 1127 test the hypothesis that changes in relative surface-wave velocity, derived through cross-correlation of ambient noise, can be used to detect variations in shear strength of landslide materials, which is critical for earlywarning of slope failures.
Survey procedure
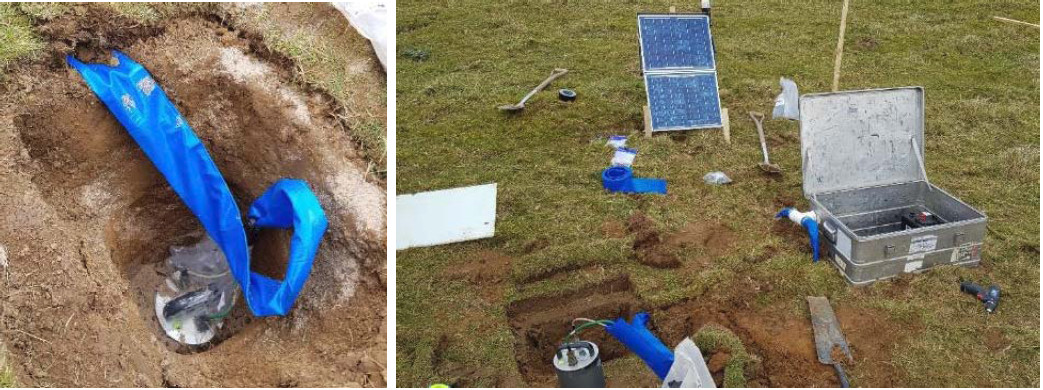
Survey procedure Training on the installation of the 6TDs was provided by SEIS-UK in January 2020, and they were deployed between 9 and 11 March 2020 following the SEIS-UK deployment procedure. The seismometers were buried 40 cm below ground in a pit filled with sand. Each station was powered by a 12V battery installed in a metal box recharged by 2 x 20W solar panels mounted on a wooden frame. The metal box was customised by BGS to allow the connection of two lengths of hose via plastic push-fit connectors into the storage box. This provided extra protection for the cabling from livestock and moisture ingress (Figure 2).
The 6TDs were configured to record at 200 sps. With this configuration, the 6TDs could store up to 4 months of data. Eight service runs were completed on schedule, with the exception of one run in Spring 2021 which was delayed due to the impact of Covid-19 on staff availability (Figure 3). This service run was conducted a few days after the data storage disks reached capacity. Details of activities during deployment, on each service run and during decommission were recorded on service sheets, which were scanned and archived.
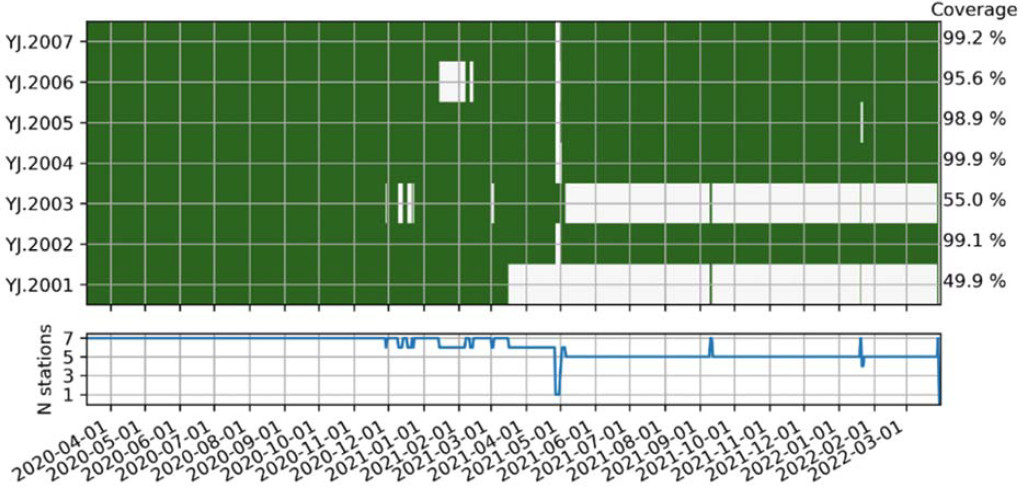
One seismometer (YJ.2004) failed during the deployment due to extensive subsurface flooding of the installation, and a replacement sensor was provided by SEIS-UK. Two stations (YJ.2001 and YJ.2003) had persistently failed shortly after service runs, with issues commencing in winter and spring 2021 respectively. These issues were associated with blown fuses, although no exact cause for the this was determined. Neither station was able to record data for significant lengths of time after these dates. Five of the seven 6TDs had >95% data coverage, with network-wide data coverage being 85% for the two-year monitoring period.
Data quality
The quality of recorded data is good, with the secondary microseism being closer to the high model of Peterson (1993), as can be expected in an island (Figure 4).

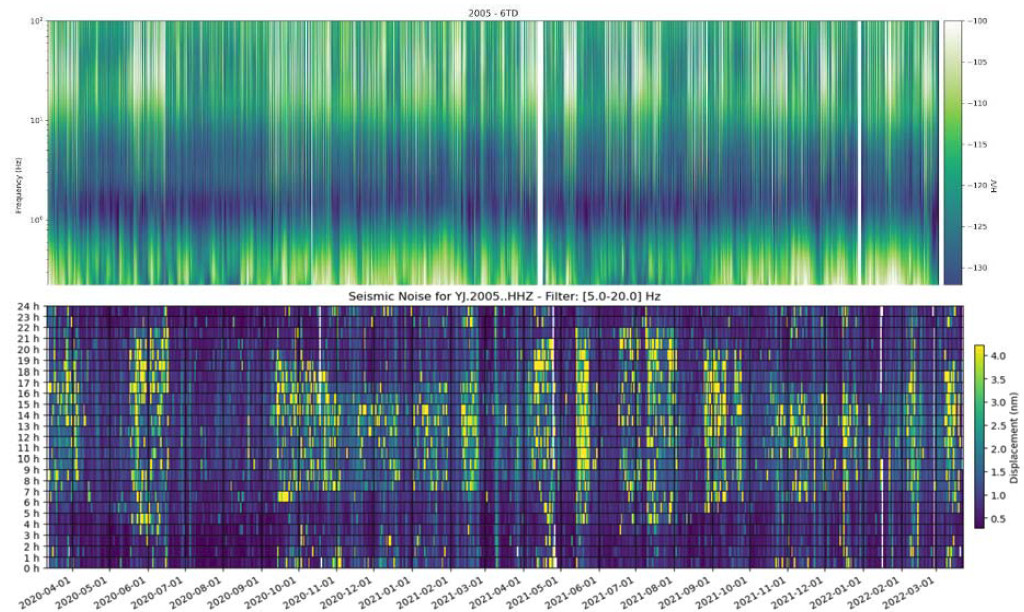
The HHLO site is relatively remote, and higher frequency noise is mainly influenced by farming activity, and especially the presence of sheep in the field. The high frequency noise level increases significantly in the breeding season (Figure 5) and presents an interesting but challenging noise source to consider in the processing and modelling steps.
Processing and modelling
- Seismic events analysis
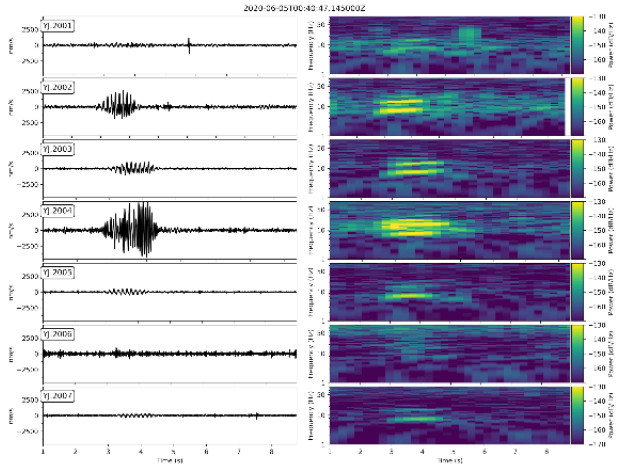
We applied a series of classic STA/LTA filters on the YJ network inventory and detected a range of seismic events, of which some have a local source. Amongst events attributed to local environmental noise sources (farming activities, livestock on site, etc.), one signal is thought to be related to the landslide activity (Figure 6). This event type was observed on several occasions (> 100 occurrences), mainly in dry conditions. It has a short duration (<2 s) and shows harmonic-like frequency components (in the 7-25 Hz band), which may indicate the opening of fractures during periods of clay-shrinkage.
- Seismic noise analysis
Continuous H/V
We developed an approach to compute temporal H/V ratios (Nakamura, 1989) based on the ratios between hourly power spectral density (PSD) spectrograms of the horizontal and vertical components. The resulting H/V ratios can be displayed as a spectrogram showing the stability and frequency shifts of major and minor frequency peaks (Figure 7). Figure 7 shows that our approach delivers similar H/V plots as those computed with the Geopsy software (Wathelet et al. 2020). Temporal H/V spectrograms are useful to study the subsurface changes underneath each station. On the YJ network dataset, we have found that some of the secondary peaks appear seasonally, which can be related to the occurrence of temporary perched water tables in winter, or increased impedance contrast in summer between relatively drier mudstone and wetter underlying sandstone. Investigating the noise source is required to draw further interpretations. Data for some of the stations also experience shifts in the secondary peak frequency which are linked to shear wave velocity variations in the upper layers due to change in moisture content. These variations are also investigated via ambient noise cross-correlation.

Ambient noise cross-correlation and velocity change
Ambient noise data were processed with MSNoise (Lecocq et al., 2014), broadly following the steps described by Bensen et al. (2007). Hourly seismograms were split into 60s long segments which were cross correlated between each possible pairs (21 pairs when all stations were recording) for the ZZ, EE and NN components (Figure 8). The cross-correlations were stacked for each day. The seismic velocity change was computed following the moving window crossspectral (MWCS) technique (Clarke et al., 2011) on the coda of the cross-correlations. Seismic velocity changes (dv/v) are derived from relative travel-time variations (dt/t) detected in a sliding window of the coda wave.
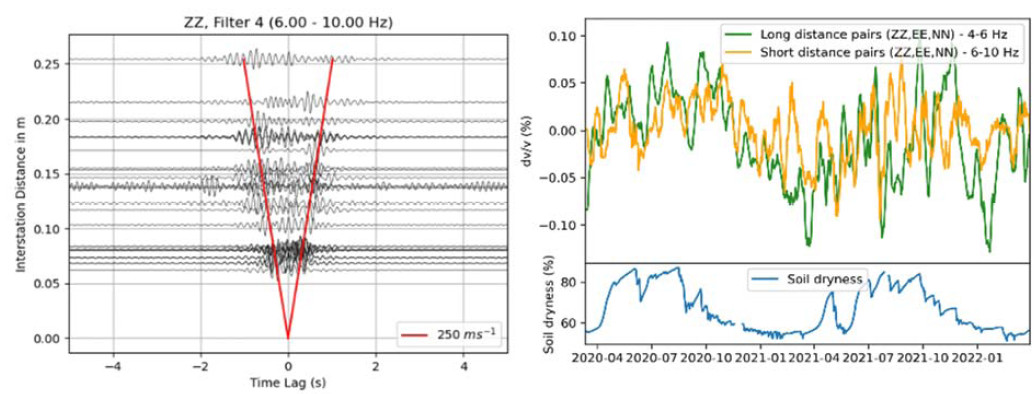
Preliminary results on specific frequency bands suggest a link between soil moisture and velocity change (Figure 8), with velocity decreasing as or soil dryness decreases. Further analyses on a broader range of frequency bands are ongoing, following the approach presented in Oakley et al. (2021). These further analyses will include rotation into a coordinate system aligned with the local surface slope, because high-frequency surface waves are expected to follow the surface topography.
Conclusions and recommendations
From March 2020 to March 2022, we operated a network of seven 6TD seismometers, provided by SEIS-UK, at the HHLO to monitor landslide processes. This dataset has demonstrated the potential for the application of approaches typically applied to monitoring large-scale geohazards (volcanoes, earthquakes, etc.) to investigate shallow, hydrologically controlled landslide processes. These investigation approaches include i) the use of seismic event detection (STA/LTA filters) to identify crack generation during dry summers, ii) determination of continuous H/V profiles to monitor changes in peak resonance frequency associated with hydrologically controlled impedance contrasts and velocity changes, and iii) ambient noise cross-correlation to obtain broad changes in near-surface velocity associated with soil wetting and drying processes.
To further identify and investigate the (micro)seismic events generated by landslide activity, AIbased approaches are being developed via a collaboration with the University of Strathclyde. Furthermore, data from the 6TD network will be used to compare and contrast seismic measurements made by a distributed acoustic sensing (DAS) system that was deployed at the site broadly across the same time period. A recommendation for future deployments of this nature would be to explore the use of large-n nodal systems that would be able to provide much higher spatial resolution and with lower deployment effort, although the suitability of such as deployment for long-term monitoring would be less favourable.
Location of the archived data
SEIS-UK Octomore data management system and IRIS data management centre with network code YJ 2020 - 2023 (see https://www.fdsn.org/networks/detail/YJ_2020/) with DOI 10.7914/SN/YJ_2020.
Publications to date
Watlet, A., Whiteley, J., Lane, V., Dashwood, B., Morgan, D., Chambers, J.E., Lecocq, T., 2020. Deployment of a long-term seismic network on a moisture-induced, slow moving, clay-rich landslide. AGU Fall Meeting 2020. S021-0014.
Reis, W., 2022. Risk presented by slope failure: how can broadband seismology assist seismic hazard assessment, British Seismology Meeting 2022.
Reis, W., Lindsey, J., Hill, P., Watkiss, N., Cilia, M., 2021. Omnidirectional Seismometers for Monitoring Slope Failure. AGU Fall Meeting 2021. NS25C-0438.
References
Bensen, G. D., Ritzwoller, M. H., Barmin, M. P., Levshin, A. L., Lin, F., Moschetti, M. P., et al. (2007). Processing seismic ambient noise data to obtain reliable broad-band surface wave dispersion measurements. Geophysical Journal International, 169(3), 12391260
Clarke, D., Zaccarelli, L., Shapiro, N. M., & Brenguier, F. (2011). Assessment of resolution and accuracy of the Moving Window Cross Spectral technique for monitoring crustal temporal variations using ambient seismic noise. Geophysical Journal International, 186(2), 867-882
Hobbs, P. R. N., Entwisle, D. C., Northmore, K. J., Sumbler, M. G., Jones, L. D., Kemp, S., Self, S., Barron, M. & Meakin, J. L. 2012. Engineering geology of British rocks and soils : Lias Group. In: Northmore, K. J. (ed.)
Krischer, L., Megies, T., Barsch, R., Beyreuther, M., Lecocq, T., Caudron, C. & Wassermann, J. 2015. ObsPy: a bridge for seismology into the scientific Python ecosystem. Computational Science & Discovery, 8, 014003
Lecocq, T., Caudron, C. & Brenguier, F. 2014. MSNoise, a Python Package for Monitoring Seismic Velocity Changes Using Ambient Seismic Noise. Seismological Research Letters, 85, 715-726.
Lecocq, Thomas, Stephen P. Hicks, Koen Van Noten, Kasper Van Wijk, Paula Koelemeijer, Raphael SM De Plaen, Frédérick Massin et al. “Global quieting of high-frequency seismic noise due to COVID-19 pandemic lockdown measures.” Science 369, no. 6509 (2020): 1338-1343.
Merritt, A. J., Chambers, J. E., Murphy, W., Wilkinson, P. B., West, L. J., Gunn, D. A., Meldrum, P. I., Kirkham, M. & Dixon, N. 2013. 3D ground model development for an active landslide in Lias mudrocks using geophysical, remote sensing and geotechnical methods. Landslides, 11, 537-550.
Nakamura, Y. (1989). A method for dynamic characteristics estimation of subsurface using microtremor on the ground surface. Railway Technical Research Institute, Quarterly Reports, 30(1).
Oakley, D. O., Forsythe, B., Gu, X., Nyblade, A. A., & Brantley, S. L. (2021). Seismic ambient noise analyses reveal changing temperature and water signals to 10s of meters depth in the critical zone. Journal of Geophysical Research: Earth Surface, 126(2), e2020JF005823.
Peterson, J. R. (1993). Observations and modeling of seismic background noise (No. 93-322). US Geological Survey. Watlet, A., Whiteley, J., & Chambers, J. (2020). Yorkshire Landslide Observatory [Data set]. International Federation of Digital Seismograph Networks. [https://doi.org/10.7914/SN/YJ_2020]
Whiteley, J. S., Chambers, J. E., Uhlemann, S., Wilkinson, P. B. & Kendall, J. M. 2019. Geophysical Monitoring of Moisture-Induced Landslides: A Review. Reviews of Geophysics, 57, 106-145.
Wathelet, M., Chatelain, J. L., Cornou, C., Giulio, G. D., Guillier, B., Ohrnberger, M., & Savvaidis, A. (2020). Geopsy: A userfriendly opensource tool set for ambient vibration processing. Seismological Research Letters, 91(3), 1878-1889.
Whiteley, J. S., Chambers, J. E., Uhlemann, S., Boyd, J., Cimpoiasu, M. O., Holmes, J. L., Inauen, C. M., Watlet, A., Hawley-Sibbett, L. R., Sujitapan, C., Swift, R. T. & Kendall, J. M. 2020. Landslide monitoring using seismic refraction tomography The importance of incorporating topographic variations. Engineering Geology, 268, 105525.
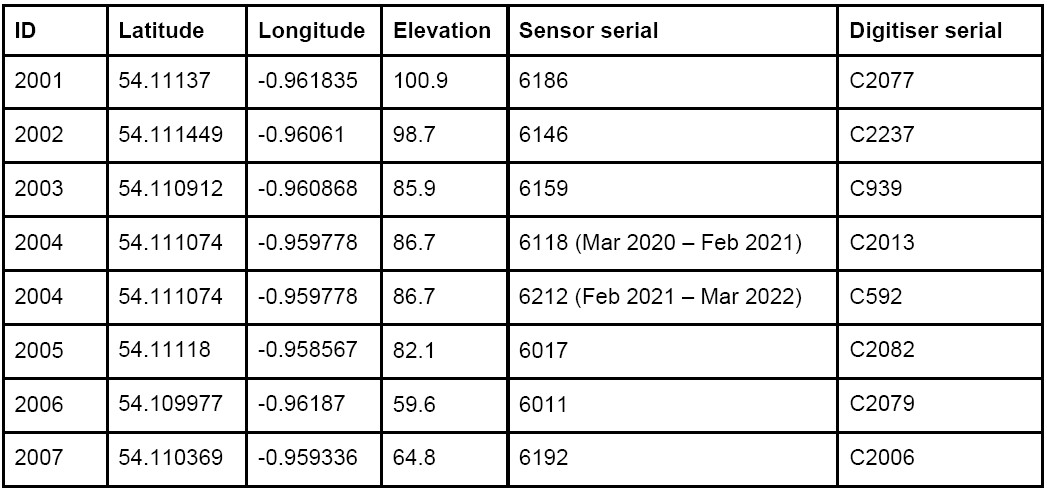
Table of instrument deployment details
