Scientific Report 1109
This report is also available as a PDF document .
Abstract
The purpose of Loan 1109 was to support the deployment of an Unmanned Aerial Vehicle (UAV) collecting LiDAR data and digital aerial photographs (DAP) over remote tropical forests and peatlands in the Republic of Congo, Peru and Gabon. These data were obtained as part of two projects entitled CongoPeat and FODEX (Tropical Forest Degradation Experiment), with data collection taking place in February 2019 and June - July 2019, respectively. The aim of the CongoPeat campaign was to measure changes in surface elevation across sections of the world’s largest tropical peatland complex in the Congo Basin, providing clues to its formation and functioning. The LiDAR data revealed a clear rise in surface elevation, thus indicating a domed structure, which suggests the peatland is rain-fed. Accurately mapping these subtle changes in elevation was greatly improved using the GNSS receivers. The objective of the FODEX campaigns to Peru and Gabon was to establish forest inventory plots and conduct LiDAR and photogrammetry surveys prior to the sites being logged. These were first of several campaigns that will measure and monitor changes in forest structure and carbon stocks following human disturbance. The data collected under Loan 1109 was used to assess the extent to which `Structure from Motion’ (SfM) techniques can replicate LiDAR data across forests of varying density and structure. Technical problems meant the pre-logging data collection at our second field site in Gabon, scheduled for September 2019, was postponed until January 2020 and thus falls under Loan 1124, although some of the final results are included in this report for completeness. We find that SfM data cannot be considered a reliable substitute for LiDAR, particularly in tall forests with a canopy cover >80%. The results have clear relevance for projects seeking to measure and monitor tropical forest structure and biomass by highlighting the need for LiDAR data.
Background
The FODEX (Forest Degradation Experiment) is a 5-year experiment (July 2018 - July 2023) that aims to shed new light on the status of the world’s tropical forests and how they are changing in response to human activities. Tropical forests and woodlands are estimated to contain around 375 billion tonnes of carbon 1, however we still don’t know with any certainty whether these carbon stocks are increasing or decreasing over time. This is in part because existing static maps of carbon stocks 2 typically have wide uncertainties (±50 %) 3. Maps of change are rare and often not validated 4, and when they are, often no relationship is found between field- and remote sensing-estimated changes 5. The project will address this uncertainty by developing new methods for mapping carbon stock change using satellites, allowing us to accurately assess the balance of regrowth and anthropogenic disturbance across tropical forests and the status and resilience of the land surface carbon sink.
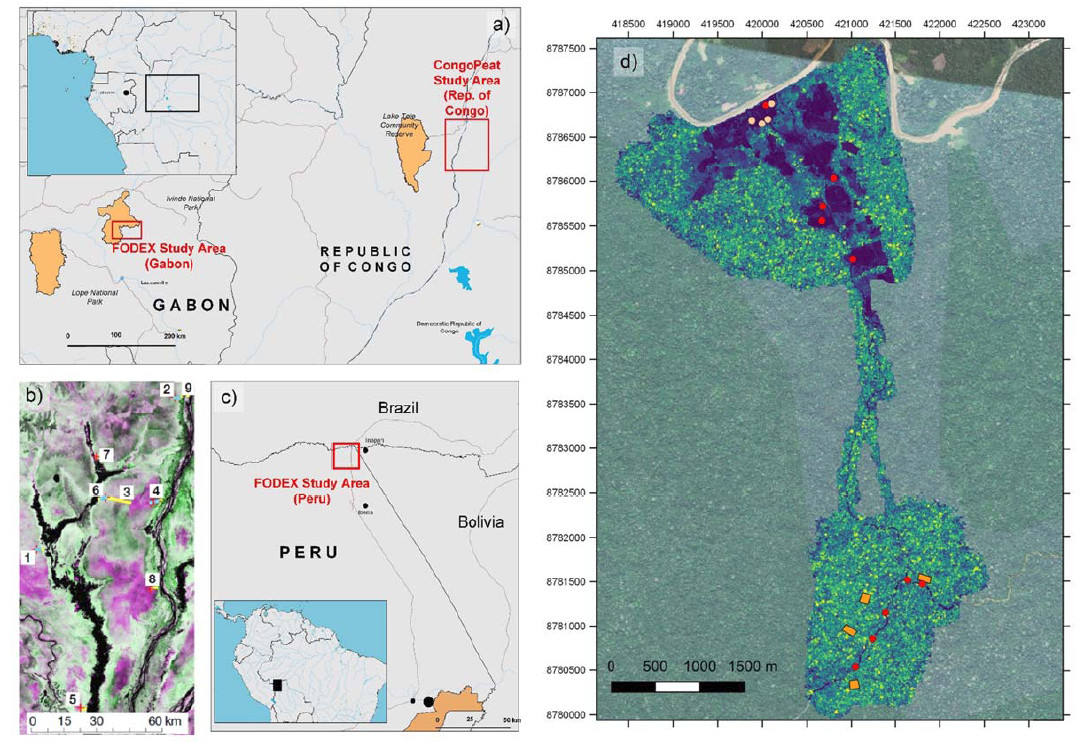
This will be achieved using twin large scale field manipulation experiments located in the Peru and Gabon (Figure 1), where we are collecting Terrestrial Laser Scanning (TLS) data alongside traditional forest inventory techniques before and after controlled logging meaning the actual change in aboveground tree volume and biomass can be used to train and test models of change (Figure 2). These ground data will be compared to LiDAR data collected via a 3.3m wingspan UAV (Delair DT26X UAV equipped with a Riegl miniVUX, worth ~250K) and a 24 MP camera. This is supplemented by a smaller UAV (Delair DT18) housing a MicaSense RedEdge multispectral camera. The UAVs are capable of collecting high resolution (cm level) data on tree structure and health over large areas (~ 10 km2), information that is unobtainable using ground and/or satellite based platforms. These data will be collected several times over each concession, which will be used to scale the ground data to give thousands of hectares of biomass change data, and solve the current mystery of how errors in biomass and biomass change mapping vary with scale. As part of the initial data collection phase, we also set out to examine whether `Structure from Motion’ (SfM) photogrammetry can reliably capture various aspects of forest structure which are relevant for biomass estimation, and our understanding of wider forest function. The SfM approach, a cheaper alternative to LiDAR, relies on extracting and matching the same features in multiple images collected from different positions in order to generate 3D model of the visible surface. This ultimately requires the collection of accurate and precise information on the location of the field plots, and the flight trajectory of both of our UAVs in order to properly generate and then combine these multi-scale datasets.
The CongoPeat project (September 2018 - August 2023) builds upon a previous NERC grant which measured and described for the first time what turned out to be the world’s largest tropical peatland complex, located in in the Congo Basin (Figure 1). The peatland, which covers ~145,000 sq. km, is estimated to be 10,600 years old and contain ~30 billion tonnes of carbon 6. They occupy large inter-fluvial basins, with evidence suggesting they are primarily fed by rainfall, however, such peatlands usually form domed structures yet satellite data do not show this feature. Understanding how these areas are formed is important when predicting how they will respond to changes in precipitation, and/or human land use change (e.g. drainage for agriculture). To address this question, we set out to measure the height of the peatland surface along several long (5 km +) transects running from the peatland edge using our UAV LiDAR. As with the FODEX campaign, accurate and precise data on the UAV position is required to ensure that the likely small changes in elevation are correctly measured.
To this end, we requested the loan of two Leica GNSS Systems; one to act as Base Station for the purpose of correcting both the UAV trajectory, and the data from the second system, which acted as the Rover and was used to collect additional ground control and reference points to further refine and correct both the LiDAR and SfM derived point clouds.
In this report, we largely focus on the data and results from the FODEX field campaign to Peru. The aforementioned technical issues that affected the CongoPeat and FODEX campaign to Gabon meant that data collection was limited.

Survey Procedure
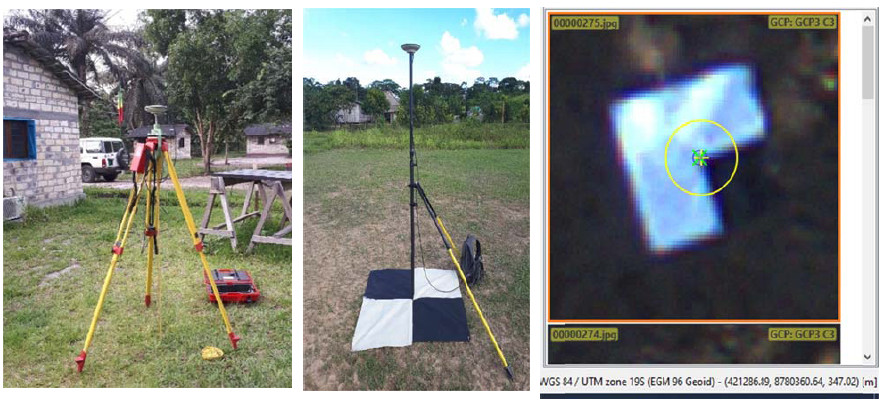
Comparing the various ground, airborne and satellite derived datasets on ground elevation, and forest structure and its changes over space and time, requires the ground and UAV data to be accurately co-registered in relative terms with centimetre precision. This can only be obtained using high-precision GNSS receivers. The UAV with the LiDAR and RGB camera is equipped with a GNSS receiver capable of Post Processing Kinematic (PPK) correction, however, the nearest reference stations are several hundred kilometres from the field sites. The solution was to establish a temporary reference station at each field site, which can then be used as basis for a PPK correction of the UAV flight trajectory, and ground control points (GCPs) which will allow additional adjustments and validation (Figure 1). The Leica GS10 base receiver was deployed in an open area at each site at and initially left for 24 - 48 hours to obtain enough data for an accurate and precise estimate of its position. A physical marker (typically metal re-bar inserted in ground) was used as a reference point to position the receiver. For FODEX field campaign in Peru, this process was repeated three times over the course of 4 weeks using different recording times to estimate any uncertainty on the position, and ensure the position of the receiver remained static over the course of the study period. The receiver runs in-sync (1 measurement/s) with the UAV and was set to record data for an hour before and after each day’s missions to allow PPK correction. Prior to the commencement of the FODEX UAV missions in Peru (and Gabon), a minimum of three (GCPs) - square targets 1 - 2 m2 in size composed of alternating black and white material arranged in a checkerboard pattern were placed across the road/ track network to allow further correction of the flight trajectory and help support co-registration during the processing of each mission. Additional marker points, such as buildings and other invariant objects (e.g. solar panels, road marker posts) were used to refine and check the accuracy of the final datasets. These were geo-located using the GS10 rover receiver, which was left a minimum of 3 - 5 minutes over each target, or until the DOP values reached a plateau. As with the base station, repeat measurements were made over a subset of these GCPs / marker points account for measurement error in the initial collection. For the CongoPeat missions, GCP placement was impossible for large parts of the study area, and not necessary to achieve the aims of the work.
Processing and modelling
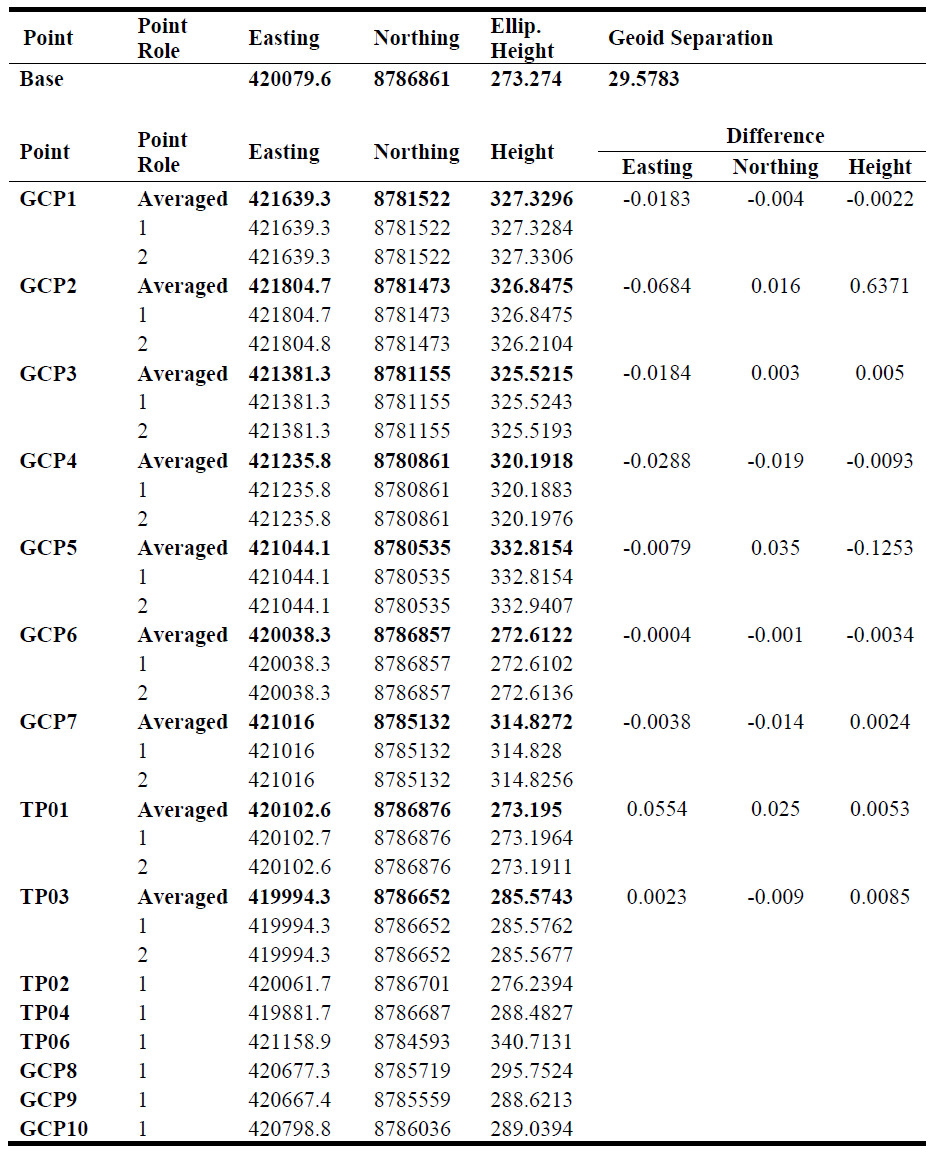
The GS10 base station and GS10 rover GNSS data were processed using the Leica GeoOffice software. The GS10 data were corrected using the Trimble CenterPoint RTX Post-Processing Service (Table 1). The rover receiver data were then tied to the base station in GeoOffice and the results exported in their local UTM coordinates. The flight trajectories of the LiDARRGB UAV were reconstructed using the GNSS/ IMU measurements and then adjusted using the differentially corrected base station data within the Applanix POSPac Software. The corrected flight paths and laser data were combined using the RIEGL software package, RiPROCESS to generate the initial laser 3D point cloud. The SfM analysis was performed using the software Pix4Dmapper. Residual errors in the flight trajectory, e.g. due to discrepancies in GPS tracking and elevation, were identified and corrected in the LiDAR data using the small buildings for reference to further adjust the relative position and orientation (i.e. line-up) of individual laser scans. The trajectories were then further refined using the corrected GCPs resulting in a final laser derived point cloud with a geometric accuracy of 1.8 cm.
GNSS Data Quality
In Peru, the absolute distance between repeatedly measured points (x,y,z) was 1.9 cm [min = 0.3 cm; max = 64 cm], with relatively large differences in the estimated height of GCP2 and GCP5. The horizontal positions were relatively consistent (1.8 cm [0.1 0.7 cm]), indicating the named targets had not been shifted (e.g. by humans) and that the observed differences in height are more likely related to the quality of the measurements themselves. There are two possible reasons for this; the first is that the targets were poorly placed in comparison to the others leading to a small number of available satellites, with the second being that the length of measurement was too short. The former can and will be verified, however moving forward, it is likely that measurement time will be increased from the original 5 minutes, particularly when working in areas with potentially significant (but not obscuring) tree cover.
Interpretation and Preliminary findings
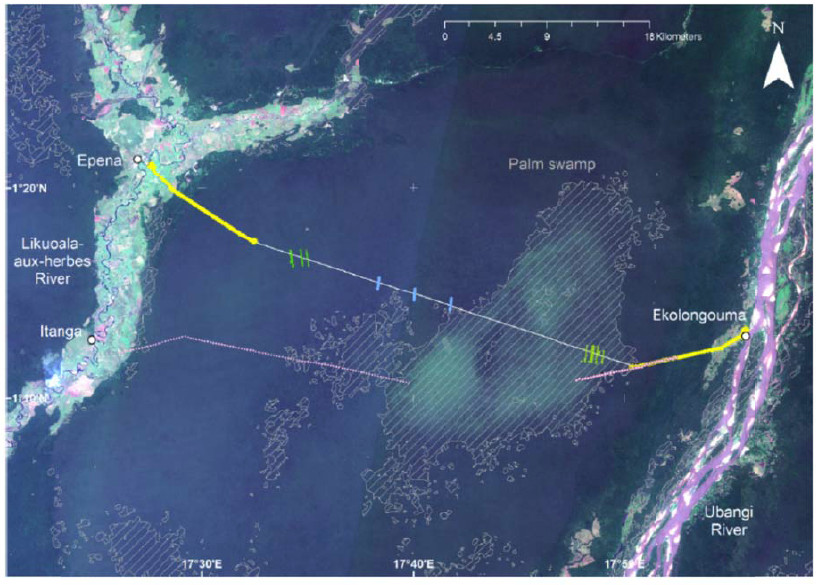
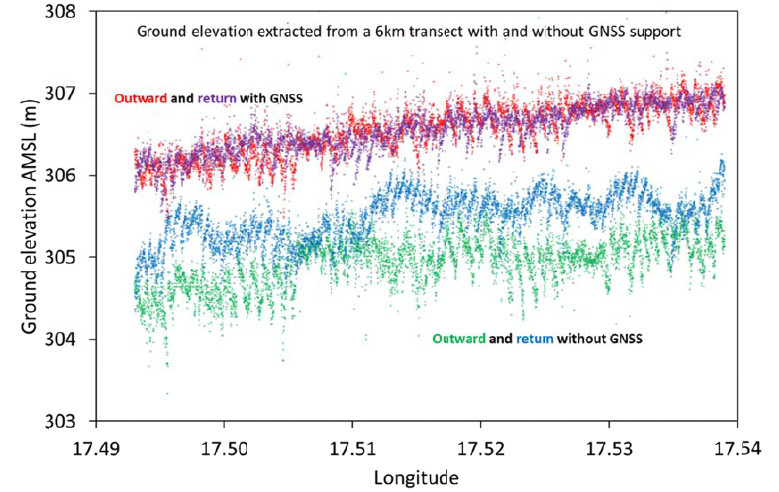
The data collected as part of the CongoPeat campaign has been published in the journal Remote Sensing 7. We collected two transects of UAV LiDAR data, one spanning 8 km and the other 6 km. Technical difficulties prevented us from conducting additional flights however, the data obtained did reveal a gentle rise in the surface elevation towards the centre of the peatland suggesting, albeit not proving, that the surface is domed and therefore rainfed. This is the first evidence of a domed peatland surface surveyed in this region and is important for our understanding of how the peatland complex might respond to changes in precipitation. This peatland has a span of 45 km eastwest and reaches a dome height of 1.8 m, as estimated from a parabolic fit to the LiDAR data, and a larger dome height of 3.0 m from simple extrapolation of the mean slope of both LiDAR transects from edge to centre of the peatland. The GNSS data was critical to the analysis, helping to refine the estimates of ground elevation that underpin the conclusions above (Figure 4).
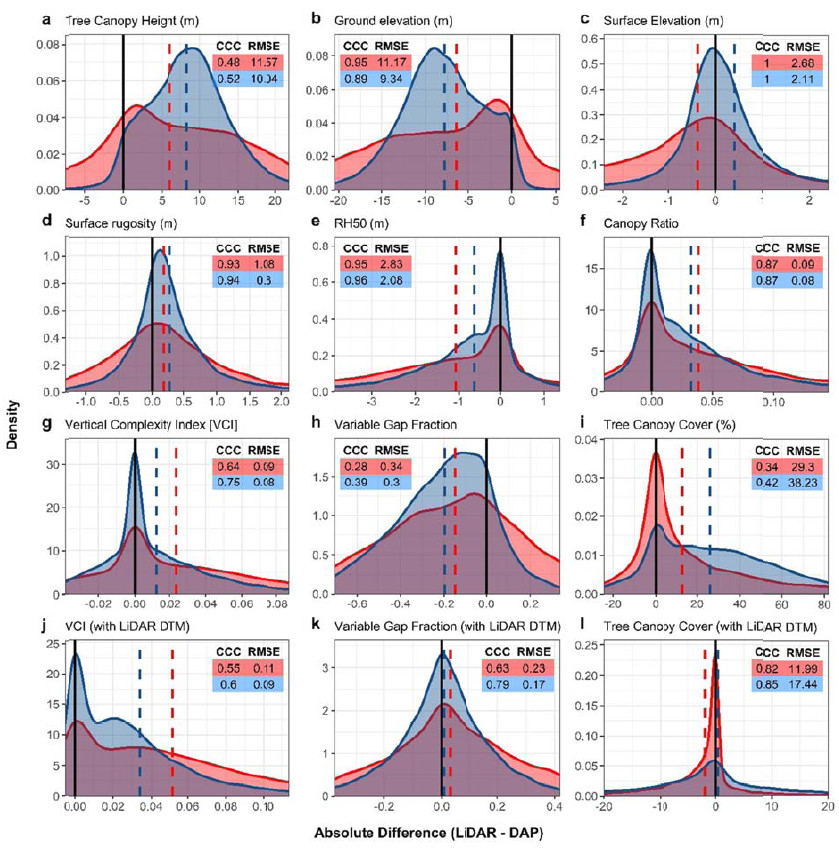
The data collected as part of the FODEX field campaign is currently being written up for submission to the open access journal Scientific Reports. The technical problems that arose during the CongoPeat campaign were resolved in time for the Peru campaign. However, achieving a permanent solution resulted in a delay to the Gabon data collection which was conducted under Loan 1124, although for consistency we include some of these results in this report. We find marked variations that SfM Tree canopy height, a key predictor of aboveground biomass, was underestimated by an average of 5 - 15 m when compared to the LiDAR data. This was almost exclusively due to differences in the estimated ground surface height (DTM), with errors rapidly increasing in areas with a tree canopy cover >80%, and a tree height > 20 m. The measured top-of-canopy surface heights (DSM) showed greater correspondence, particularly when derived at larger resolutions (i.e. > 0.5 ha) suggesting SfM can be used for relatively coarse scale change detection. Other structural metrics considered important for biomass estimation also showed marked variations between methods, with SfM typically underestimating both horizontal and vertical structural complexity. These inconsistencies are likely to have a large impact on the accuracy of biomass estimates derived using these metrics, and the ability of SfM to identify and monitor changes in both canopy and sub-canopy layers.
Data Archive
All of D-GNSS raw data are stored in the NERC GEF facility hard drives in Edinburgh. In addition, geo-referenced and registered UAV-LiDAR data in the .las format, and Digital Area Photographs are stored on the Mitchard Research Group Datastore, which is located on the University of Edinburgh servers and automatically backed-up. The raw data will also be deposited on the Edinburgh DataShare repository (https://datashare.is.ed.ac.uk) where it will be freely available for sharing. The data will also be stored at the NERC Centre for Environmental Data Analysis (CEDA) [https://www.ceda.ac.uk/].
Conclusions
The work conducted under Loan 1109 was deemed a success, paving the way for future field campaigns on the FODEX project. The GNSS data were critical to this achievement, allowing us to perform the necessary PPK corrections on the UAV flight trajectories, and collect valuable GCPs, which aided the construction of the 3D point clouds. The data collected has already led to one publication 7, with another likely to be submitted in October 2020. Future research efforts on the FODEX will focus on the collection of LiDAR and DAP post logging, with fieldwork provisionally scheduled for January (Gabon) and June (Peru) 2021.
Publications (including conference presentations)
-
Davenport, I.J, McNicol, I.M, Mitchard E.T.A and others… (2020) First Evidence of Peat Domes in the Congo Basin using LiDAR from a Fixed-Wing Drone. Remote Sensing. 12 (14), 2196
-
Davenport, I.J, McNicol, I.M, Mitchard E.T.A and others… (2020) Spaceborne LiDAR gives first evidence of peat domes in the Congo Basin. EGU General Assembly Conference Abstracts, 9909
-
McNicol, I.M., Mitchard, E.T.A. and others … (in prep) Comparisons of forest structural metrics derived from UAV LiDAR and Structure from Motion Photogrammetry in tropical forests.
References
-
Avitabile, V.; Herold, M.; Heuvelink, G.B.M.; Lewis, S.L.; Phillips, O.L.; Asner, G.P.; Armston, J.; Asthon, P.; Banin, L.F.; Bayol, N.; et al. An integrated pan-tropical biomass map using multiple reference datasets. Glob. Chang. Biol. 2016, 22, 1406 1420, doi:10.1111/gcb.13139. ↩
-
Saatchi, S.S.; Harris, N.L.; Brown, S.; Lefsky, M.; Mitchard, E.T. a; Salas, W.; Zutta, B.R.; Buermann, W.; Lewis, S.L.; Hagen, S.; et al. Benchmark map of forest carbon stocks in tropical regions across three continents. Proc. Natl. Acad. Sci. U. S. A. 2011, 108, 9899904, doi:10.1073/pnas.1019576108. ↩
-
Mitchard, E.T.; Saatchi, S.S.; Baccini, A.; Asner, G.P.; Goetz, S.J.; Harris, N.L.; Brown, S. Uncertainty in the spatial distribution of tropical forest biomass: a comparison of pan-tropical maps. Carbon Balance Manag. 2013, 8, 10, doi:10.1186/1750-0680-8-10. ↩
-
McNicol, I.M.; Ryan, C.M.; Mitchard, E.T.A. Carbon losses from deforestation and widespread degradation offset by extensive growth in African woodlands. Nat. Commun. 2018, 119, doi:10.1038/s41467-018-05386-z. ↩
-
Meyer, V.; Saatchi, S.S.; Chave, J.; Dalling, J.W.; Bohlman, S.; Fricker, G.A.; Robinson, C.; Neumann, M.; Hubbell, S. Detecting tropical forest biomass dynamics from repeated airborne lidar measurements. Biogeosciences 2013, 10, 54215438, doi:10.5194/bg-10-5421-2013. ↩
-
Dargie, G.C.; Lewis, S.L.; Lawson, I.T.; Mitchard, E.T.A.; Page, S.E.; Bocko, Y.E.; Ifo, S.A. Age, extent and carbon storage of the central Congo Basin peatland complex. Nature 2017, 542, 8690, doi:10.1038/nature21048. ↩
-
Davenport, I.J.; McNicol, I.; Mitchard, E.T.; Dargie, G.; Suspense, I.; Milongo, B.; Bocko, Y.E.; Hawthorne, D.; Lawson, I.; Baird, A.J.; et al. First evidence of peat domes in the congo basin using LiDAR from a fixed-wing drone. Remote Sens. 2020, 12, doi:10.3390/rs12142196. ↩ ↩2
Tables and Figures
