Scientific Report 1039
This report is also available as a PDF document .
Abstract
This report documents the acquisition and archiving of data collected using NERC GEF SEIS-UK 6TD seismometers during a major 3D active-source and passive seismic imaging experiment, NZ3D-FWI in 2017-2018. The NZ3D-FWI project aims to image the Hikurangi subduction zone (upper and lower plates and plate boundary fault) along the north Hikurangi margin, New Zealand where shallow slow slip events occur. The primary aim of the project is to collect data optimally to produce high-resolution active-source seismic velocity models using Full-waveform inversion (FWI). This deployment was part of a much larger experiment involving the collection of offshore 3D seismic reflection data and the deployment of 99 Ocean Bottom Seismographs. The onshore NZ3D-FWI deployment covered a 15 x 30 km area and included 49 CMG-6TD broadband seismometers from GEF deployed from December 2017 to October 2018, which detected airgun shots from the 3D seismic reflection survey and local and teleseismic earthquakes over the 9 month period. 119 short-period DATACUBE3 instruments loaned from GIPP Potsdam and 25 short-period GSX3 instruments from the Earthquake Research Institute (ERI), Tokyo were also deployed onshore between December 2017 and February 2018. The full NZ3D-FWI experiment is described in detail in the published report referenced below. This short report will focus only on the NERC GEF provided equipment.
Bell R, Gray M, Morgan J, Warner M, Fagereng A, McNeill L, Jacobs K, Henrys SA, Fry B, Watkins S, Lacey H, Black JA, Lane V, Daly D, Lindsay D, Bangs N, Arai R, Kodaira S, NZ3D-FWI team. 2019. New Zealand 3D full waveform inversion (NZ3DFWI) 2017-2018 field acquisition report. Lower Hutt (NZ): GNS Science. 79 p. (GNS Science report; 2019/71). doi:10.21420/ZZ8R-QR04
Background
Subduction margins produce some of the largest and most destructive earthquakes and tsunami on Earth. Recent earthquakes (e.g., 2011 T ohuku-oki, Japan and 2004 SumatraAndaman) have demonstrated our poor understanding of the complex behaviour of these fault zones and underestimation of their impact. The discovery of a completely new style of slip mechanism, episodic slow slip events (SSEs), in which slip occurs faster than the plate motion rate but too slowly to produce seismic waves, is one of the most exciting discoveries in the field of Earth Science of the last two decades (Schwartz and Rokosky, 2007). The physical mechanisms that lead to SSEs are poorly understood and the potential for SSEs to trigger destructive earthquakes and tsunami is enigmatic. Studies have proposed that SSEs could be responsible for triggering major destructive plate boundary earthquakes, including the 2011 To huku-oki event, highlighting the urgent need to better understand the phenomena (Ito et al., 2013; Ruiz et al., 2014). Many well-studied SSEs (Cascadia and southwest Japan) occur at depths exceeding 20 km; too deep for direct sampling and high-resolution seismic imaging. A notable exception to this lack of access is the north Hikurangi margin, New Zealand, where well-characterised SSEs occur every 1-2 years, over periods of 2-3 weeks at <2-15 km below the seafloor (Fig. 2)(Wallace et al., 2004, 2012, 2016).
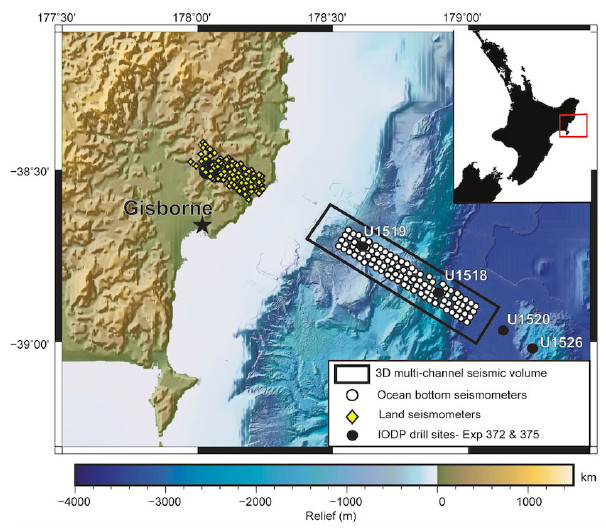
The 2017-2018 NZ3D project involved the collection of 3D seismic data across the north Hikurangi margin in the vicinity of the town of Gisborne to better understand slow slip and subduction margin tectonics by imaging and producing physical property models in the zone of slow slip. The experiment consisted of a 3D multi-channel streamer (MCS) seismic reflection volume (http://www.marine-geo.org/ and Bangs et al. (2018)), a 3D ocean bottom seismometer (OBS) array of 99 instruments (Kellett et al., 2019) and 193 land instruments (Bell et al., 2019)(Fig. 1). The NZ3D experiment also coincided with drilling in two International Ocean Discovery Program (IODP) Expeditions 372 and 375 which were also investigating the properties of the subduction zone in relation to slow slip events (Wallace et al., 2019).
In this report we focus on just one part of the NZ3D experiment, NZ3D-FWI, and describe in detail only the use of GEF SEIS-UK equipment. This experiment involved the deployment of 193 land- instruments (of which 49 belong to SEIS-UK) with the ultimate goal of integrating these data with offshore 3D MCS and OBS data to produce onshore-offshore high-resolution physical property models using a technique called Full-waveform inversion (Bell et al., 2019; Gray et al., 2019).
Survey procedure
NERC grant NE/M021203/1 funded the loan and deployment of CMG-6TD seismometers (loan number 1039) and the deployment of 119 DATA-CUBE3 (loaned from GIPP- grant number 201724) and 25 GSX3 instruments (loaned from ERI, Tokyo). Costs of field work were also supported by GNS Science and Imperial College London. The deployment involved personnel from Imperial College London, GNS Science, Cardiff University, University of Southampton, University of Leicester and University of Victoria, Wellington. Appendix A in Bell et al. (2019) shows the full list of the 35 personnel involved in the complete NZ3D-FWI field experiment.
Deployment time-line
NZ3D-FWI involved the deployment of stations in two different arrays with different objectives. The deployments include a broad array named the \Gisborne array” aimed at imaging the Hikurangi subduction zone and collecting data suitable for 3D FWI. A dense array named the \Waimata Valley array” is aimed at imaging the Waimata Valley mud-volcano system,including the location of a major mud eruption which occurred 2.5 months after the experiment in Dec 2018. The Waimata Valley array was constructed primarily with GIPP DATA-CUBE3 instruments and will not be described in detail here (for full details see Bell et al. (2019)).
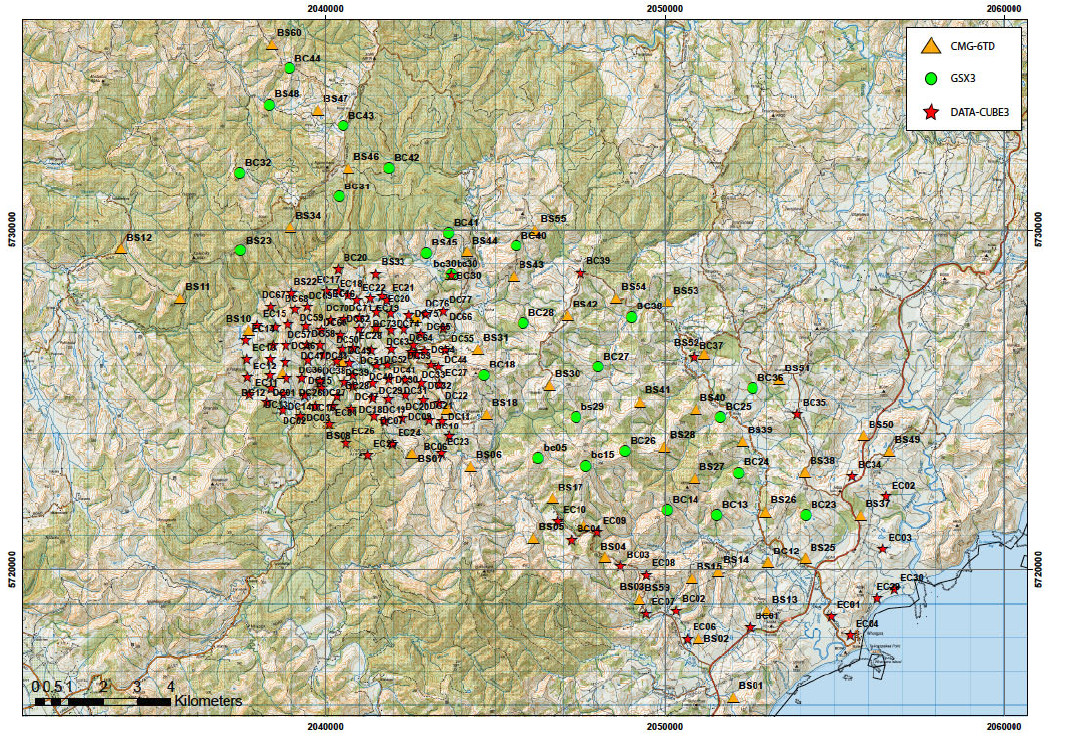
50 Guralp CMG-6TD broadband seismometers from the GEF were shipped to New Zealand for deployment, and 49 of these instruments were in working order and could be deployed. They were deployed in a roughly regular array over a 15 km x 30 km area (Fig. 2). CMG6TD sites were positioned approximately every 2 km to mirror the spacing of OBS offshore (Fig. 1), however, site locations were controlled by vehicle access. In some parts of the study area vehicle access precluded the deployment of broadband instruments, and in these areas 25 short-period GSX3 recorders and 3-component 4.5 Hz geophones that were lighter and easier to carry long distances on foot were used to fill gaps in the array (Fig. 2). In addition, 16 DATA-CUBE3 recorders and 3-component 4.5 Hz geophones were added to the Gisborne array to provide a closer instrument spacing along Glenroy Rd and in coastal areas (Fig. 2).
After the airgun shooting in February 2018, data was downloaded from all of these instruments. The GSX3 and DATA-CUBE3 instrument sites were decommissioned in February 2018. The CMG-6TD sites were serviced and their sample rate changed from 200 samples per second to 100 sps for passive seismic recording. These stations were serviced again and data downloaded in July 2019 and the sites were finally decommissioned in October 2018.
Site design
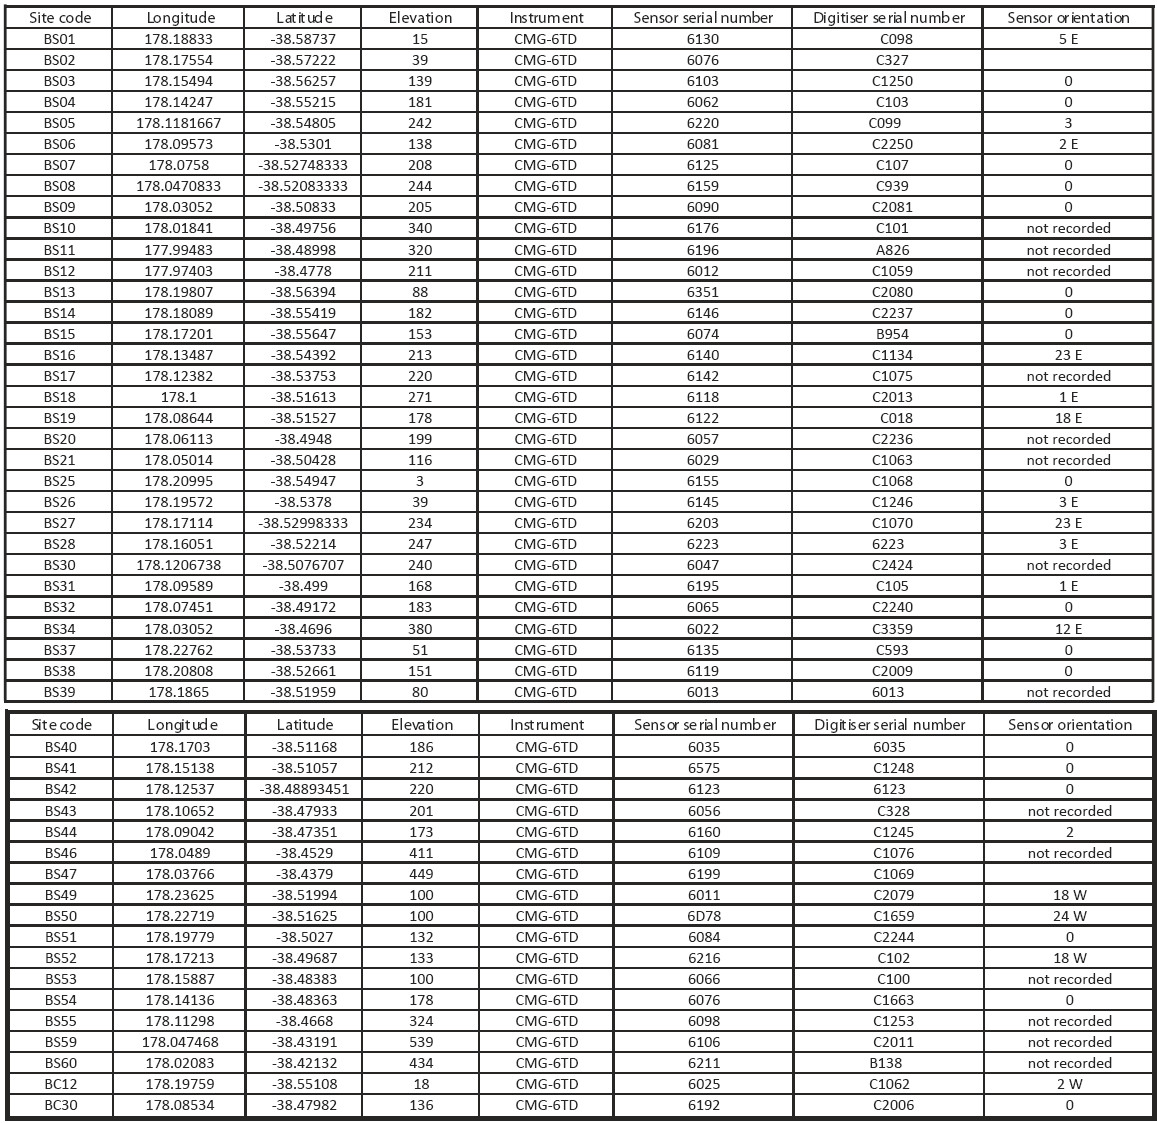
The CMG-6TD sites were all located within soil. Due to the short nature of the deployment we opted for a direct-burial site design. An around 60 cm deep hole was dug and sand poured in to provide a stable base for the instrument. The CMG-6TD was put in a waterproof bag and levelled using the bubble c) level on top of the instrument. All d) instruments were aligned with true North (see Fig. 8 for site informa- tion and orientation errors). The instrument was carefully buried us- ing a mixture of soil from the hole and sand, checking that the masses were below acceptable levels (fol- lowing the SEIS-UK protocol). A few of the instruments had stuck masses that could not be fixed during the experiment (Appendix A). The waterproof bag was taped up and the cables run along a dug-out channel to a plastic battery box. The instruments were powered by a 12 V car battery supported by a single 20 W solar panel. The battery and regulator were stored in a water proof box (Fig. 3). For sites in forests two car batteries were used as well as or instead of a solar panel and during servicing other sites were issued with a secondary battery due to insufficient solar power. GPS were positioned above the solar panel. A tarpaulin was laid in front of the solar panel, using garden staples, to limit vegetation growth (Fig. 3). Data was recovered from the instruments in the field using an external hard drive while the instrument was still buried.
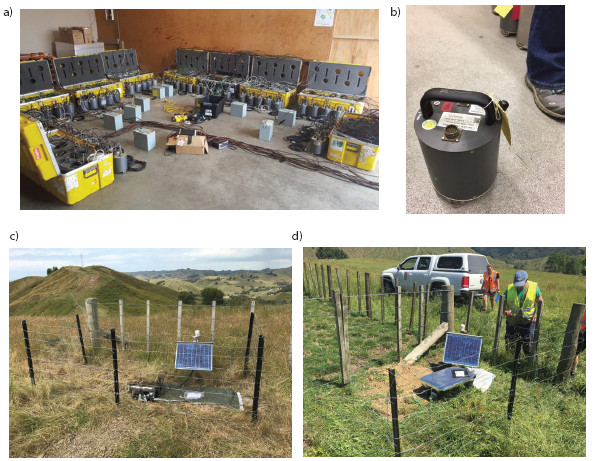
Almost all of the instrument sites were in areas of active farming, including cattle, sheep and pigs. Fences made from metal fence posts and tensioned wire were erected to protect the sites (Fig. 3). Site installation took a team of 3 people around 2-3 hours. All CMG-6TD sites could be accessed to within 100 m with a vehicle.
It was noted during servicing in February that some solar panels had fallen over due to the wooden stakes that we used being too short. Luckily, the site design involved plastic battery boxes being in front of solar panels, so in most cases the solar panel fell on to the box and continued powering the instrument. The instruments were serviced again in July 2018 after a period of severe storms and some bad-weather damage had occurred, including plastic boxes filling with water and animals had destroyed one site, BS47. This site was dismantled during the July servicing. The sites were all collected in October 2018, when it was discovered that one solar panel had been stolen (site BS46) and a police report was filed.
Processing and modelling
Active source data is initially processed into receiver gathers, i.e. offshore shots that are along a profile line are gathered for an individual station. The data is compiled, reduced and cut into receiver gathers utilising GIPP utility codes (www.gfz-potsdam.de). Navigation data and shot times specifying the geometry and timing of the NZ3D survey are available from the Marine Seismic Data Centre for project MGL1801. The data is then processed and interpreted using SeisUnix.
The passive data is left as continuous day files for each station. Preliminary data processing has involved analysing data for all stations, day by day, using Seismic Handler software. Local, regional and teleseismic earthquakes have been identified and P- and S-wave arrivals picked so far for data from Dec 2017 - early Feb 2018.
Data quality and interpretation
Noise levels
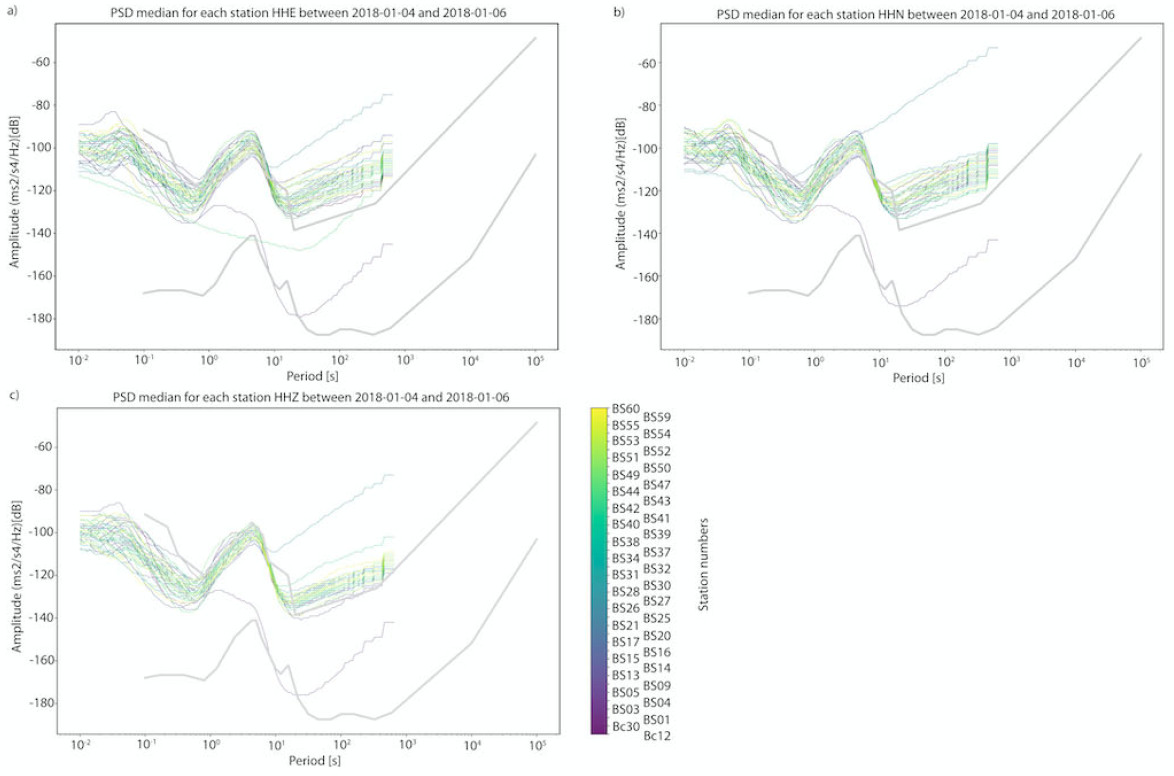
The primary objective of this experiment was to collect data for active-source tomography. The data quality at shorter periods (<1 s) is excellent, with all instruments showing noise levels below the Peterson (1993) limits (Fig. 4). Data quality from 1-10s, particularly for the Z component is good (Fig. 4). For periods longer than 10 s, however, the data are noisy, which we attribute to the close proximity of all of the stations to the ocean. This will make conducting analyses such as receiver functions more challenging.
Example earthquake data
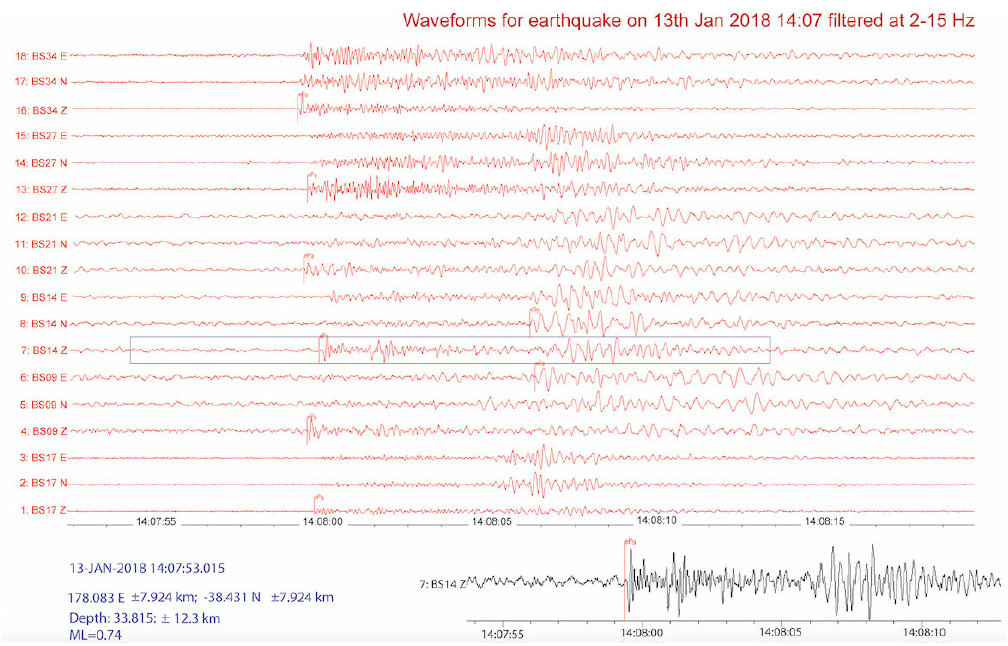
We have begun analysing the three component broadband dataset for local and regional seismicity. Pg and Sg phase times have been picked with Seismic Handler (Fig. 5). Hypocentres are determined using LocSAT (Bratt and Nagy 1991) assuming the iasp91 1D crustal velocity model. We have also determined preliminary local earthquake magnitudes (Fig. 5). The data quality is high for picking of local seismicity, however, the sheer volume of data means automated picking tools will need to be applied in the future to process all data fully.
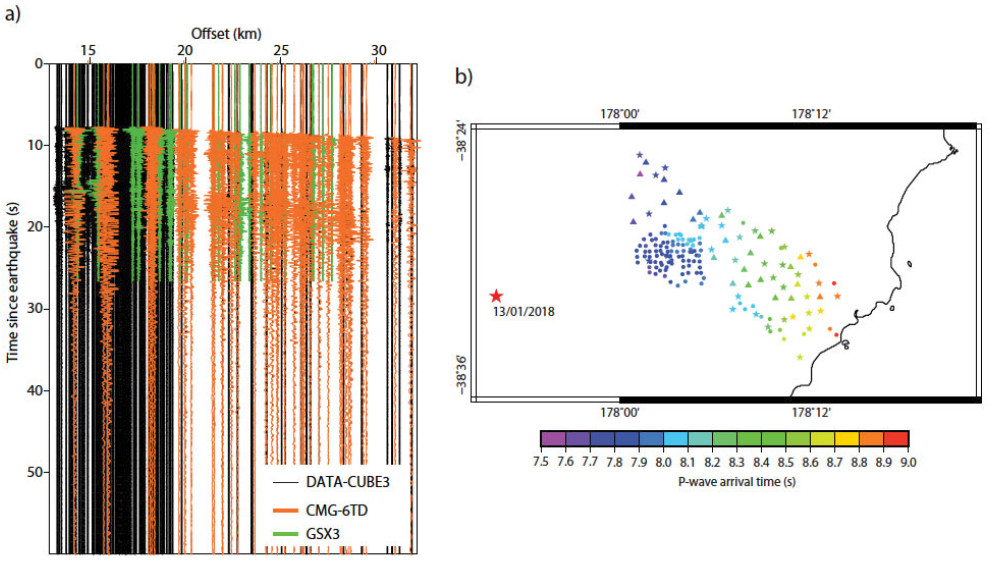
On 13th January 2018 at 18:07:33 UTC a magnitude 3.5 earthquake occurred 15 km west of the array at a depth of 28.4 km. This event was felt by the citizens of Gisborne. Figure 6 shows the data for all instrument types plotted together versus offset. P-wave arrival times can be picked for all instruments that recorded the event and given the close station spacing can be plotted in map view in a nodal fashion to investigate potential travel-time anomalies (Fig. 6).
Example active source data
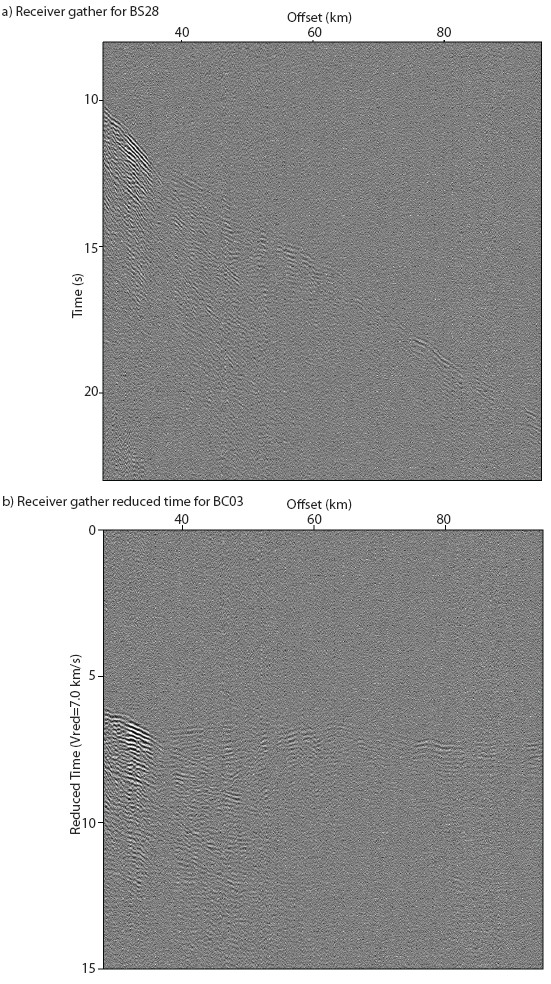
Figure 7 shows an example receiver gather for one of the CMG-6TD sites (BS28) for R/V Langseth shot lines 1236 and 1244. These instruments have recorded coherent signal to offsets of 90-110 km, meeting the original objectives of the proposal.
Ongoing work
Processing of the vast NZ3D-FWI dataset requires the development of a new research team of PDRAs and PhD students. In July 2019 Bell and Morgan were awarded a Leverhulme Research Grant to develop the SMILE (Subduction margin imaging in large experiments) research group and employ a PDRA and PhD student who will focus on the active-source data processing. Their work will begin by making FWI velocity models of the offshore data, and will integrate the onshore data later. Bell and Bastow have worked with undergraduate students to begin processing the local earthquake data and are currently seeking a PhD student. We are collaborating with other national and international groups to make the most of this fantastic dataset. Ongoing collaborations include the following and we continue to seek new international collaboration opportunities:
Katie Jacobs, Bill Fry et al. GNS Science. Ambient noise and beam forming analysis. Luca de Siena, Johannes Gutenberg Universit at Mainz. Attenuation studies. Harold Leah et al. Cardiff University, Receiver function analysis.
Conclusions and recommendations
The NZ3D-FWI experiment was extremely ambitious and has produced a vast nodal dataset in a region where slow slip events and mud volcanoes occur. By chance, we have captured data that characterise the sub-surface in the months before a major mud volcano eruption (which occurred in Dec 2018). Our simple site design appropriate for a short deployment worked well and allowed us to deploy all of the instruments in time for the beginning of active source shooting and has resulted in good quality data. This experiment would not have been possible without the expertise of Dr. Victoria Lane and Debra Daly and the GEF team. Given the vast volumes of data we are only in the beginning stages of processing, however, personnel and collaborators are now in place thanks to additional funding from the Leverhulme Trust awarded as a direct result of this equipment loan.
Publications, outreach and data archiving (including conference presentations)
All NZ3D-FWI land-based data is stored at Imperial College London (on external hard-drives and servers) and GNS Science. The CMG-6TD data is stored in addition at SEIS-UK, University of Leicester and stored on IRIS DMC (Data Management Center) in miniseed format (network code 3C (2017-2018)).
Bell et al. (2017). NZ3D (data set). International Federation of Digital Seismograph Networks. https://doi.org/10.7914/SN/3C 2017
Bell et al. 2019. New Zealand 3D full waveform inversion (NZ3D-FWI) 2017-2018 field acquisition report. Lower Hutt (NZ): GNS Science. 79 p. (GNS Science report; 2019/71). doi:10.21420/ZZ8R-QR04.
Bell et al. 2019, AGU Fall meeting. T51H-0405Local earthquake analysis in a region of slow slip and mud volcanism: The onshore NZ3D Hikurangi margin experiment
Bell et al. 2018, AGU Fall meeting. T51I-0297: Validating a full-waveform inversion velocity model at the north Hikurangi subduction margin using IODP drilling data
Futurum teaching material for secondary school pupils- The slow and silent earthquakes that are shaking up seismology. https://futurumcareers.com/the-slow-and-silent-earthquakes-thatare-shaking-up-seismology
Appendix A Specific problem sites
BS02 was unresponsive during the February service and no data could be collected. The instrument was left installed but was still unresponsive during the July service. It was decommissioned during the July service and no data was recorded from this site for the whole experiment.
BS43: During the July service the instrument was unresponsive and no communication could be made during October either (despite the instrument being in working order from Dec 2017-Feb 2018). SEIS-UK managed to extract some data from this instrument when it arrived back in the UK.
BS26: During the October pick-up there was a problem with the download of data from this instrument (despite the instrument being in working order from Dec 2017-July 2018). SEIS-UK managed to extract some data from this instrument when it arrived back in the UK.
BS46: The GPS at BS46 could not get lock when deployed in Jan 2018 and we did not have any spare working GPS units. The GPS unit was replaced in Feb 2018 and GPS lock achieved. The site recorded useable data from Feb-July 2018 and unusable data from Dec 2017-Feb 2018. During the October service it was discovered that the solar panel and battery had been stolen from this site. The site stopped recording on August 27th 2018.
BS47:Pigs destroyed the site sometime between Feb and July 2018. The site was decommissioned in July 2018 and no data recovered between Feb - July 2018.
BS04: Stuck East mass (Dec), BS44:Stuck North mass (Dec)
BS16: No data available to download between Feb and July 2018. It looks like “Duplicate” was not ticked after servicing in Feb. Duplicate was turned on in July and data was once again recorded.
References
S. Y. Schwartz and J. M. Rokosky, “Slow slip events and seismic tremor at circum-pacific subduction zones,” Reviews of Geophysics, vol. 45, no. 3, 2019/05/02 2007. [Online]. Available: https://doi.org/10.1029/2006RG000208
Y. Ito, R. Hino, M. Kido, H. Fujimoto, Y. Osada, D. Inazu, Y. Ohta, T. Iinuma, M. Ohzono, S. Miura, M. Mishina, K. Suzuki, T. Tsuji, andJ. Ashi, “Episodic slow slip events in the japan subduction zone before the 2011 tohoku-oki earthquake,” Tectonophysics, vol. 600, pp. 14 26, 2013. [Online]. Available: http://www.sciencedirect.com/science/article/pii/S0040195112004994
S. Ruiz, M. Metois, A. Fuenzalida, J. Ruiz, F. Leyton, R. Grandin, C. Vigny, R. Madariaga, and J. Campos, “Intense foreshocks and a slow slip event preceded the 2014 iquique m 8.1 earthquake,” Science, vol. 345, no. 6201, p. 1165, 09 2014. [Online]. Available: http://science.sciencemag.org/content/345/6201/1165.abstract
L. M. Wallace, J. Beavan, R. McCaffrey, and D. Darby, “Subduction zone coupling and tectonic block rotations in the north island, new zealand,” Journal of Geophysical Research: Solid Earth, vol. 109, no. B12, 2019/05/02 2004. [Online]. Available: https://doi.org/10.1029/2004JB003241
L. M. Wallace, P. Barnes, J. Beavan, R. Van Dissen, N. Litchfield, J. Mountjoy, R. Langridge, G. Lamarche, and N. Pondard, “The kinematics of a transition from subduction to strike-slip: An example from the central new zealand plate boundary,” Journal of Geophysical Research: Solid Earth, vol. 117, no. B2, 2019/05/02 2012. [Online]. Available: https://doi.org/10.1029/2011JB008640
L. M. Wallace, S. C. Webb, Y. Ito, K. Mochizuki, R. Hino, S. Henrys, S. Y. Schwartz, and A. F. Sheehan, “Slow slip near the trench at the hikurangi subduction zone, new zealand,” Science, vol. 352, no. 6286, p. 701, 05 2016. [Online]. Available: http://science.sciencemag.org/content/352/6286/701.abstract
N. Bangs, R. Arai, S. Ball, D. Barker, J. Edwards, M. Gray, S. Han, H. Leah, T. Reston, H. Tilley, and H. Tobin, “The nz3d experiment adding a new dimension for understanding slow slip events,” GeoPRISMS Newsletter, vol. 40, 2018.
R. Kellett, D. Bassett, R. Arai, K. Obana, V. Stucker, S. Henrys, S. Davidson, R. Hart, S. Kodaira, T. Maekawa, K. Michailos, S. Mori, G. O’Brien, T. Saijo, I. Terada, N. Bangs, and R. Bell, “Tan1712-1803 voyage report for ocean bottom seismograph recovery in support of seismic surveys (orcss 2 and 3): 3d survey offshore east coast north island,” GNS Science Report 2018/36, 2019.
R. Bell, M. Gray, J. Morgan, M. Warner, A. Fagereng, L. McNeill, K. Jacobs, S. Henrys, B. Fry, S. Watkins, H. Lacey, J. Black, V. Lane, D. Daly, D. Lindsay, N. Bangs, R. Arai, S. Kodaira, , and N.-F. team, “New zealand 3d full waveform inversion (nz3d-fwi) 20172018 field acquisition report. lower hutt (nz),” GNS Science report; 2019/71, 2019.
L. Wallace, D. Saffer, P. Barnes, I. Pecher, K. Petronotis, L. LeVay, and the Expedition 372/375 Scientists, “Volume 372b/375 hikurangi subduction margin coring, logging, and observatories,” Proceedings of the International Ocean Discovery Program, 2019.
M. Gray, R. Bell, J. V. Morgan, S. Henrys, D. Barker, and the Expedition 372/375 Scientists, “Imaging the shallow subsurface structure of the north hikurangi subduction zone, new zealand, using full-waveform inversion,” Journal of Geophysical Research: Solid Earth, 2019.
