Scientific Report 995
This report is also available as a PDF document .
Abstract
Object of investigation were the annual glacial lake outburst floods (GLOFs) at the Southeast outlet glacier of the A. P. Olsen Ice Cap, Northeast Greenland. Therefore, a geodetic and geophysical approach was chosen to monitor the glacier’s response during a fill- and drain cycle of the glacier-dammed lake. The monitoring network was installed in Spring 2012 and was operated for two years (GEF Loan 957 and 995). A ground-penetrating radar (GPR) was used to retrieve a snapshot of en- and subglacial characteristics. The all-year round monitoring strategy was based on a network of parallel GPS and passive seismic sensors. First analysis of the gathered data show distinct high active events before the GLOF itself, and a stepwise increase of seismicity right after the outburst.
Introduction
Processes of en- and subglacial hydrology are assumed to play a key role in many unsolved topics in the fields of glaciology. The routing of liquid water through ice masses and its dynamic consequences is still a highly active area of research. Nye (1976) formulated the theoretical basis for the classic GLOF theory where the outburst water intraglacially passes the glacier through a single conduit of varying cross-section. The conduit cross-section is determined by two competing processes. On the one hand the meltback of conduit walls due to water flow, and on the other, the conduit closure by creep due to the hydrostatic stress of the overlying ice. The classic GLOF theory (Nye, 1976; Spring and Hutter, 1981; Clarke, 1982) reproduces the exponential increase of the proglacial discharge over days and weeks typically registered for slowly-rising GLOFs. Rapid-rising GLOFs exhibit a linear growth of the proglacial discharge over hours and days and are controlled by fundamentally different processes like lifting, deforming and fracturing of the ice mass (e.g. Bjornsson, 2010).
Fieldwork objectives
The main objectives of the GlacioBurst fieldwork were:
- Installation of a GPS and passive seismic network.
- Low-frequency GPR survey.
- Compilation of an all-year round geodetic and geophysical data set.
Study Site
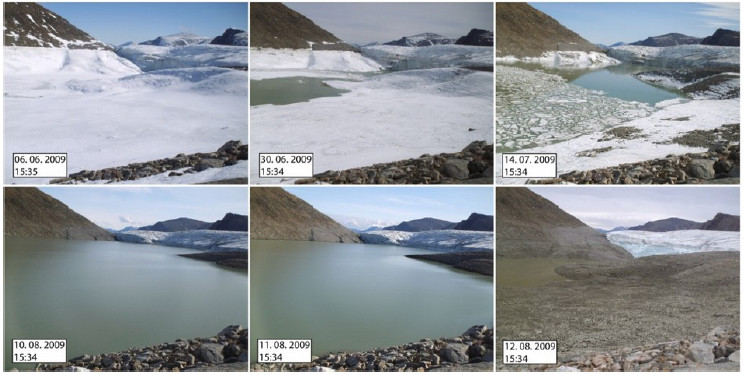
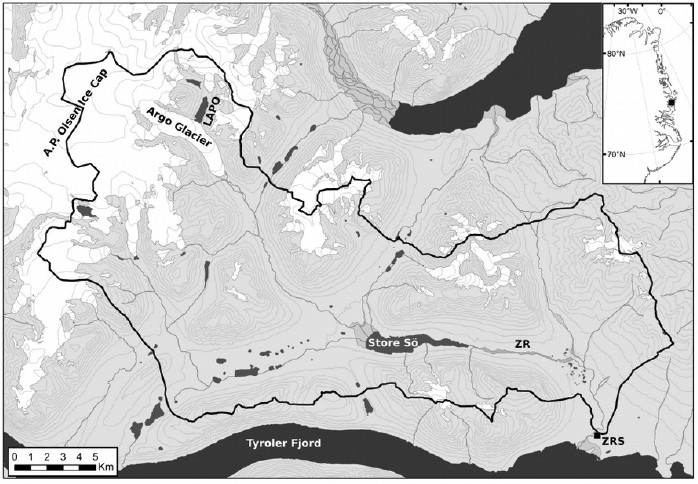
The Southeast pointing outlet glacier (SEOG, Fig.2) of the potentially cold-based A.P. Olsen Ice Cap (74° 38’N, 21° 26’W) cuts off a side valley where meltwater is gathered during the ablation period and forms a glacier-dammed lake (LAPO, Fig.2), which has been showing more or less annual outbursts since at least 1997 (Fig.1). The LAPO flood wave drains into the Zackenberg River (ZR) and directly passes the Zackenberg Research Station (ZRS, Fig.2; 74° 28’N, 20° 34’W), where discharge is measured (Fig.3). The GLOF duration (~0.5-1d) as well as the shape of the discharge curves (Fig.3) suggests that the LAPO GLOFs are predominantly rapid-rising. This fact and the well-solved logistics through the ZRS recommended the site for a process-orientated GLOF study which was realized in April 2012 and was operated for two years.

Installation of the monitoring network
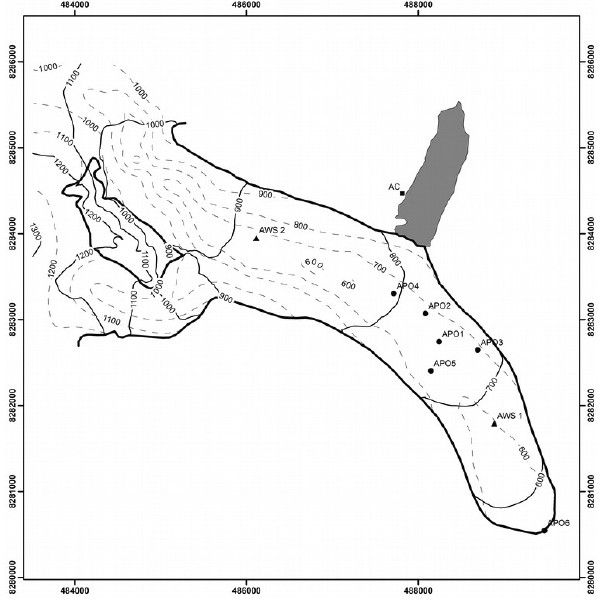
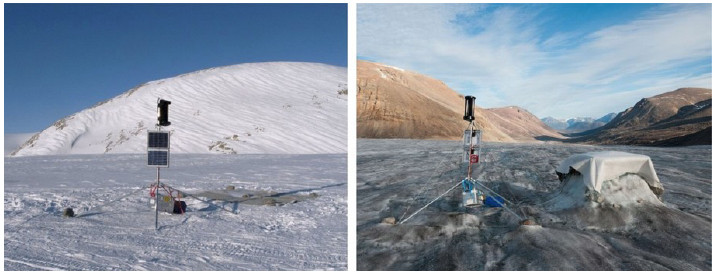
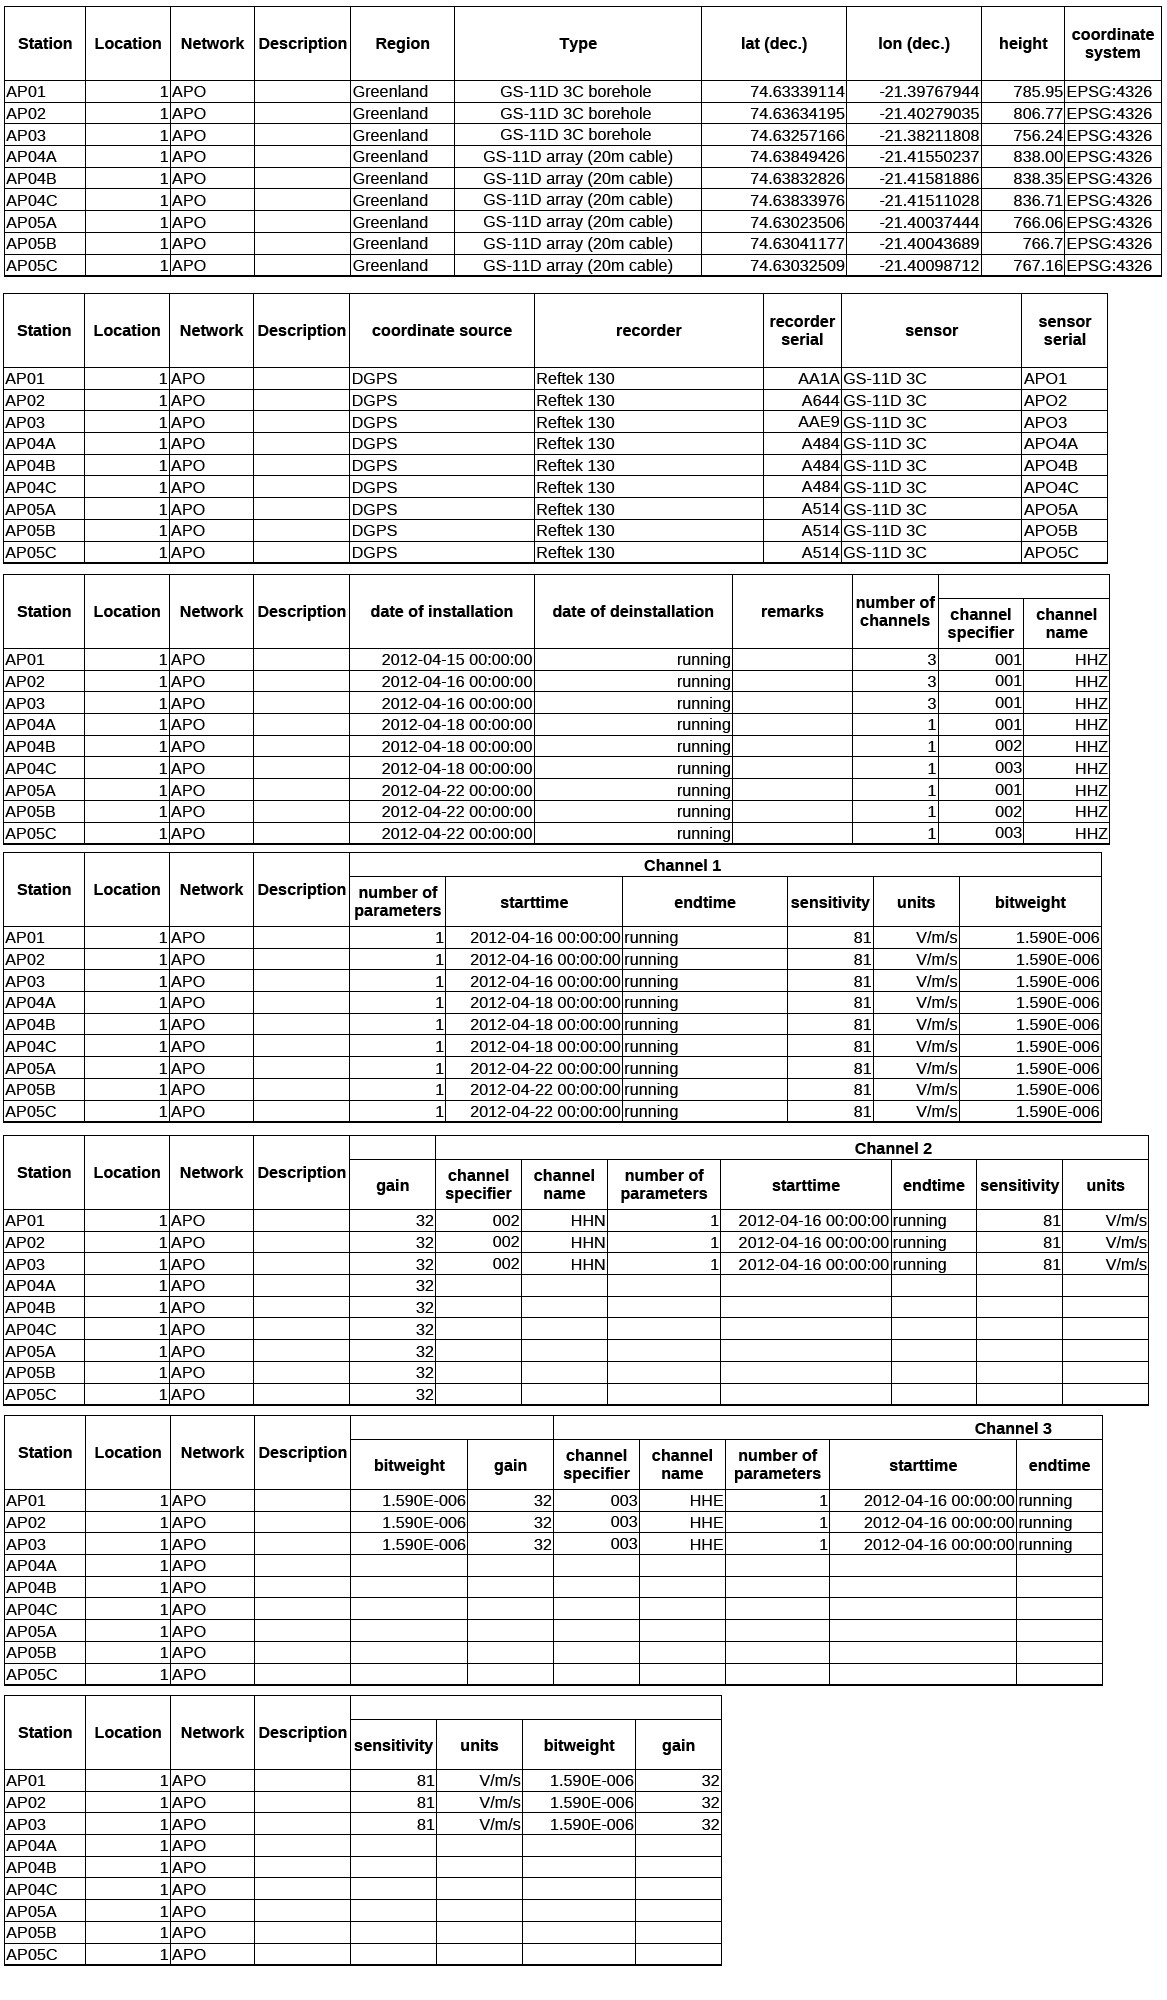
The geophysical monitoring was in the form of a continuous recording passive seismic network and a low-frequency (40MHz) ground-penetrating radar (GPR) survey. The passive seismic network consisted of five stations on ice, whereas two stations were designed as tripartite arrays (APO4,5; Fig.4) and the remaining three were equipped with three-component sensors. All sensors had an eigenfrequency of 4.5Hz and the recorded signal was sampled with 500Hz. Figure 5 shows the installation of a seismic sensor. Due to the fact that the glacier stations were situated in the ablation zone, sensors were sunk ~3m into the ice and covered with a geotextile to reduce ablation rates. Figure 6 shows a station right after installation in April 2012 and a station in August 2012. The geodetic monitoring was in the form of a continuous recording GPS network with a sampling rate of 10s. Single-frequency GPS stations were co-located to the passive seismic stations and another single-frequency station was installed in the glacier forefield to serve as the base station (APO6; Fig.4). In April 2012 the icedammed LAPO was in empty state.

First Results 2012
The discrete seismic events were detected by a STA/LTA detection algorithm (e.g. Allen, 1982). The length of the short-term average (STA) window was 1.5 s and the length of the long-term average (LTA) window was 8 s. A robust STA/LTA-ratio of 3.5 was chosen as the detection threshold. Figure 7a illustrates the overview of the detected seismic events of the APO1 data set. Besides the cumulative sum of the detected single events (red line), it shows the maximum amplitude averaged over all stations (APO1-5) for the detected events (black crosses). The reason for introducing the detected events of only a single station were the apparent difficulties in binding the detections on multiple stations to common events automatically. This problem was due to multiple events occurring within a short time-span. However, due to the generally low background noise, most of the seismic events were recorded on all stations of the network. Therefore, the chosen approach did not distort the overall results. In total 459770 events were detected for the time period of 01.05. - 01.12. 2012. For this paper, only events longer than 1 s were used to eliminate potential false detections. This reduction still resulted in about 390000 seismic events within seven months, which corresponds to more than one event per minute for the whole survey period. After all, based on the applied strategy, the presented detection results should be understood as a lower boundary, especially during the highly active periods.
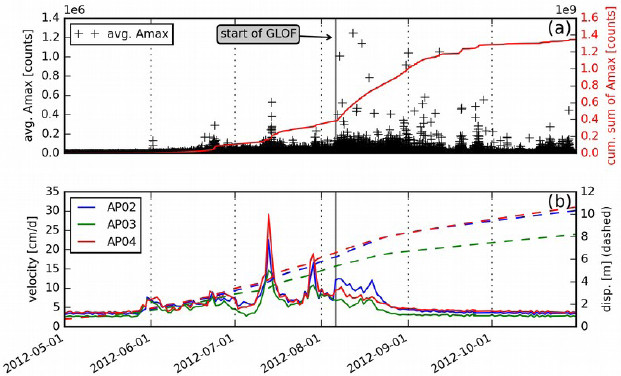

Generally, a good correlation between surface dynamics and seismicity could be observed for the pre-GLOF phase (fig. 7). Three distinct events of enhanced surface dynamics and seismicity could be observed and were denominated as pre-GLOF events 1-3 (PGEs1-3). The first occurrence of melt water at the beginning of June (PGE1) was accompanied by an abrupt rise in seismicity (Fig.7,8). Furthermore, three distinct events of increased seismicity around June 24, July 14 and July 29 could be delineated. Principally, all periods of enhanced seismicity can be associated with distinct melt events, whereas the seismicity increase around June 24 didn’t show a dynamical glacier response comparable to PGE2,3. PGE2 exhibited the highest recorded average amplitudes during the pre-GLOF phase.
The most striking feature of the seismic results was the significant rise in the number of events as well as the appearance of the highest average signal amplitudes after the outburst flood. This seismically active post-GLOF phase lasted for about 1.5 months. No single seismic event could be detected during the outburst flood itself (fig. 9a), because the seismic records were dominated by the continuous, high-amplitude rumbling, caused by the flood water itself.
Discussion 2012 data set
Generally, observed enhanced dynamics and seismicity could be associated with positive summer temperatures during the 2012 melt season. PGE1-3 were observed during peaks in air temperature, ice melt and subsequent ZR discharge and suggest that higher water supply rates were a potential PGE trigger. Due to the fact, that no complementary LAPO water balance data existed, it was not possible to distinguish if LAPO water was involved during the observed PGEs, respectively if the LAPO water already infiltrated the SEOG weeks before the GLOF itself to potentially amplify the glaciers response, because of a higher volume of pressurized water in the glacial drainage system.
PGE1 was observed within the first extensive phase of positive temperatures, which resulted in a doubling of flow velocities and a rise in seismicity. Based on the AC, it is known that the ice-dammed side valley was still snow covered during PGE1. First signs of melt water in the side valley could be traced in the AC photos for June 4. Hence, we interpreted PGE1 as a classic spring speed-up event due to a rather distributed, non-evolved, drainage system in the early melting season, not able to discharge the apparent melt water (e.g. Iken and others, 1983; Anderson and others, 2004). At the beginning of July the LAPO reached about half of the maximum water level in 2012. On July 14, three weeks before the GLOF, PGE2 took place exhibiting maximum observed flow velocities, a stepwise increase of detected seismic events with maximum seismic amplitudes for the whole pre-GLOF period (Fig. 7). The observed maximum PGE2 flow velocity at the APO4 station was about the 7-fold of the observed maximum flow velocity during the PGE1 event. PGE3 then took place about a week before the GLOF-onset.
However, due to the striking difference in the magnitudes between PGE1 and the remaining PGEs, and the fact that during PGE1 the lake was empty, but during PGE2 and 3 it already was close to its maximum level, we hypothesize that lake water already infiltrated the glacial drainage system weeks before the outburst event itself and amplified the glaciers response to the observed melt event.
The post-GLOF phase was characterized by a stepwise increase of seismicity. This is interpreted as the collapse of the GLOF drainage system. Following Flowers and others (2004), it is assumed that the evolution of a low pressure, conduit-based drainage system through melt back was caused by the high GLOF-discharges. With absence of pressurized water as the counter force, the evolved conduit(s) regressed through creep and brittle deformation. Walter and others (2008) showed that basal seismic events could be correlated to low or decreasing basal water pressures during the 2004 Gornersee GLOF. Based on moment tensor analysis, these events were interpreted as the collapse of cavity roofs (Walter and others, 2010).
2013 Data
In the summer of 2013 the GLOF happened in between July 10 and 11. It was a small flood after the massive flood of 2012. Due to failure of the applied GPS data loggers, we were not able to monitor the corresponding surface dynamics in 2013. The failure of the low-cost GPS data logger was most likely due to the harsh conditions, however the exact reason is not known. Furthermore, seismic stations, respectively the Reftek 130 devices of APO3 and 5 failed. The ‘two line’LCD display of the two devices showed one total black and one empty line. The attempt to start the devices e.g. with the external palm top device was not successful. The APO1 Reftek 130 device was switched with the inoperable APO5 device.
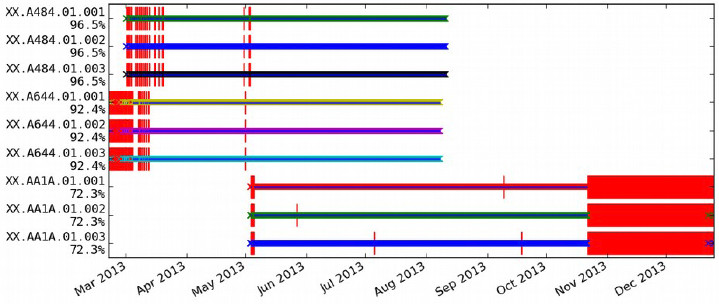
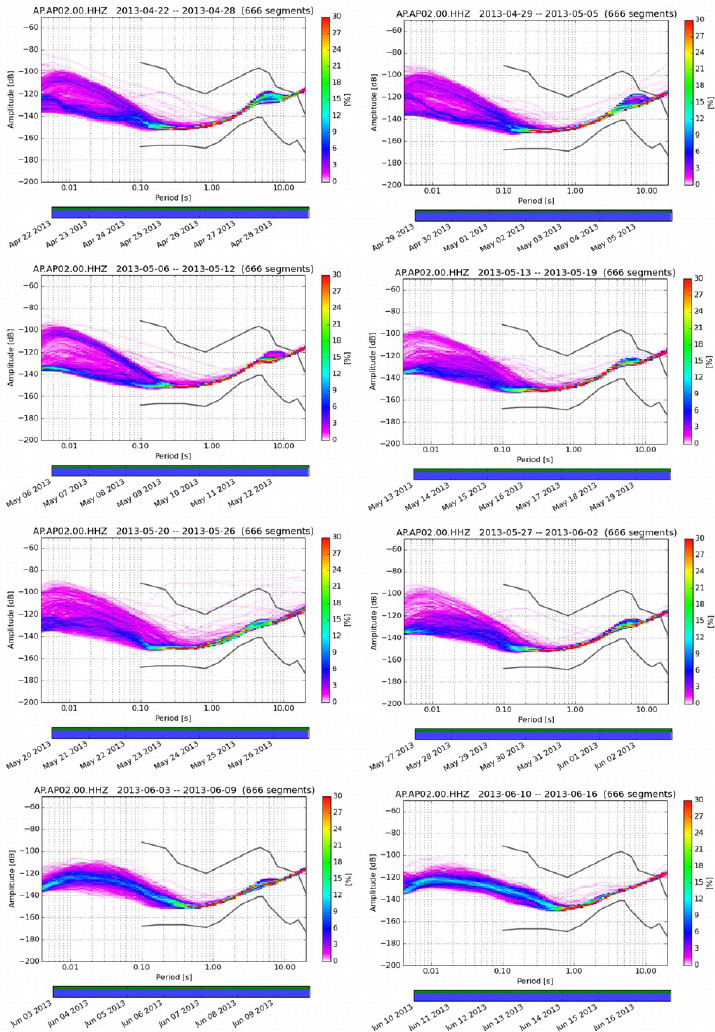
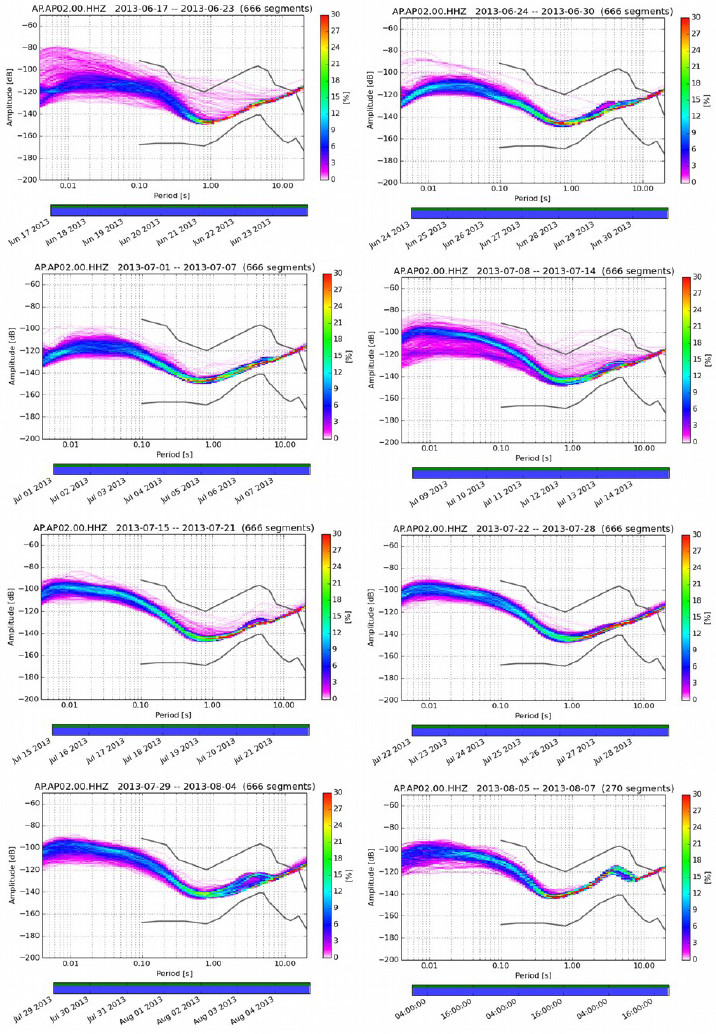
Figure 11 shows the weekly Probabilistic Power Spectral Densities (PPSDs) for the representative station APO2 (Fig. 4). Generally, all seismic data of the entire project showed a low noise level. The potential reason for the low noise level is the very remote setting in Northeast Greenland and the fact that the predominantly cold-based A.P Olsen Ice Cap exhibits rather low flow velocities (~10-20 meters/year). PPSDs were calculated with the ObsPy program package, using the approach of McNamara (2004). A window length of 30 min with an overlapping of 50% was applied. The amplitude is given in [dB] relative to 1 (m/s^2)^2 / Hz. The grey lines show the new low noise model (NLNM), respectively the new high noise model (NHNM) after Peterson (2003). Instrument response was removed before the PPSD calculation. The PPSD plots indicate, that the restitution of the true ground motion is valid down to a period of ~5 seconds. Below this period electronic noise is most likely to dominate the recorded data. Although for strong signals, the frequency content with periods larger than 5 seconds could still allow a reasonable data analysis. Generally, one can interpret signals with periods <5s as real ground motion, whereas signals with periods >5s must be handled with care.

Future Work
Based on the gathered data set and the derived hypothesis a project proposal is planned which will be submitted to the Austrian Science Fund (FWF). Furthermore, the publication ‘Jokulhlaups at the A.P. Olsen Ice Cap, NE-Greenland: First Results of the Geodetic and Seismic Monitoring in 2012’ will be re-submitted (->The Cryosphere, Journal of Glaciology).
Data Archiving Statement
Gathered data exists already as a mseed-archive and is ready for the upload. It already exists a unique FDSN network code (5F 2012-2014) and Seis-UK (in person of Victoria Lane) was contacted to clarify all details for the data submission. However, due to some coincidences the actual data transfer has to be postponed to May 2016.
Acknowledgements
GlacioBurst field trip was funded by EU FP7 Interact. Seismic devices were provided by SeisUK, a branch of the Natural Environment Research Council, UK. Borehole geophones were provided by the Department of Geophysics of the Vienna University of Technology. LAPO photos, GIS, discharge and glaciological data were provided by the Greenland Ecosystem Monitoring Programme (GEM). The authors especially thank Abermann J. (ClimateBasis), Larsen S.H. (GlacioBasis), Tamstorf M. and Lund M. (GeoBasis) for data exchange and fruitful discussions.
References
Anderson R.S., Anderson S.P., MacGregor K.R., Waddington E.D., O’Neel S., Riihimaki C.A. and Loso M.G. 2004. Strong feedbacks between hydrology and sliding of a small alpine glacier. J. Geophys. Res., 109, F03005 (doi:10.1029/2004JF000120)
Bingham R.G., A.L. Hubbard, P.W. Nienow and M.J. Sharp. 2008. An investigation into the mechanisms controlling seasonal speedup events at a High Arctic glacier, J. Geophys. Res., 113, F02006, doi:10.1029/2007JF000832.
Bjornsson H. 2010. Understanding j kulhlaups: from tale to theory. J. Glaciol., 56(200), 1002-1010.
Clarke G.K.C. 1982. Glacier outburst floods from `Hazard Lake’, Yukon Territory, and the problem of flood magnitude prediction. J. Glaciol., 28(98), 3 21.
Eisen O., A. Bauder, M. L thi, P. Riesen and M. Funk. 2009. Deducing the thermal structure in the tongue of Gornergletscher, Switzerland, from radar surveys and borehole measurements. A. Glaciol., 50(51), 63-70.
Flowers G.E., Bj rnsson H., P lsson F. and Clarke G.K.C. (2004) A coupled sheet-conduit mechanism for j kulhlaup propagation. Geophys. Res. Lett., 31, L05401 (doi:10.1029/2003GL019088)
Gades A.M., C.F. Raymond, H. Conway and R.W. Jacobel. 2000. Bed properties of Siple Dome and adjacent ice streams, West Antarctica, inferred from radio-echo sounding measurements. J. Glaciol., 46(152), 88-94.
Iken A., R thlisberger H., Flotron A. and Haeberli W. 1983. The uplift of Unteraargletscher at the beginning of the melt season–A consequence of water storage at the bed? J. Glaciol., 29(101), 28 47.
McNamara, D.E., Buland, R.P., 2004. Ambient Noise Levels in the Continental United States. Bulletin of the Seismological Society of America 94, 1517 1527. doi:10.1785/012003001
Metaxian J.-P., S. Araujo, M. Mora and P. Lesage. 2003. Seismicity related to the glacier of the Cotopaxi Volcano, Ecuador. Geophys. Res. Lett., 30(9), doi:10.1029/2002GL016773.
Murray T., G.W. Stuart, P.J. Miller, J. Woodward, A.M. Smith, P.R. Porter and H. Jiskoot. 2000. Glacier surge propagation by thermal evolution at the bed. J. Geophys. Res., 105(B6), 13,491 13,507, doi:10.1029/2000JB900066.
Nye J.F. 1976. Water Flow in Glaciers: Jokulhlaups, Tunnels and Veins. J. Glaciol., 17(76), 181-207.
Peterson, J. (2003), Observations and Modeling of Seismic Background Noise, U.S. Geological Survey open-file report 93-322, Albuquerque, N.M.
Rea B.R. and Evans D.J.A. 2011. An assessment of surgeinduced crevassing and the formation of crevasse squeeze ridges. J. Geophys. Res., 116, F04005, doi:10.1029/2011JF001970.
Springer U. and K. Hutter. 1981. Numerical studies of j kulhlaups. Cold Reg. Sci. Technol., 4(3), 227 244.
Sugiyama S., A. Bauder, P. Weiss and M. Funk. 2007. Reversal of ice motion during the outburst of a glacier-dammed lake on Gornergletscher, Switzerland. J. Glaciol., 53(181), 172 180.
Walter F., Clinton J.F., Dreger D.S., Deichmann N. and Funk M. (2010) Evidence for nearhorizontal tensile faulting at the base of Gornergletscher, a Swiss alpine glacier. Bull. Seismol. Soc. Am., 100(2), 458 472 (doi:10.1785/0120090083)
Walter F., J. F. Clinton, N. Deichmann, D. S. Dreger, S. E. Minson, M. Funk. 2009. Moment tensor inversions of icequakes on Gornergletscher, Switzerland. Bull. Seismol. Soc. Am., 99(2A), doi:10.1785/0120080110.
Walter F., Deichmann N. and Funk M. 2008. Basal icequakes during changing subglacial water pressures beneath Gornergletscher, Switzerland. J. Glaciol., 54(186), 511 521.
Appendix 1
Appendix 2
Conference Presentations
Binder D., S.H. Larsen, M. Citterio, H. Skourup, S.S. Kristensen and W. Schoener (2013): A.P. Olsen Ice Cap - Ice Thickness, Dynamics and Mass Balance. Oral presentation at IACS Workshop on the dynamics and mass budget of Arctic glaciers, 26.-28. February, Obergurgl, Austria.
Binder D. and E. Brueckl (2014): Gletscher als seismische Quellen (Glaciers as seismic source). Oral presentation at the PANGEO, 14.-19. September, Graz, Austria.
Binder D., Boffi G., Kulessa B., Mertl S., Schoener W., Weyss G., Wieser A. (2015): J kulhlaups at the A.P. Olsen Ice Cap, NE-Greenland: First results of the geodetic and seismic monitoring in 2012. Oral presentation at the IGS Symposium ‘Hydrology of Ice Sheets and Glaciers’, 21.-27. June, Hofn, Iceland.
Binder D., Boffi G., Kulessa B., Mertl S., Schoener W., Weyss G., Wieser A. (2015): First results of the geodetic and seismic monitoring at the A.P. Olsen Ice Cap. Poster presentation at the IGS Nordic Branch Meeting, 29.-30. October, Copenhagen, Denmark.
Publications
INTERACT 2015. INTERACT Stories of Arctic Science. Eds.: Callaghan, T.V. And Savela, H. DCE-Danish Centre for Environment and Energy, Aarhus University, Denmark, 180 p., ISBN 978-87-93129-11-5
Binder D., Boffi G., Kulessa B., Mertl S., Schoener W., Weyss G., Wieser A. (2015): Jokulhlaups at the A.P. Olsen Ice Cap, NE-Greenland: First results of the geodetic and seismic monitoring in 2012. Resubmission in 2016.
