Scientific Report 984
This report is also available as a PDF document .
Abstract
An array of Guralp ESPCD broadband seismometers was deployed along the coast of Vaigat strait, West Greenland, to explore the dynamics of icebergs and to understand the controls on iceberg drift, grounding and fragmentation. The monitoring campaign collected 7 weeks of continuous data from 6 instruments. The data contains multiple discrete events per hour throughout the monitored period. Four characteristic seismic signal types have been identified and attributed to different iceberg-related processes, namely fracturing; fragmentation; grounding; and rolling. Examining the frequency of occurrence of each event type within the seismic record of each station enables the spatial distribution of iceberg events to be mapped. In addition, exploring the temporal variations of event occurrence and the relationship with concurrently monitored tide and wind conditions provides insight into the controls on iceberg decay.
Background
Iceberg scour marks and ice-rafted-debris (IRD) deposition are widely used to identify palaeo ice streams and to constrain ice sheet models (Hogan et al., 2012; Sacchetti et al., 2012). However understanding of the controls on iceberg drift, grounding and decay are limited. A focus on iceberg calving from glaciers and tabular icebergs (e.g. Amundson et al., 2008; 2010; MacAyeal et al., 2008; Martin et al., 2010) however has resulted in limited understanding of the rates and controls of the majority of icebergs, which are smaller (<500 m length), and how they evolve with distance from the calving front.
Seismic signals have been observed to be generated by a range of calving iceberg processes: fracturing and ice collapses during calving and the rolling of newly formed icebergs (e.g. Amundson et al., 2008; 2010) and the generated ocean waves (e.g. Amundson et al., 2012; Walter et al., 2013); ice blocks falling into water (e.g. Bartholomaus et al., 2012); grounding and collisions (e.g. MacAyeal et al., 2008 and Martin et al., 2010). Here we test whether a passive onshore seismic array can be used to both identify seismic signature of different decay processes, and then to consider the temporal and spatial distribution of iceberg drift and decay and the controlling conditions. Using an array of seismometers installed along the northern and southern coastlines of Vaigat strait, West Greenland, we set out to:
- Characterise the seismic signatures of iceberg dynamics;
- Examine the spatial and temporal iceberg dynamics related to iceberg character, tides, waves and wind;
- Apply the above outcomes to develop a new model of iceberg dynamics in a fjord/strait setting.
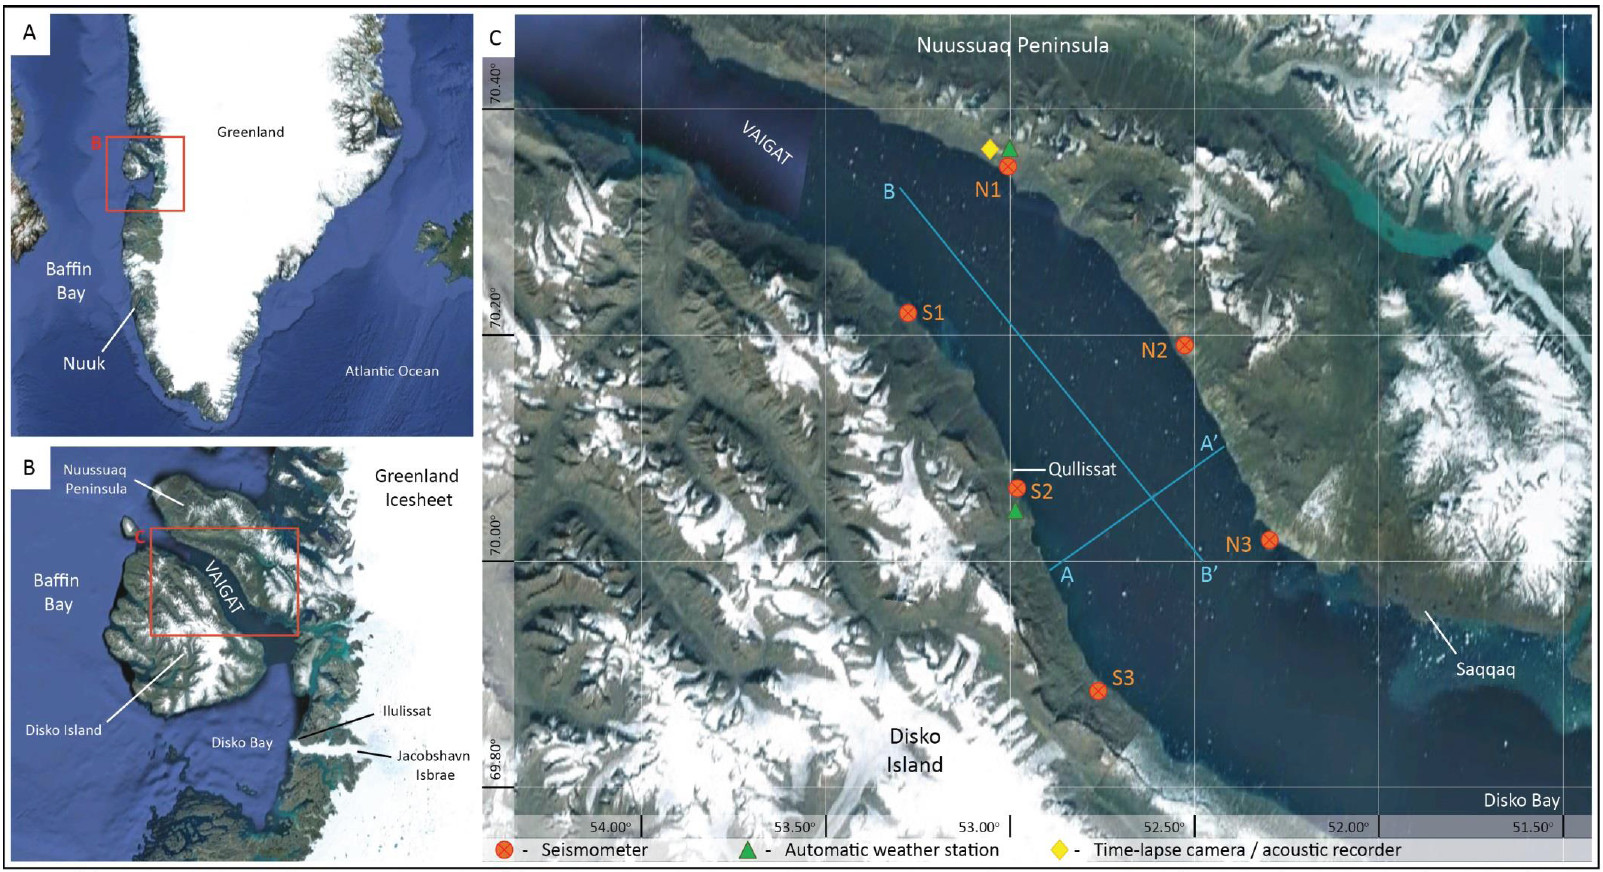
Vaigat strait extends ~90 km northwest between the Nuussuaq Peninsula and Disko Island on the central west coast of Greenland (Figure 1a). The strait is approximately 20 km wide and reaches depths of > 600 m, with a narrow shelf of much shallower waters along both the north and south coastlines on which icebergs frequently ground. Icebergs that travel through Vaigat calve from the Greenland ice sheet outlet glacier Jakobshavn Isbr , amongst others (Figure 1b). Observations from previous fieldwork in Vaigat identified it to be a highly suitable site for this study due to the number of icebergs, the variety of shapes and sizes, the temporal variability in icebergs at varying locations within the strait, and the visual and audio evidence of decay processes and icebergs transit through Vaigat.

Survey procedure
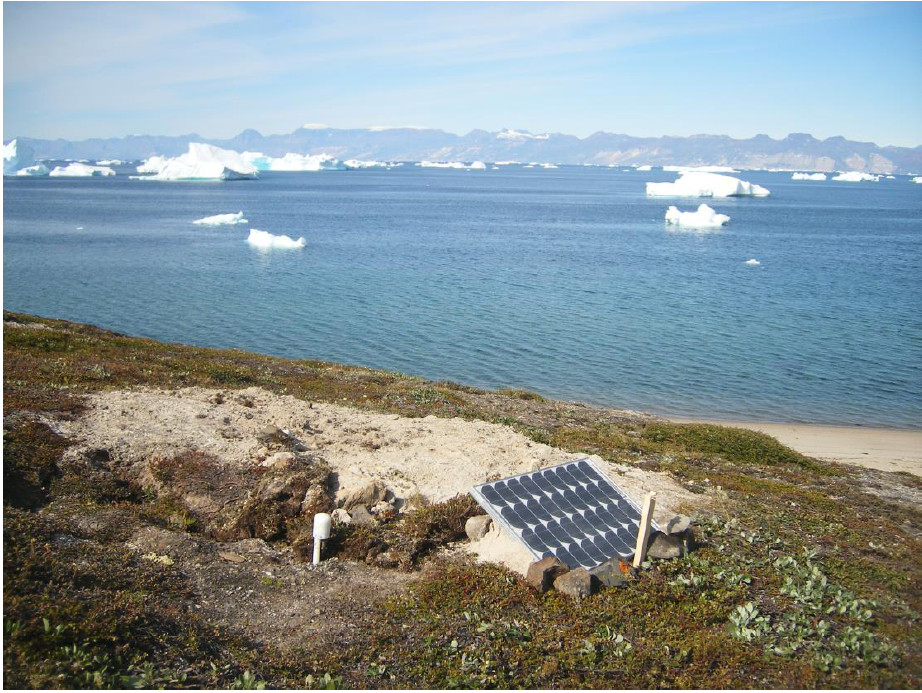
Three Güralp ESPCD seismometers were deployed on each coast of the Vaigat straight, approximately 20 km apart along coast (Figure 1c). Each seismometer was installed approximately 100 m inland from high water mark, on average 26 m above mean sea level (Figure 2). For each seismometer a 1 m deep, 0.6 m diameter pit was dug, and a flat stone was placed at the bottom of the pit which was levelled and on which the seismometer was placed. To insulate the seismometer from temperature fluctuations a foam lined bucket was placed directly over the instrument, and then a wooden box was placed over the bucket, before the pit was then backfilled with soil. The cables, breakout box and battery were then buried behind a 40 W solar panel. The instruments all logged at a sampling rate of 100 Hz throughout the duration of the monitoring period (11th July 6th September 2013). A weather station was installed on each side of the strait at sites S2 and N1 (Figure 1c) and time-lapse camera and acoustic recorder were installed at site N1 (Figure 1c).

Data quality
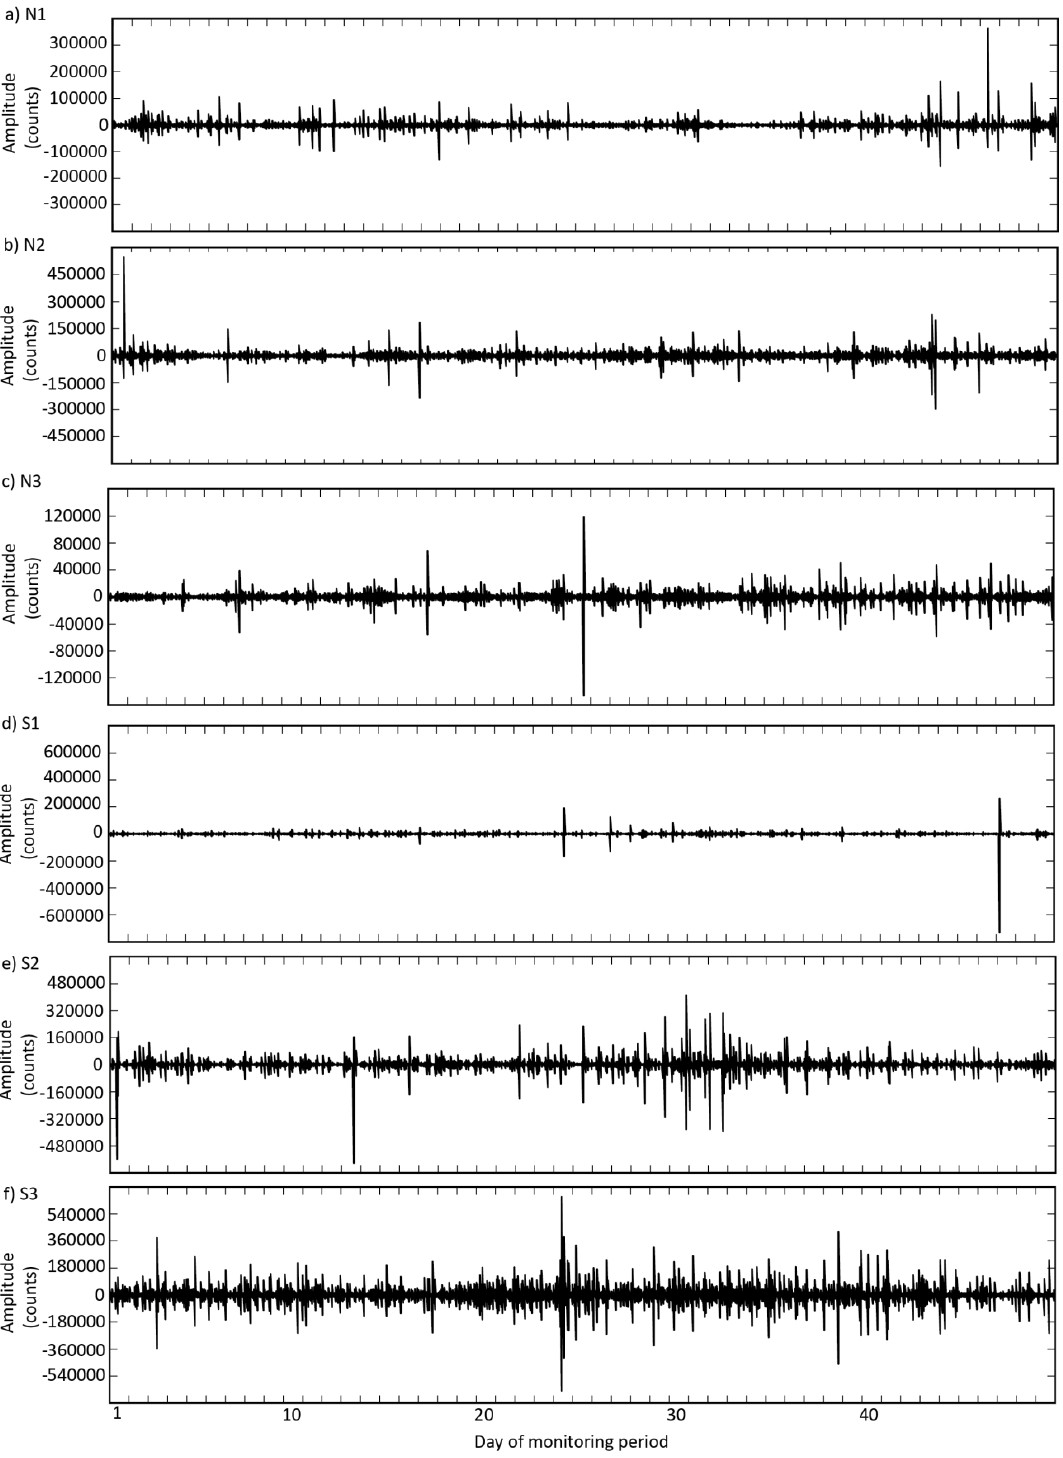
Data was collected continuously, with no data gaps, at all six seismic stations (Figure 3). There were no problems with any of the equipment, with the exception of wildlife chewing a cable. Visual examination has found the data quality to be high, with the majority of events within the 1 - 50 Hz band examined so far fitting into the event types discussed below. Multiple occurrences per hour of the different event types at each of the stations indicates the suitability of the ESPCDs installed along the coastline to detect a range of iceberg signals and to monitor spatial variability in iceberg processes. The weather stations and acoustic recorder also recorded throughout the monitoring period but unfortunately the time-lapse camera stopped working shortly after installation.

Processing and modelling
The data was initially visually inspected and checked for gaps using G ralp’s Scream software. During the visual inspection a number of repeatedly occurring signals were identified, with energy lying within the 1 - 50 Hz band, from which representative examples of each type of signal have been selected. The data was detrended and filtered using a band-pass filter of 1 - 50 Hz to remove ocean wave and distal earthquake signals. Events were then extracted using a short-term average/long-term average (STA/LTA) ratio using a STA of 2s and LTA of 60s which prevented false triggering by noise spikes and also best represented the longer duration events experienced in Vaigat. Events were detected when the STA/LTA ratio exceeded 10. A window of 3s prior to the start time and 10s after the picked end time defined the period of interest. These periods were then extracted from the dataset for further analysis. Current analysis is focussed upon undertaking cross correlation of all the extracted events, to classify each of the picked events from the monitoring period.
Visual inspection of the data indicates that events detected by each seismometer are local (<10 km) and are not detected by the other instruments in the array. Further analysis using cross-correlation between the different seismometers datasets will explore if event magnitude and / or type influence detection at multiple stations. Where events are detected at multiple stations Geiger’s method will be used to determine locations, to map the distribution within Vaigat.
To examine controls on the temporal distribution of the different iceberg processes, and to aid understanding of the observed spatial distributions of iceberg processes and the interactions between strait bathymetry, marine and weather conditions, the time-series of each type of event recorded at each station will be correlated against monitored wind and modelled tide conditions within the strait.
Interpretation to date and preliminary findings
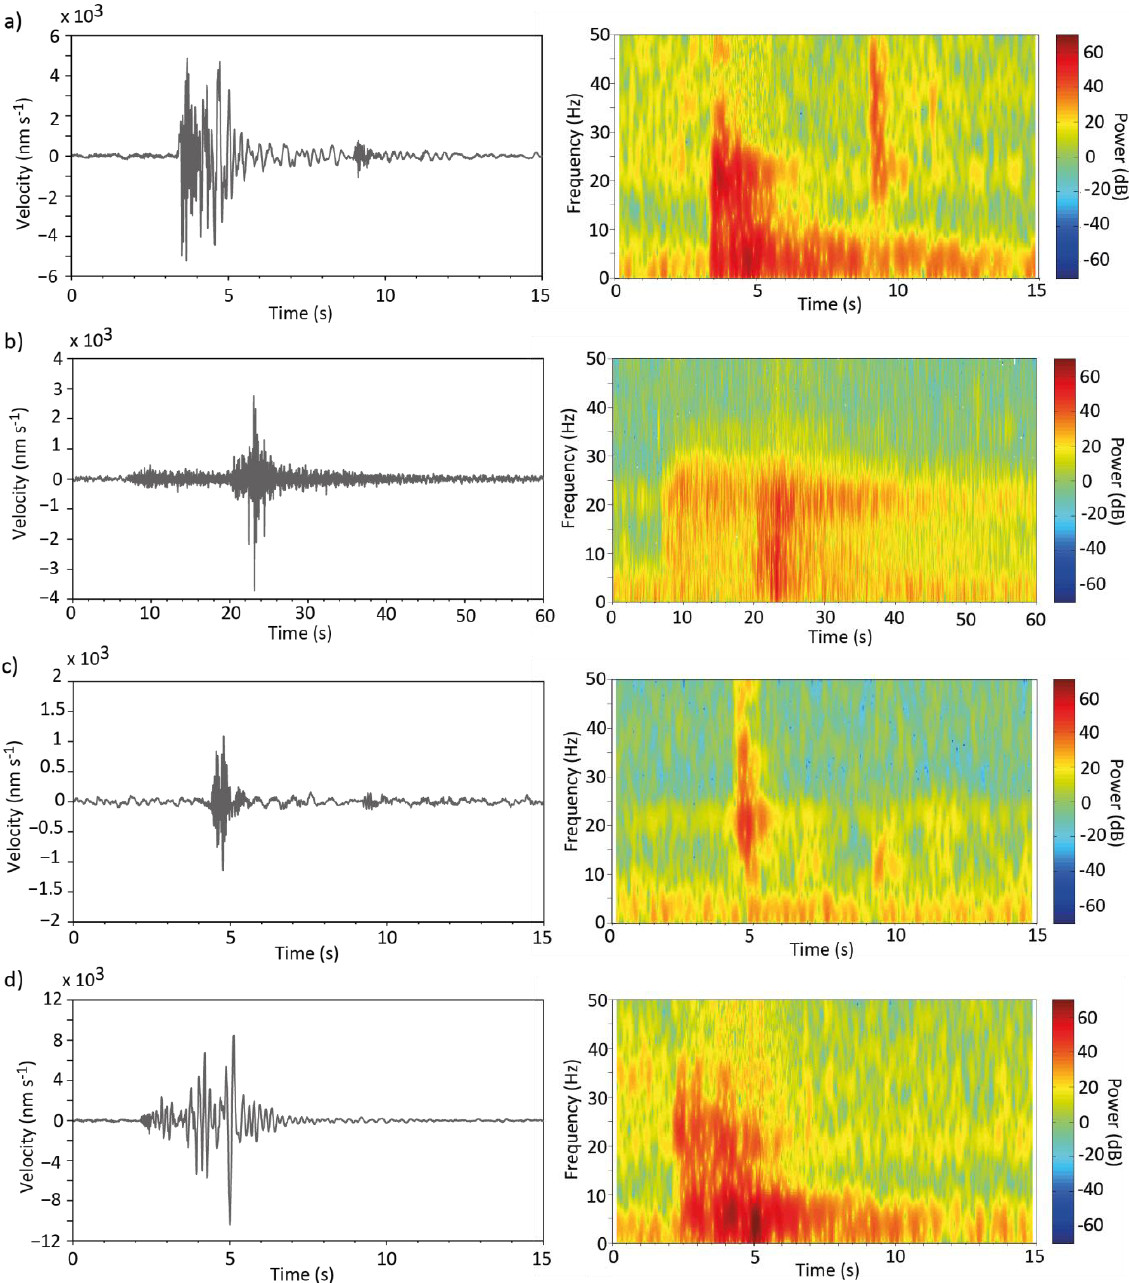
Four signals have been identified to occur repeatedly throughout the 51-day monitoring period (Figure 4):
Type 1 (Figure 4a): Type 1 consists of two peaks, the first of which has a sudden, impulsive onset, and the largest amplitude. The first peak contains frequencies up to 35 Hz, with highest powers occurring between 18 - 23 Hz and 1 - 7 Hz, followed by a dominance of 1 - 7 Hz as the coda decreases. The second peak has a shorter duration and lower amplitude and occupies the range 17 - 48 Hz. The event typically lasts ~ 10s and is the most commonly occurring seismic signal in the monitoring dataset. The high amplitude, high frequency and impulsive start to this signal suggests that this represents a large ice fracture, which in the field can be heard as a loud `shotgun blast’ or crack. This is typically followed by further cracking and rumbling as the resulting break-up of ice causes the iceberg to roll or tilt, with the movement of water around and on the iceberg, here represented by the dominance of the lower frequencies (1 - 7 Hz) following the initial fracture. In the field this was the most regularly observed event type, which anecdotally appeared to occur more frequently on the falling limb of the high tide, and icebergs grounded on the coast fractured as they became stranded in shallow waters.
The waveform and spectral characteristics of the first peak are similar to the `Type I’ events observed by Amundson et al. (2010) caused by fracturing during calving of icebergs from Jakobshavn Isbr . Amundson et al. (2010) observe frequencies up to 30 Hz with dominant peaks at 6 - 9 Hz, however in Vaigat the highest powers occur in two frequency bands. These two frequency bands are believed to represent different iceberg fracturing processes: Hydraulic fracturing has been observed to occur at frequencies of 6 - 15 Hz (West et al., 2010) and at 1 - 3 Hz (O’Neel and Pfeffer, 2007); however the brittle fracture of ice is observed to occur at bands of higher frequencies e.g. 10-20 Hz (O’Neel et al., 2007; Walter et al., 2010) and 20 - 35 Hz (West et al., 2010). The lower amplitude and high frequencies (>15 Hz) of the second peak of this event, not observed by Amundson et al. (2010), may indicate the brittle development of microcracks as the iceberg adjusts to its new shape and position.
Type 2 (Figure 4b): Type 2 events have an emergent onset, with slowly and symmetrically increasing and decreasing coda amplitudes. These events have the longest duration (~ 60s). This signal covers a broad band of frequencies from 1 - 39 Hz, initially with equal power throughout followed by an increase in amplitude at 17 - 23 Hz and 2 - 12 Hz. The low amplitude and broad frequency range that extends throughout this signal suggests it is generated as icebergs ground in the shallow waters along the strait shoreline, and drag and scrape along the seabed. The increase in powers at 17 - 23 Hz and 2 - 12 Hz (similar frequencies observed in the first peak of Type 1) after a few seconds indicate the contact with the seabed results in both the brittle and hydraulic fracture of the iceberg. This is possibly caused by the direct impacts or if the iceberg is no longer fully floating and is stranded out of the water triggering tilting of the iceberg as its centre of gravity changes. This signal is similar to the 1-25 Hz chaotic tremor observed by Martin et al. (2010) as large tabular icebergs make contact with and move over the seabed, resulting in fracturing represented by higher energy bursts as seen here.
Type 3 (Figure 4c): Type 3 signals have a short (~ 3 s) symmetrically increasing and decreasing coda and cover a broad range of high frequencies 8 - 50 Hz, with a well constrained peak at 18 - 23 Hz. Again this signal type occurs frequently throughout the monitoring period. The waveform and spectral characteristics of this signal are similar to the second peak in Type 1 events. The high frequency, short duration of this signal indicate that it represents brittle fracturing within ice (e.g. O’Neel et al., 2007; Walter et al., 2010; West et al., 2010). However the absence of lower frequencies following the peak and the short event duration suggests that this does not result in the break-up or rolling of the iceberg, therefore indicating low amplitude brittle fracturing, potentially the development of microcracks (Bahr, 1995).

Type 4 (Figure 4d): Type 4 events have an emergent onset, are high amplitude and have a duration of ~10 s. These events have a broad frequency range up to 30 Hz, with highest power in the frequency range 1 - 8 Hz, the frequencies which feature in the decreasing coda. The spectral characteristics are similar to the first peak of Type 1 events but without the peak in power at the higher frequencies. Lower frequency (<10 Hz) ice seismic signals are typically associated with ice interactions with water (O’Neel and Pfeffer, 2007; West et al., 2010; Bartholomaus et al., 2012). The absence of a high frequency peak or chaotic tremor suggests this signal does not have an apparent brittle failure or impact trigger, and the dominance of lower frequencies suggests this signal is generated by iceberg rolling triggered by melting and the resulting change in mass and shape destabilising the iceberg. Once an iceberg starts to roll the broad frequency signal indicates both brittle and hydraulic fracturing occurs but the greatest power is associated with hydraulic fracturing frequencies i.e. as icebergs roll water moves into cracks and openings in the ice (West et al., 2007; O’Neel and Pfeffer, 2007). Amundson et al. (2008) observe seismic signals of a large overturning iceberg in Jakobshavn Isbr during a period of no calving in the frequency range 1 - 5 Hz, similar to the dominant frequencies of this signals observed in Vaigat. Bartholomaus et al. (2012) observed the most powerful seismic peaks during calving to be due to ice sea surface interactions, explaining the powerful signal generated as water rushes over the rolling iceberg and the ice crashes into the sea. As ice falls in to the sea and is submerged, high velocity jets of water and ice are caused by the impact generating seismic signals of 1 - 3 Hz (Bartholomaus et al., 2012).
Conclusions and recommendations
The high quality data has demonstrated that onshore seismic arrays are capable of detecting iceberg generated seismic signals. Identification of the four signal types means that the data can be used to explore a range of iceberg processes, their spatial and temporal distribution, and the controls of strait morphology, marine and weather conditions on iceberg dynamics and decay. Examining icebergs away from the calving front, for the first time, has enabled improved characterisation of the distinct seismic signals of different iceberg processes, as there is not the superpositioning of the many processes that occur during calving.
Publications
E Norman, N Rosser, W Szcucinski, S Dunning, A Long, M Strzelecki, M Drewniak and J Benjamin, (2013) Seismic signatures of iceberg collapse and rolls, American Geophysical Union Fall Meeting 2013, San Francisco, USA.
Rosser, N., Vann Jones, E., Dunning, D., Szcucinzki, W. and Strzelecki, M., (In preparation), Short-term iceberg dynamics, Journal of Geophysical Research.
References
Amundson, J. M., Clinton, J. F., Fahnestock, M., Truffer, M., L thi, M. P. and Motyka, R. J. (2012) Observing calving-generated ocean waves with coastal broadband seismometers, Jakobshavn Isbr , Greenland, Annals of Glaciology, 53(60),79-84.
Amundson, J. M., Fahnestock, M., Truffer, M., Brown, J., L thi, M. P. and Motyka, R. J. (2010) Ice m lange dynamics and implications for terminus stability, Jackobshavn Isbr , Greenland. Journal of Geophysical Reseach, 115, F01005.
Amundson, J. M., Truffer, M., L thi, M. P., Fahnestock, M., West, M. and Motyka, R. J. ( 2008) Glacier, fjord, and seismic response to recent large calving events, Jackobshavn Isbr , Greenland, Geophysical Research Letters, 35, L22501.
Bartholomaus, T. C., Larsen, C. F., O’Neel, S. and West, M. E. (2012) Calving seismicity from iceberg-sea surface interactions, Journal of Geophysical Research, 17, F04029.
Hogan, K.A., Dowdeswell, J. A. and Cofaigh, C. (2012) Glacimarine sedimentary processes and depositional environments in an embayment fed by West Greenland ice streams, Marine Geology, 311-314, 1-16.
MacAyeal, D., Okal, E. A., Aster, R. C. and Bassis, J. N. (2008) Seismic and hydroacoustic tremor generated by colliding icebergs. Journal of Geophysical Reseach, 113, F03011.
Martin, S., Drucker, R., Aster, R., Davey, F., Okal, E., Scambos, T. and MacAyeal, D. (2010) Kinematic and seismic analysis of giant tabular iceberg breakup at Cape Adare, Antarctica, Journal of Geophysical Research, 115, B06311.
O’Neel, S., Marshall, H. P., McNamara, D. E. and Pfeffer, W. T. (2007) Seismic detection and analysis of icequakes at Columbia Glacier, Alaska, Journal of Geophysical Research, 112, F03S23.
O’Neel, S. and Pfeffer, W. T. (2007) Source mechanics for monochromatic icequakes produced during iceberg calving at Columbia Glacier, AK, Geophysical Research Letters, 34, L22502.
Sacchetti, F., Benetti, S., Cofaigh, C. and Georgiopoulou, A. (2012) Geophysical evidence of deep-keeled icebergs on the Rockfall Bank, Northeast Atlantic Ocean, Geomorphology, 159-160, 63-72.
Walter, F., Olivieri, M. and Clinton, J. F. (2013) Calving event detection by observation of seiche effects on the Greenland fjords, Journal of Glaciology, 59(213), 162-178.
Walter, F., O’Neel, S., McNamara,D., Pfeffer, W. T., Bassis, J. N. and Fricker, H. A. (2010) Iceberg calving during transition from grounded to floating ice: Columbia Glacier, Alaska. Geophysical Research Letters, 37, L15501.
West, M. E., Larsen, C. F., Truffer, M., O’Neel, S. and LeBlanc, L. (2010) Glacier microseismicity, Geology, 38, 319322.

