Scientific Report 983
This report is also available as a PDF document .
Abstract
GPR and GPS were used to:
- Identify the glacier base.
- Calculate spatial and temporal changes in the glacier velocity.
Background
We have used the innovative wireless Glacsweb probes, dGPS and ground penetrating radar (GPR) to understand the glacier dynamics at Skalafellsj kull, Iceland. The aim of this is to understand how glaciers move and how they respond to climate change.
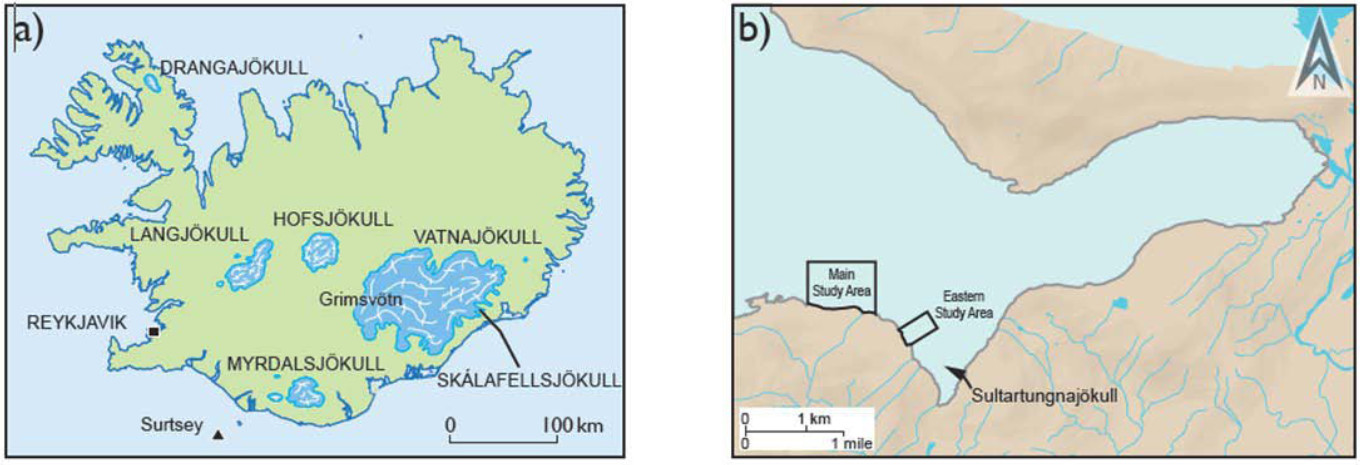
The study was undertaken at Skalafellsjokull, Iceland (Figure 1). This is an outlet glacier of the Vatnajokull icecap resting on Upper Tertiary grey basalts with intercalated sediments (Johannesson and Saemundsson, 1998). The dGPS have been located at the main study site since August 2012, the GPR study took place in the Eastern study area close to the Sultartungnajokull outlet in 2013.
GPR
Survey procedure
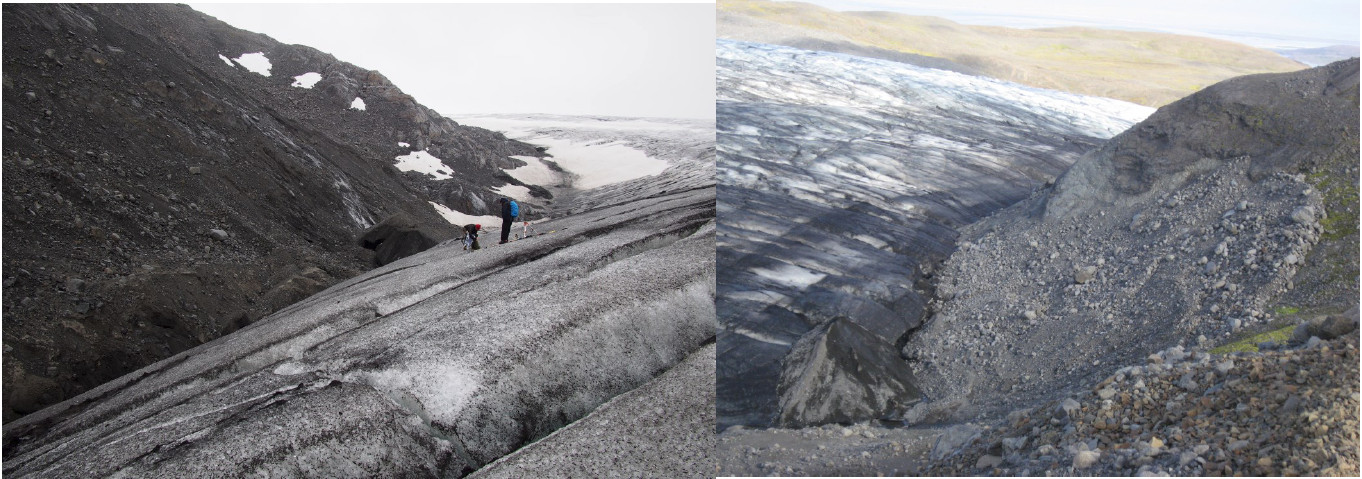
Ground penetrating radar (GPR) survey - The system used for the survey was a Sensors and Software Pulse Ekko 100 with a 1000V transmitter system. A common offset survey was performed using 50 MHz antennas on a grid pattern, with a 2m antenna spacing and 0.5 m sampling interval. A custom built sledge was constructed to hold the antennas at the correct distance apart and allow movement along the transect. The location of the transects were recorded using a Leica differential GPS. Two survey lines of 500m length were made, 50m apart (marked as Eastern study area ib Figure 1b). A photograph of the glacier and foreland in the survey area is shown in figure 2a. It shows the glacier was adjacent to a steep slope (approximately 25°) which comprised till overlying bedrock. The till is also shown in figure 2b. This is estimated to be approximately 1 - 2 m thick
Processing and modelling
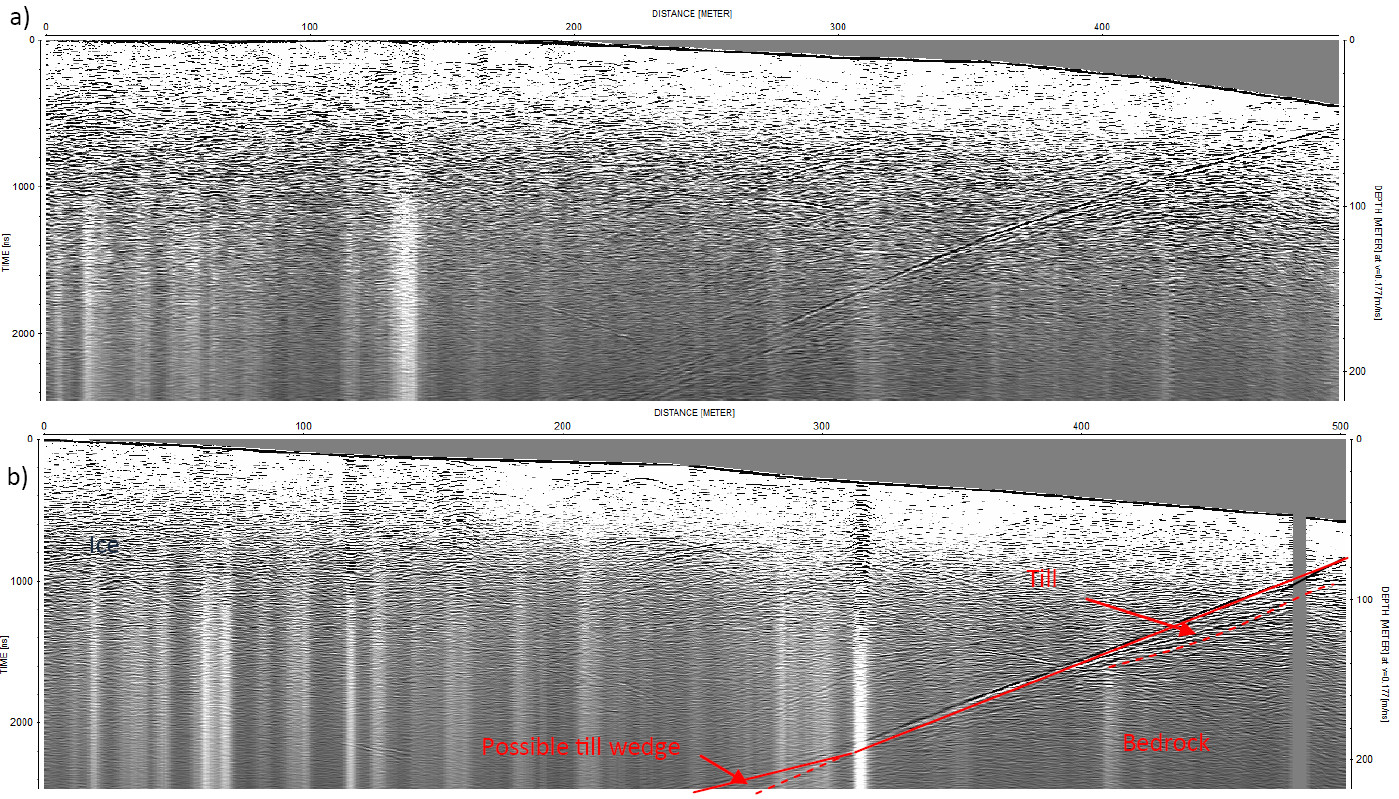
The data was analysed using the software package ReflexW. For the initial analysis of the common offset surveys, the following processes applied: the elimination of low frequency noise (dewow filter), the application of a SEC (spreading and exponential compensation) gain to compensate for signal loss with depth. Next a diffraction stack migration and topographic correction were applied (Figure 3).
The radar-wave velocity (v) in the whole ice column has been calculated from previous studies (Hart et al., 2015) from the measured glacier depths (d) and two-way travel time (t) where v = 2d/t. The average for three years (2008, 2011, 2012) was 0.177 m ns-1.
Interpretation to date
The radargrams from show a very similar pattern with a clear glacier bed (Figure 3). From this the depth of the glacier could be measured. From this data we were able to reconstruct glacier depth over the southern part of the glacier and calculate the hydraulic potential to investigate subglacial hydrological pathways (Hart et al., 2015).
Both radargrams also show a second layer beneath the glacier which may be the till layer. The depth of this layer can be calculated knowing the radar-wave velocity in till, which was calculated from the previous GPR surveys (Hart and Martinez, 2013). Dry till or bedrock was found to be 0.101m ns-1 and saturated till (>20% water) to be 0.08m ns-1, which is similar to that found for till by other researchers (Murray et al., 1997). Typical thickness of the till layer up-glacier (e.g. 250m along Line A) for dry till was 4.2m, wet till 2.17m; and for close to the margin (e.g. 380m along Line A) for dry till was 3.36m, wet till 1.72m. The latter is very close to the observed till depths in the fore-land.
There is also a possible till thrust sheet (wedge) at 250m on Line B. These features have been observed at the main site in previous years and have been interpreted as active subglacial glaciotectonics.
Overall, the results show that the slope of the glacier base and the nature subglacial environment is very similar between the main the main and eastern study area, and so we can assume that this pattern is consistent over most of the southern margin.
The GPS survey
Survey Procedure
Four Leica 1200 dGPS units were installed on the ice on 2m pyramids in the main study area (Figure 1), with a fixed base on the moraine. It was planned that they would operate with a summer (June-September) or winter (October-May) schedule. The summer schedule collected dual frequency (L1 + L2) data at 15 second sampling rate continuously, on which approximately 90 days was stored (memory card storage 183 days) and the units were powered by solar panels and batteries. The winter schedule collected dual frequency (L1 + L2) data at 15 second sampling rate at a reduced schedule, storage comprised approximately 230 days at 2 hours per day (19 days equivalent), and the units were powered by 8 x 18 AH batteries for 2 hrs per day (maximum 250 days).
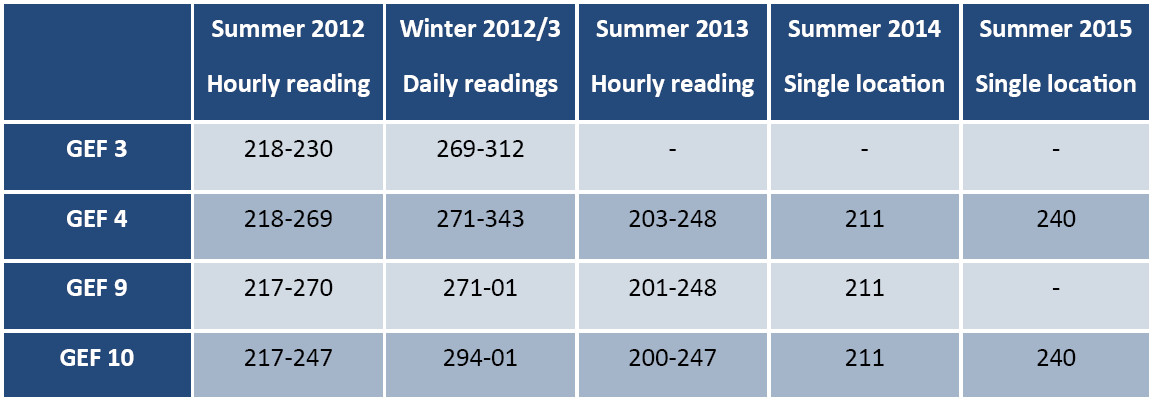
The summer 2012 schedule went as planned, and the GPS were turned onto their winter schedule in late September, and some data was downloaded in October. Unfortunately a Leica software error meant that 2 of the units turned off on 9th December 2012, and due to the snow at the site it was not possible to manually re-install the new software (to allow the unit to continue recording) until July 2013. The other 2 continued to function until Jan 1st 2013 (Table 1)
Weather data from previous years indicated that the site normally became snow free (and thus accessible) in early June, so in June 2013 the team returned to the site to manually start the units, but heavy snow cover prevented this. In July 2013 the team returned again and were successful. Data was collected for 47 days. In September 2013 the team returned to turn the units onto their winter schedule. However, the units did not record any winter data.
In summer 2014, the team returned to the site to collect the units, however the whole site was covered in up to 2m of snow, and so the team was only able to dig out two of the units. However they were able to record the location of the units. In summer 2015, the remaining units were collected, and the location of the units and remaining pyramids recorded.
In the three year period (from July 2012 to August 2015) due to unusually cold winters with high snow fall, the four pyramids remained frozen to the glacier surface from the winter of 2012/2013 onwards.
Performance
Overall the units performed well during the summer and winter periods. However, the main problems were the software bug and the difficulties with unusually high snow fall preventing early summer access to the site to turn the system on to its summer schedule. The pyramid system worked well, specially during winter when the bases were frozen in. The power usage was measured to be 2.6 W when on and 0.2 W when sleeping. The solar power inputs were measured at between 0.5 A and 2 A in the day time (in summer). The power system worked for the first two years, but from September 2013 the batteries lost power, and snow covered the solar panels. The Leica units and batteries were housed in Duratool cases, unfortunately after 2 years these began to leak, due to the rapid snow melt during summer, but the Lecia units themselves survived being half submerged in water.
Processing and Modelling
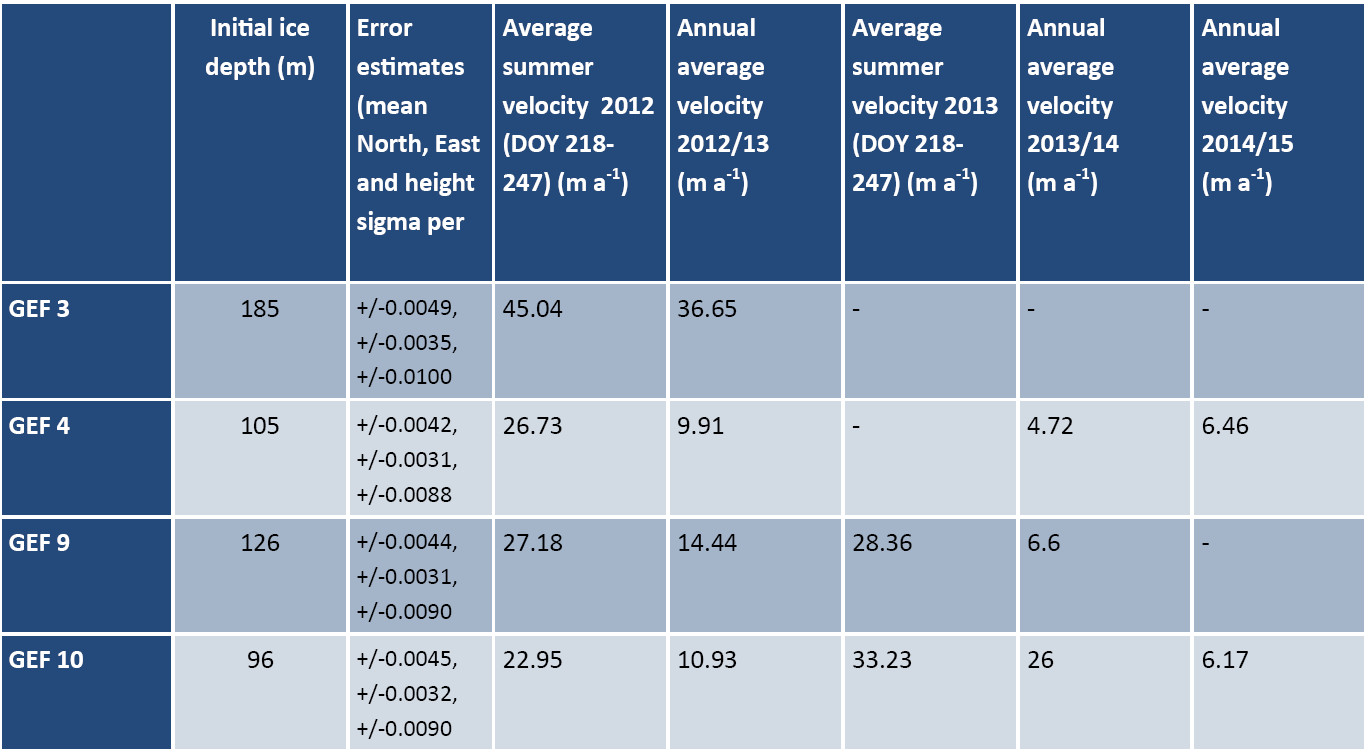
The GPS data has been processed using TRACK (v. 1.24), the kinematic software package developed by Massachusetts Institute of Technology (MIT) (https://www.unavco.org/, https://geoweb.mit.edu/~tah/track_example/) and the overall results are shown in Table 2. The overall processing strategy was to: 1) convert data to RINEX format; 2) process the local fixed base station (MORN) on the moraine against the IGS station at Hofn and export the processed MORN to RINEX format; 3) initially process GPS data against processed MORN using a basic parameter configuration in TRACK ; and 4) carry out more advanced TRACK processing (through trial and error) on those sites and days that require it (determined by analysis of the output generated by basic processing).
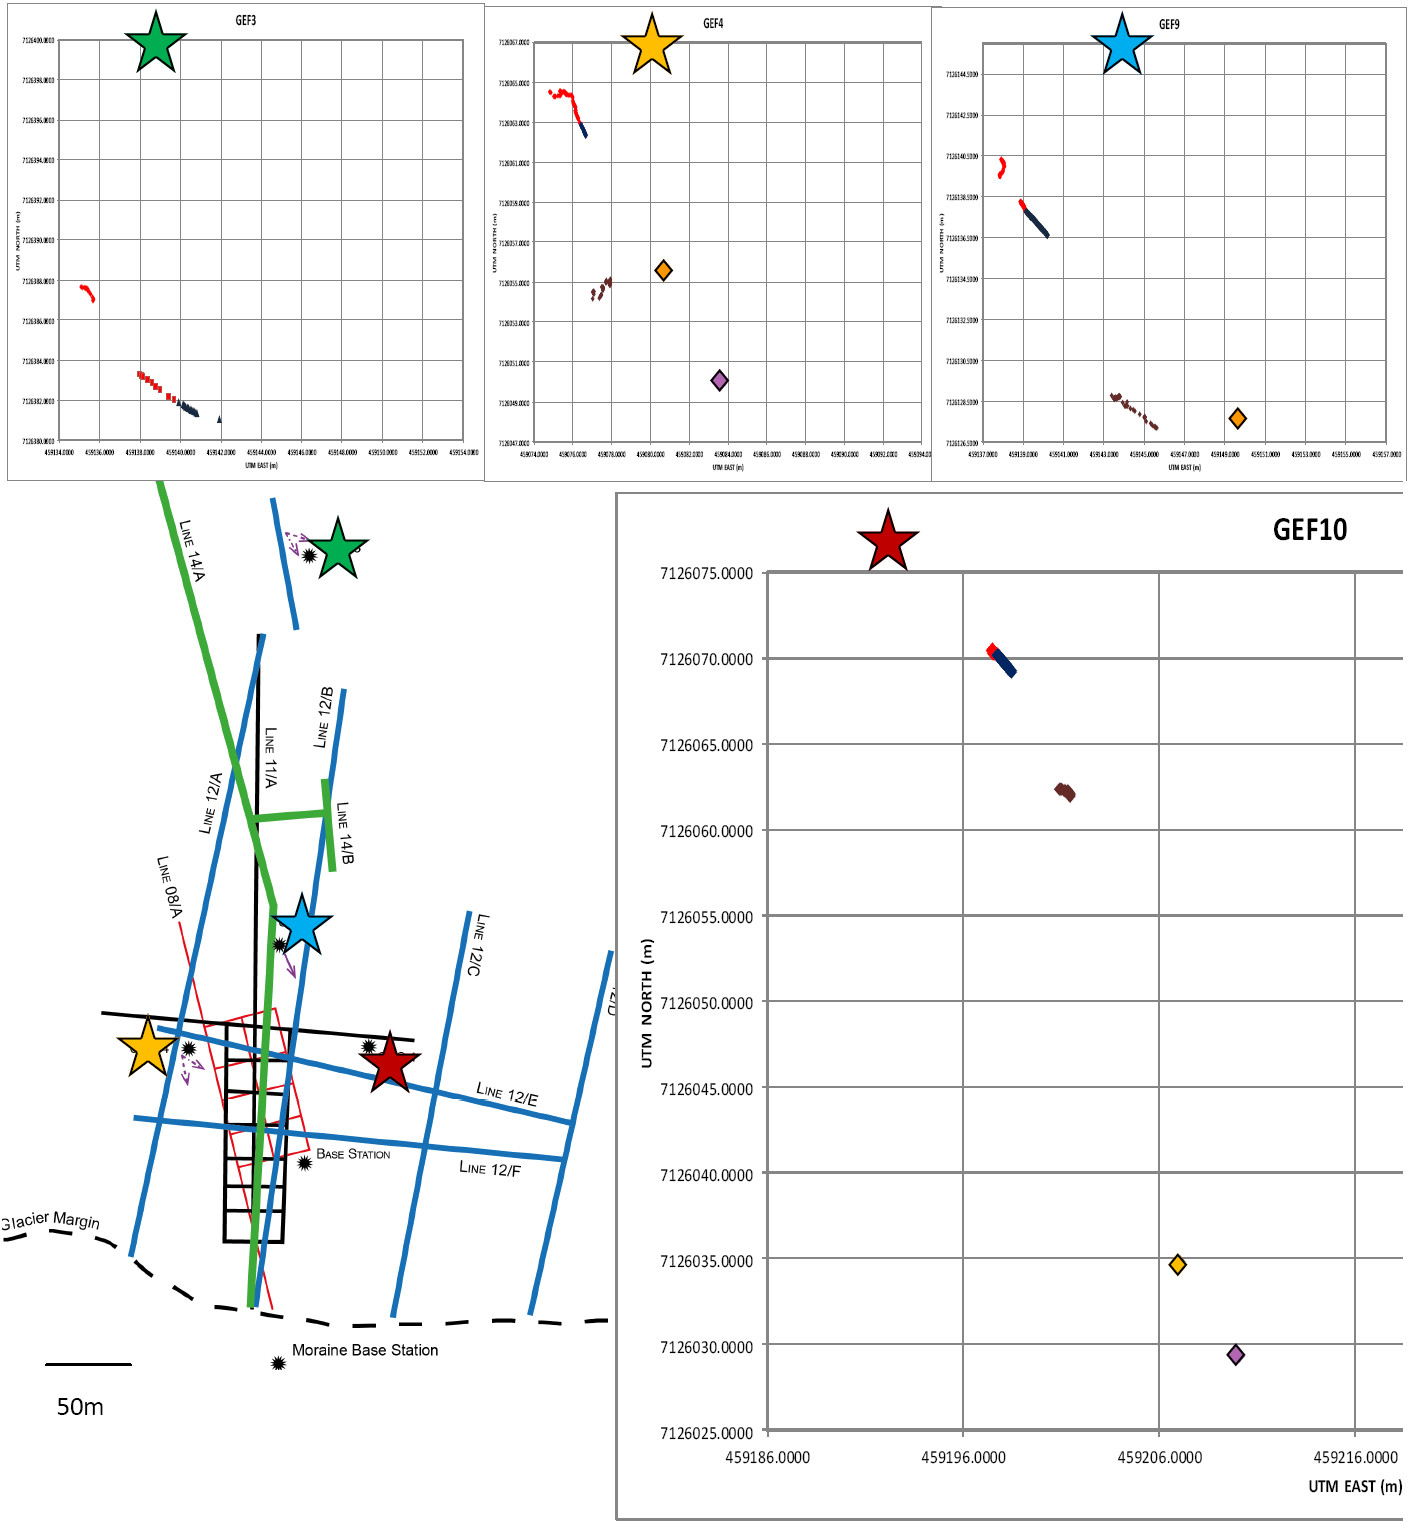
The GPS record down-glacier ice movement that can be used to establish velocity. Although some of the movement recorded by the GPS was associated with ice surface ablation and the resulting tilt of the tripods on which the antennas are mounted, the calculated melt over August 2012 from the GPS was the same as that measured in the field (0.05m per day), so errors were small.
Interpretation to date
i) Ice direction — Ice was generally flowing towards the south west. The movement of the units is shown in Figure 4.
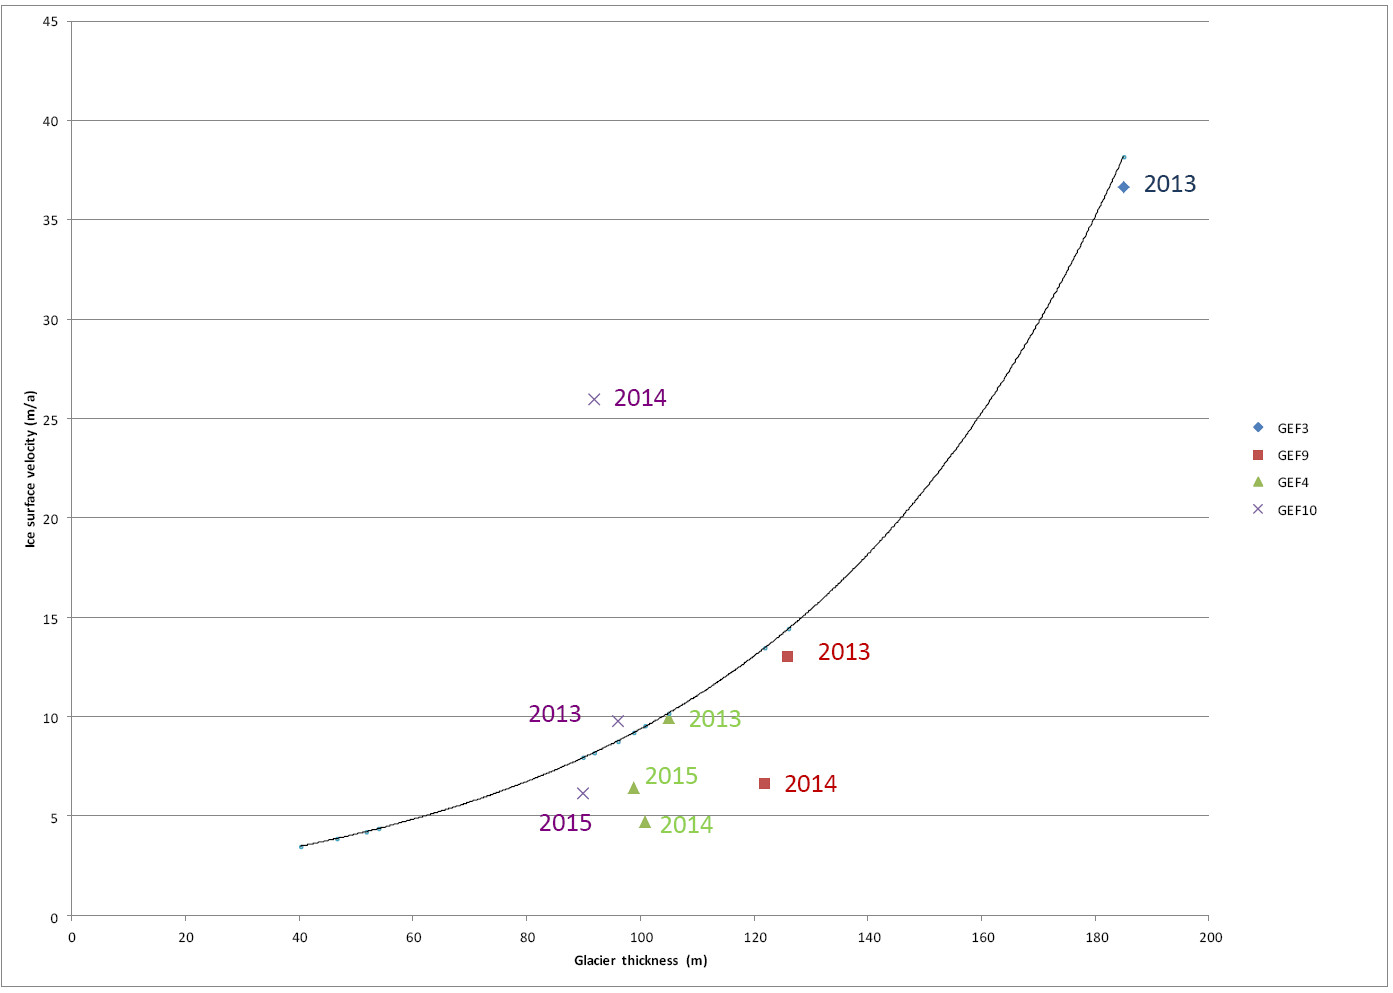
ii) Annual surface ice velocity — Table 2 shows the overall annual movement of the different units over different years. Figure 5 shows the relationship between the glacier thickness and surface velocities of the units. In 2013/14 GEF4 and GEF9 were slower than 2012/13 (mean -5.8 m a-1), whilst in 2014/15 GEF4 and 10 they were of similar velocity (mean -2.27 m a-1). However, in 2013/14, GEF10 moved 25m, much further than expected. Since the pyramid had remained frozen to the glacier surface, and the movement direction is similar to other years (Figure 4), this is likely to reflect to reflect a true measurement.
iii) Summer velocities — Table 2 also shows a comparison between the surface velocities during the summers of 2012 and 2013 for GEF10 and 9. During summer 2012, GEF9 has a higher velocity, commensurate with its thicker ice. However during summer 2013 the velocities are much higher in GEF10. This suggests that much of the higher annual velocity recorded must reflect increased summer velocity.
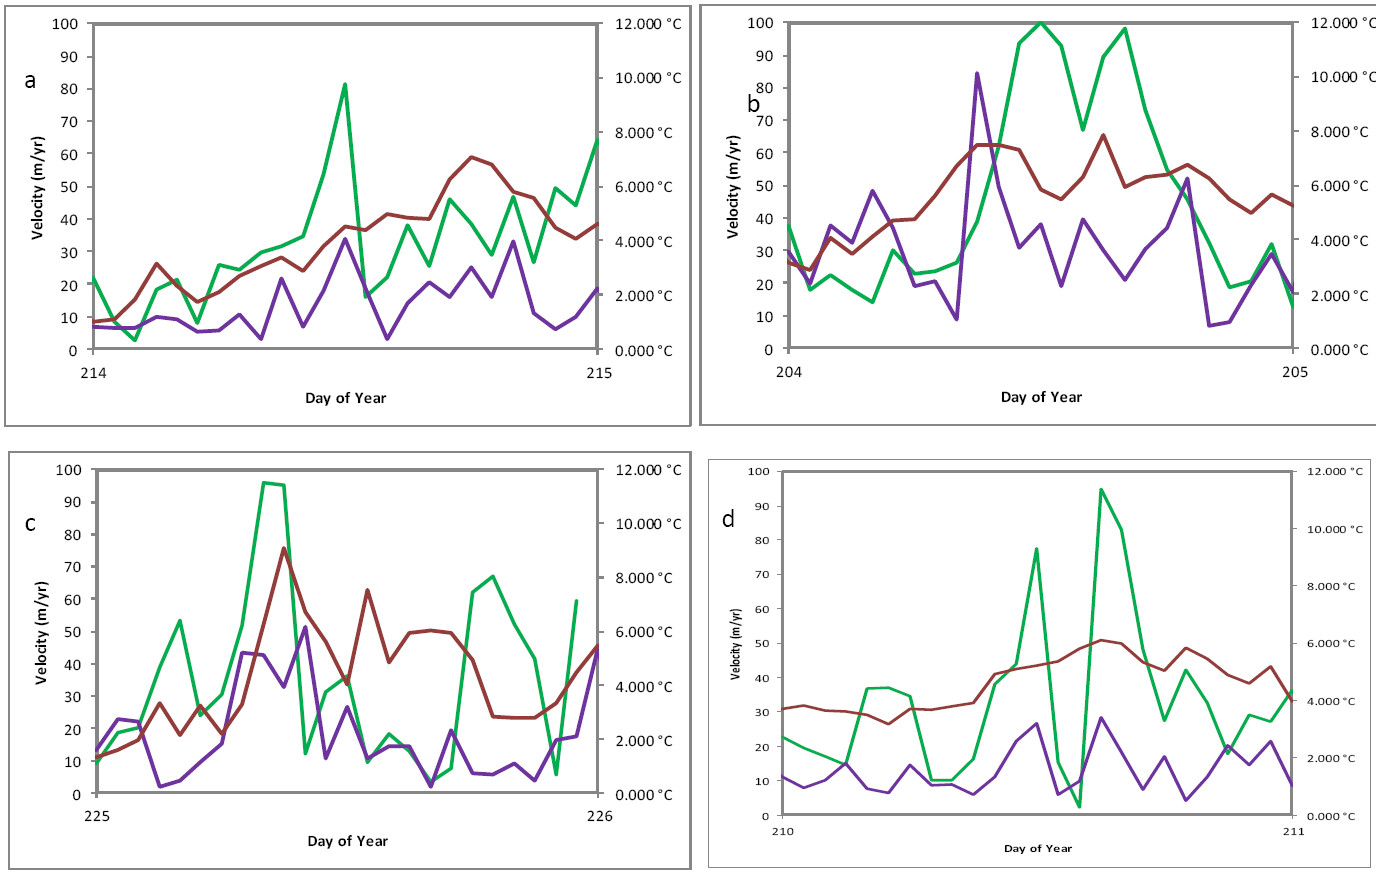
We can examine these differences in more detail. During the summer of 2013 we have continuous hourly data for both GEF9 and GEF10 on 33 days, which we can compare with diurnal air temperature cycles. On the majority of days (68%) the two units advance at the same time, during the morning increase in air temperature (Figure 6a). However, for 11% of the days GEF9 had a velocity peak during the temperature rise followed by GEF10 during the afternoon maximum (Figure 6b), and 11% of the days, there was the opposite pattern (Figure 6c). The fourth style consisted of days when the GEF10 velocity peaked during the temperature rise, but velocities at GEF( remained low all day (Figure 6d). Also from figure 6 it is clear that the velocities in GEF10 are consistently higher than GEF9. Over the 33 days with a full data set GEF10 had a velocity twice that of GEF9.
This ratio is also the same on the days when there is relatively high movement at GEF10 and low movement at GEF9 (Fig. 6d).
iv) Interpretation of the increased velocity in GEF10 in summer 2013/4 — GPR results from 2012 show that this part of the glacier is underlain by a subglacial hill approximately 100m wide and 150m long, which is composed of till. Within this feature are lines, which may be faults within the till (Hart and Martinez, 2013). We suggest that this high movement at GEF10 must relate to movement along the faults associated active subglacial glaciotectonics. This may be due to stick-slip motion along this till fault boundary.
Conclusion
The results from the GPR allowed the reconstruction of glacier depth outside the main study area, and showed that the nature of the subglacial environment was very similar along the southern glacier margin. The GPS results showed a consistent ice flow direction to the south east and changes in ice velocity at the different sites over the three year period. In general the ice flowed slower in 2014, but also returned to 2012 levels in 2015. The only anomaly was GEF10 in 2014 that flowed much faster than expected. During the summer, ice velocities were twice that of GEF9 (even though it had flowed slower in 2013). We suggest this increase in velocity is due to stick-slip motion associated with active subglacial glaciotectonics found beneath the GEF10 site. The GPS results showed a consistent ice flow towards the south east and changes in ice velocity at the different sites over the three year period. In general the ice flowed slower in 2013/14, and almost returned to 2012/13 levels in 2014/15. The only anomaly was GEF10 in 2013/14 that flowed much faster than expected. During the summer of 2013, ice velocities of GEF10 were twice that of GEF9 (even though it had flowed slower in 2012). We suggest this increase in velocity was due to stick-slip motion associated with active subglacial glaciotectonics found beneath the GEF10 site.
Ackowledgements
The authors would like to thank the Glacsweb Iceland 2013, 2014 & 2015 teams for help with data collection (Philip Basford, Tom Bishop, Graeme Bragg, Alex Clayton, Frey Martinez Hart, Andrew Turner Tyler Ward). Thanks also go Mark Dover for figure preparation. This research was funded by Leverhulme.
References
Hart, J. K. and Martinez, K (2013) Loan 961 - Glacier dynamics at Skalafellsjökull, Iceland , NERC GEF Report.
Hart, J. K., Rose, K. C., Clayton, A., & Martinez, K. (2015). Englacial and subglacial water flow at Skálafellsjökull, Iceland derived from ground penetrating radar, in situ Glacsweb probe and borehole water level measurements. Earth Surface Processes and Landforms, 40(15), 2071-2083.
Jóhannesson, H. and Sæmundsson, K. (1998). Geological Map of Iceland, 1:500 000: Bedrock Geology, Icelandic Institute of Natural History
Murray, T., Gooch D.and Stuart, G.W. (1997). Structures within the surge-front at Bakaninbreen, Svalbard using ground penetrating radar, Annals of Glaciology, 24, 122-129.
Data archive
The data is archived at www.glacsweb.org
