Scientific Report 968
This report is also available as a PDF document .
Abstract
The original objectives of this proposal were
- To make a tomographic image of the low-velocity, hot or/or melt-bearing bodies beneath Askja central volcano in the northern rift zone of Iceland;
- To constrain the crustal and upper mantle velocity structure, including anisotropy beneath the northern rift zone and the Vatnajökull region using ambient noise and surface waves;
- To map seismicity caused by melt movement beneath the five active volcanoes currently lying beneath the Vatnajökull ice cap.
All three objectives have been achieved, and published, with more papers in preparation. An extension request for objectives 2 and 3 was granted and given a new loan number, 980, so those objectives are reported separately in a parallel Scientific Report to save repetition. Loan 968 of 20 seismometers supplemented 26 6TD and ESP seismometers purchased by Cambridge University and deployed on this project. During summer 2014 to summer 2015 the array was also supplemented by 15 Guralp 6TDs from SEIS-UK under loan 1022 deployed to monitor the Holuhraun eruption.
Background
Tomographic imaging of volcanoes is an important tool in understanding the distribution of melt below the surface because molten rock strongly reduces the seismic velocity. S-waves are especially sensitive to temperatures and the presence of melt because S-waves cannot travel through liquid. Even small percentages of melt will change the bulk properties and depress the seismic velocity. Both P-wave (Vp) and S-wave (Vs) velocities are reduced by the presence of melt, but since S-waves are more strongly affected, the Vp/Vs ratio is increased if melt is present.
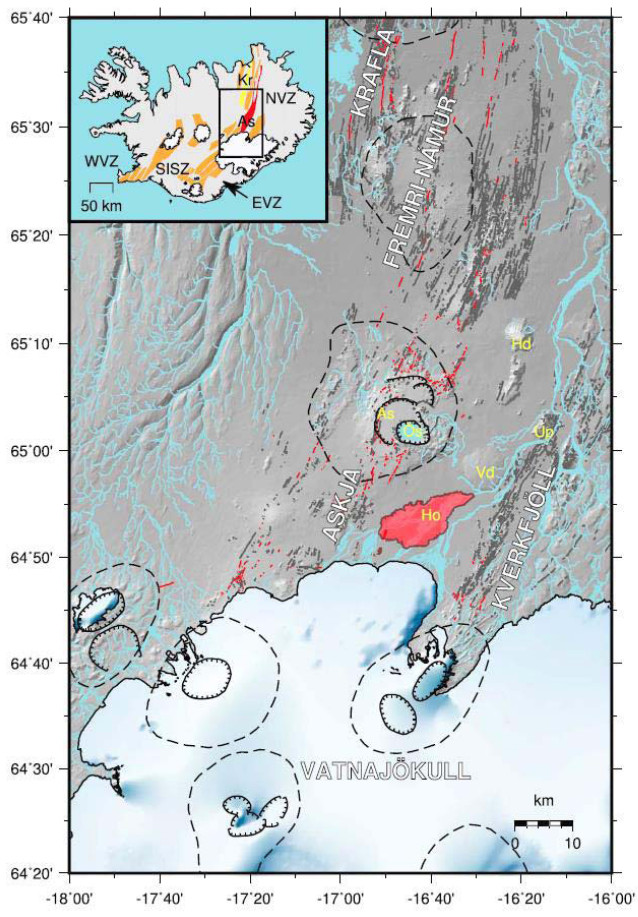
Askja is located at the southern end of the Northern Volcanic Zone (NVZ, Fig. 1 inset), which marks the location of the plate spreading boundary between the North American and Eurasian plates where it passes through Iceland. Askja erupted in 1875 with a spectacular plinian eruption which formed the most recent caldera, Öskjuvatn. Another series of significantly smaller eruptions occurred from Askja in the early part of the 20th century. Askja’s most recent eruption was in 1961 when a 2 km long fissure opened on the north side of the volcano and erupted for 5 weeks.
The P-wave velocity (Vp) structure of the Askja region was reported by Mitchell et al. [2013]. A large low-velocity region was imaged at a depth of 8 km below sea level (bsl) and interpreted to be the primary magma chamber of Askja. However, because of a limited distribution of earthquakes and stations, regions to the south of Askja and below 10 km were not well imaged. In this study, we use a denser network of three-component seismometers deployed around Askja and a larger and more spatially distributed catalogue of earthquakes incorporating those used by Mitchell et al. [2013] to image Vp and the Vp/Vs ratio in the subsurface. This significantly improves the images from Mitchell et al. [2013] and allows us to interpret the magmatic plumbing system from mid-crustal depths (20 km bsl) to the surface.
Survey procedure
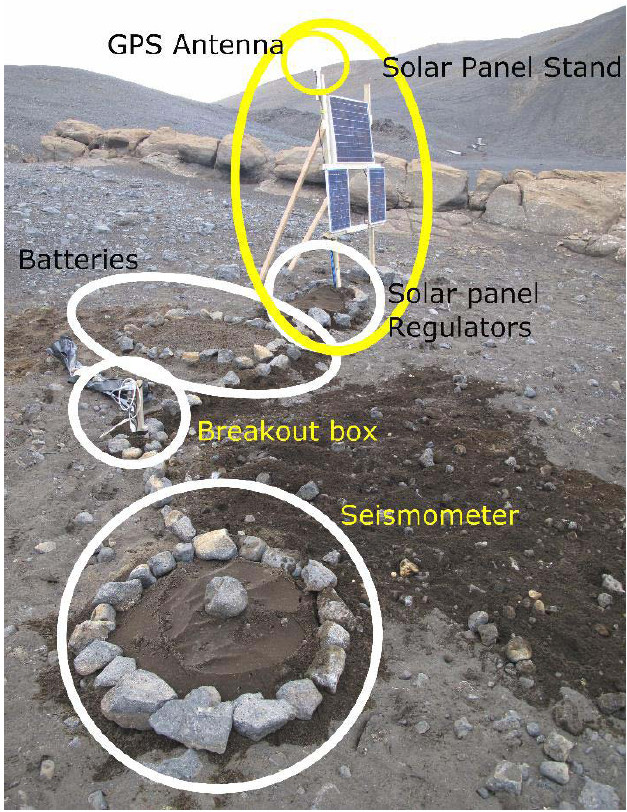
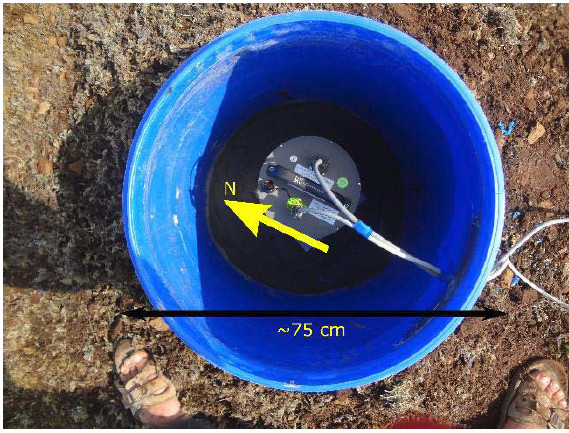
The seismic data was recorded continuously at 100 sps with continuous GPS. Almost continuous daylight in summer (this is near the Arctic circle), together with the use of large truck batteries (typically 3 x 115 Amp-hrs) and multiple solar panels on each site (typically 80 watts), provided sufficient power supply through both the summer and winter months to keep the seismometers operating continuously. Solar panels are mounted sub-vertically to reduce snow adherence in the wetter spring months and to catch the low angle returning sun (Fig. 2). The GPS antenna is attached to the top of the stand so that it above the snow cover in winter. We bury the batteries and solar panel regulators, but mount the breakout box on a short stick: this is because when they are buried, they are more prone to becoming flooded as the snow melts. It is also easier to access the sockets for servicing. 6TD seismometers were buried directly (in plastic bags), while for ESPs we built a small underground vault using fish barrels and concreted base, with drainage (Fig. 3).
The prevalence of basaltic rocks means that compasses are unreliable indicators of true north, so we used GPS to orient the seismometers. It is best to use a differential GPS receiver, but when that was not available we found that a normal hand-held GPS unit could be used equally well. We took a fix at the seismometer and then walked quickly 100-200 metres either north or south (depending on the terrain) and erected a pole at that point to provide a visual pointer for aligning the seismometer. At these high latitudes there is excellent satellite coverage, and provided little time was spent in locating the position for the pointer (by simply keeping the longitude on the GPS the same as you walked), the normal time-varying positional errors in the GPS were minimised to less than the practical accuracy of aligning the seismometer.
A 16 Gbyte seismometer typically filled the memory in 10.5 months, so we serviced the array twice: once in early July, which is the earliest we could access the area; and again in early September. This also gave us the opportunity to replace any failing components at the sites (we found the GPS antennae to be often the most likely component to fail during deployments).
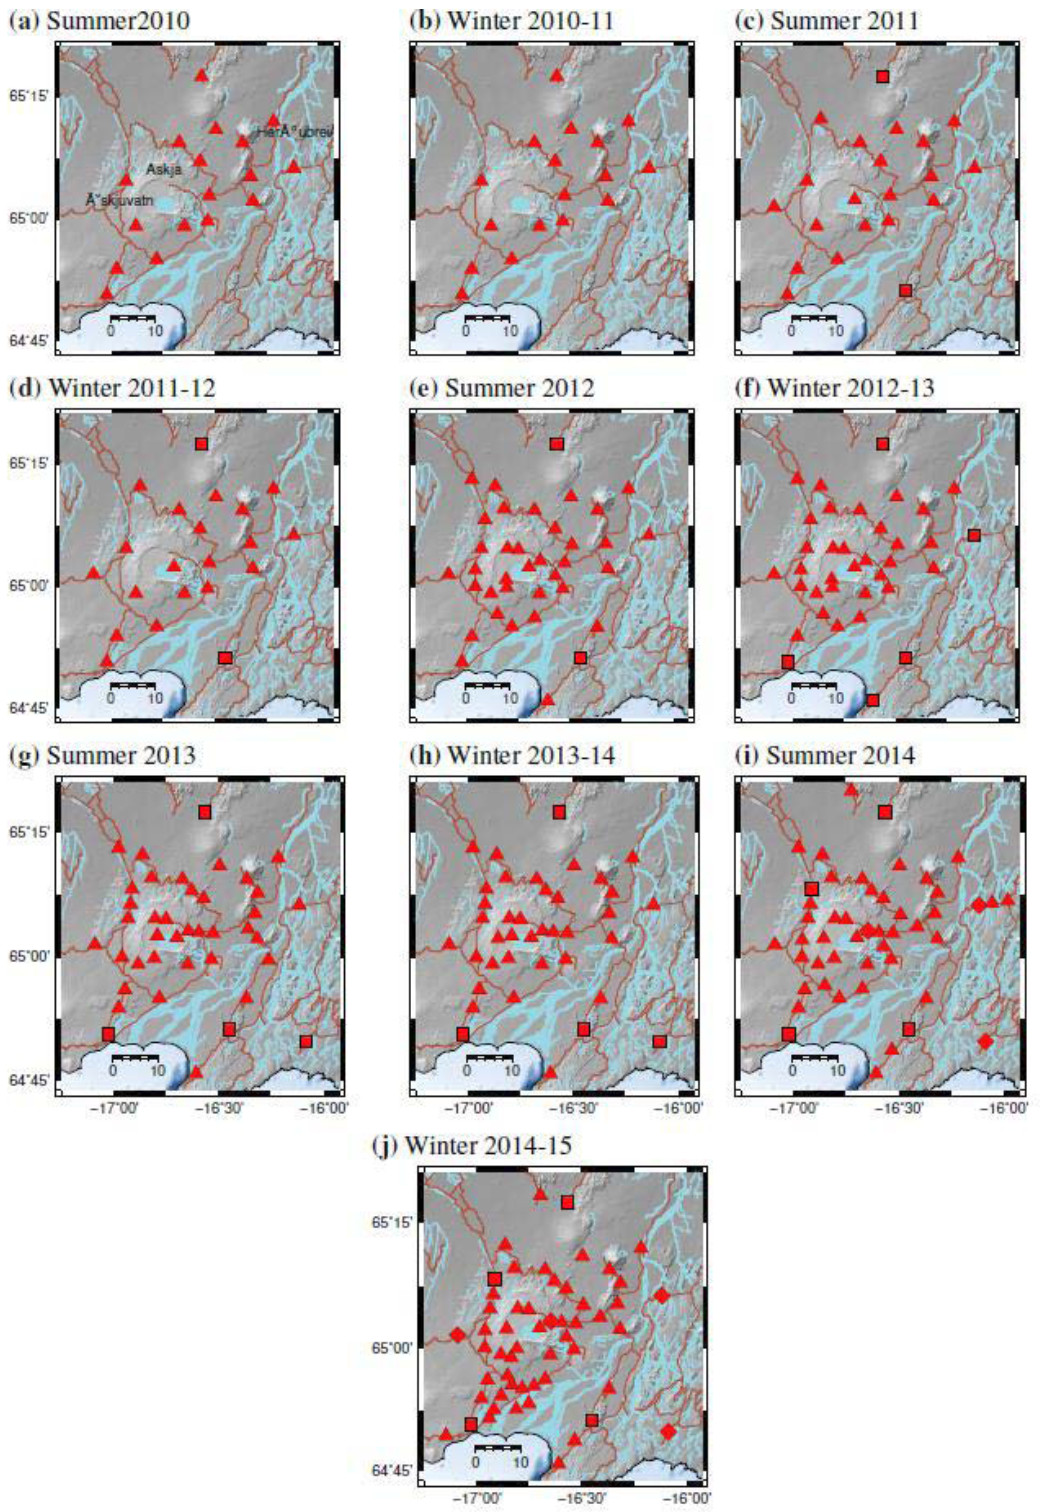
The tomography across Askja benefitted from having multiple crossing ray-paths. To achieve this we kept a core of stable seismometer locations whilst moving others around the area to maximise ray coverage. Figure 4 shows the varying seismometer arrays used for the tomography.
Data quality
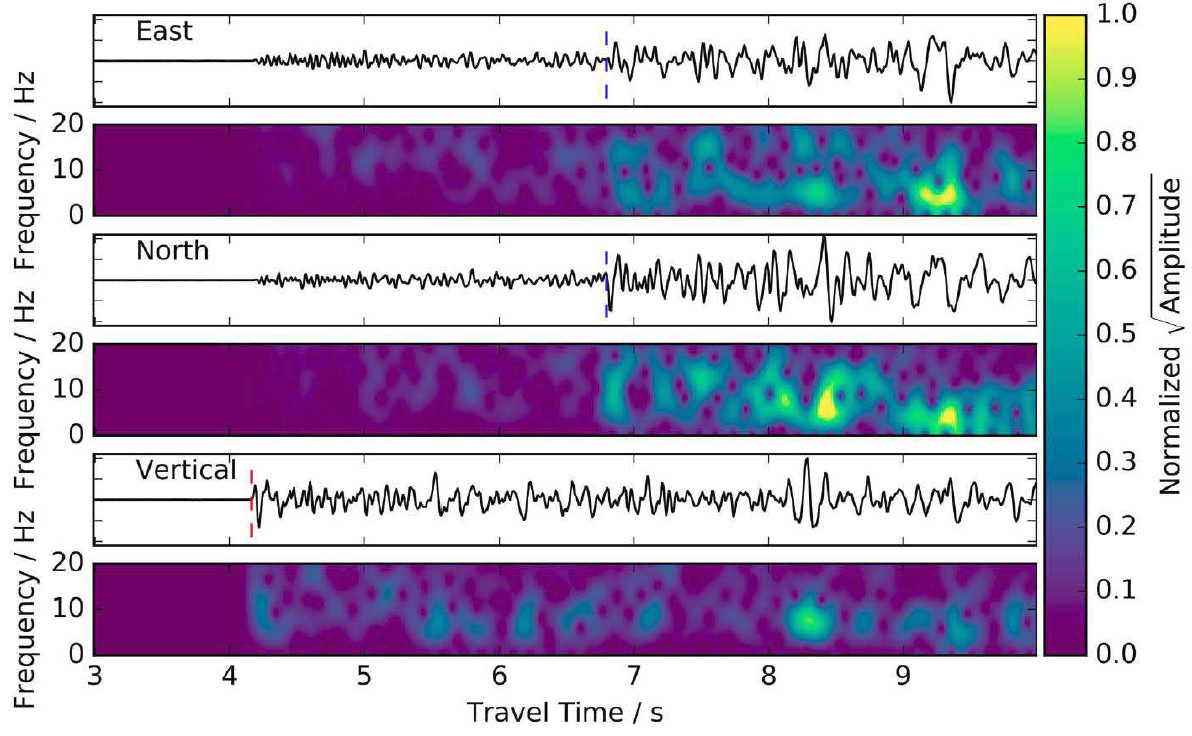
The data quality is extremely good, particularly in the winter (Fig. 5). This is because the ground is frozen, so the buried seismometers are coupled to the ground extremely well. There is no cultural noise, and the lack of vegetation means that there is no noise induced, for example by wind blowing trees. The snow cover decouples the ground somewhat from wind shear.
Processing and modelling
Earthquakes were automatically detected and located using Coalescence Microseismic Mapping (CMM) [Drew et al., 2013]. The resulting catalogue for the Askja region in the period 2009-2015 consists of more than 30,000 earthquakes. We have manually refined the arrival time picks for more than 3,000 earthquakes chosen to give good spatial and depth coverage of the region. Typically, the events contain impulsive P- and S-wave arrivals which can be picked to accuracy of 0.01 s and 0.02 s respectively. Importantly, the Bárðarbunga-Holuhraun dike intrusion during 2014-15 [Ágústsdóttir et al., 2016] produced many earthquakes up to local magnitudes of 5 south of Askja in a previously seismically quiet area. Inclusion of these earthquakes dramatically improved the tomographic velocity model by increasing the spatial coverage and number of crossing ray paths.
The manually refined earthquakes were relocated using NonLinLoc [Lomax et al., 2000]. We use the 1D seismic velocity model derived by Mitchell et al. [2013] from local earthquakes around Askja to locate the events. From this catalogue we selected 1363 earthquakes (~42,000 arrival times) which each have more than 8 arrival time picks and a root-mean-squared residual misfit of less than 0.25 s as an input into the tomographic inversion.
Tomographic method
We use the tomographic inversion method of Roecker et al. [2006]. Travel times are calculated on a 120 x 80 x 38 km 3D Cartesian grid with a grid spacing of 500 m, and intragrid times are estimated by trilinear interpolation. We invert for Vp and Vp/Vs directly and infer Vs from those models, partly because of the interpretive usefulness of Vp/Vs but also because estimates of Vp/Vs derived from ratios of Vp and Vs models suffer from inconsistencies in resolution. Inversion is performed using the LSQR algorithm and the resulting perturbations are then smoothed using a moving window of three grid points in each direction. Importantly, even though we relocate the hypocenters at each iteration, we invert for both the hypocentres and the wave-speed and so avoid potential biases generated by only inverting for the wave-speed model.
From an initial data variance of 0.3564 s2 the 3D model has reduced the variance by 99% (0.0036 s2). This suggests that the initial 1D model is a poor fit to the data and that we have dramatically improved the fit to the data. The expected variance given the uncertainties on the data is 0.0002 s2, an order of magnitude smaller than the variance of the final model. This indicates that while there may be further unmodelled structure in the data, the model is probably not fitting noise.
We use checkerboard tests to assess the minimum possible size of a detectable velocity anomaly using the grid spacing, earthquake locations and seismic network of the observed data. The checkerboard tests show how well we can recover an initial checkerboard-like velocity model using the network and earthquakes used in the actual inversion.
Interpretation to date [see Greenfield & White, 2015 for full details plus 3D movies]
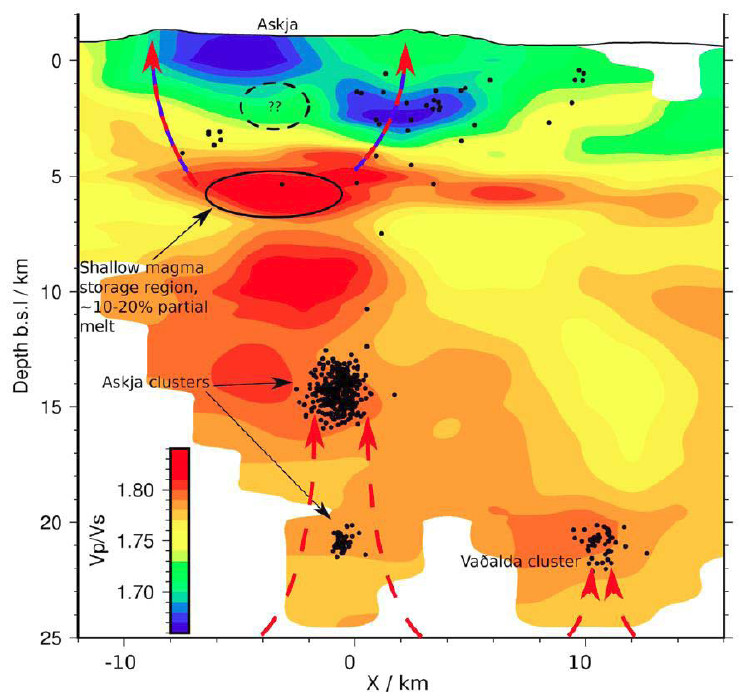
The distribution of earthquakes and seismic velocity anomalies beneath Askja are suggestive of a complex magmatic plumbing system with melt distributed throughout the crust (Figures 6, 7). Melt is currently being actively intruded into a number of discrete locations in the mid-crust, rather than at a single location beneath the central location. These regions must have been active for a relatively long time, as short-lived intrusion events for which we know the dates do not have an associated seismic velocity perturbation.

Shallower magmatic bodies, such as those imaged beneath Krafla [Einarsson, 1978; Schuler et al., 2015] and inferred beneath Askja are likely to be formed close to the beginning of an eruption and to cool quickly afterwards. Because of this, they are likely to play a less important role in how the Icelandic crust is built than larger magmatic bodies that exist, deeper in the crust. Only a small proportion of the melt injected into the crust is extruded at the surface, with the rest freezing in-situ to generate the bulk of the mid- and lower-crust. The low-velocity regions and active seismicity we record deeper than 9 km represent melt ponding in the deeper crust.
Conclusions and recommendations
We have used a large catalogue of earthquakes with manually refined arrival times for both the P- and S-waves to invert simultaneously for the earthquake locations and the velocity structure beneath Askja, a central volcano in central Iceland. Results show three main seismic velocity anomalies in the upper crust:
-
A region of high-Vp, high-Vs and low-Vp/Vs ratio in a ring around Askja at a depth of 2 km bsl, interpreted to be due to a high seismic velocity intrusive complex in the shallow crust beneath Askja.
-
A region of high-Vp and high-Vp/Vs ratio at a depth of 2 km bsl around the table mountain Herðubreið caused by the pervasive fracturing of this seismically active region.
-
A region of low-Vp, low-Vs and high-Vp/Vs ratio with a total volume of ~100 km3 directly beneath Askja, concentrated at two depths (5 and 9 km bsl), interpreted to be the primary melt storage regions in the upper crust.
In the lower crust, despite a reduction in the sensitivity of the tomographic inversion as revealed by extensive synthetic tests, seismic anomalies consist of regions of low-Vs and high-Vp/Vs associated with the earthquakes in the lower crust. This suggests that these regions are areas of significant melt storage as well as regions where melt is being actively transported.
The sensitivity in the shallowest part of the upper crust beneath Askja has been tested using synthetic tests. These indicate that the maximum size of any potential magma chamber at this depth is ~15 km3 which, although large enough to source the eruption in Askja in March 1875, is small relative to the much larger low-velocity bodies imaged deeper in the crust. Although such large bodies are unlikely to spend much of their time as fully molten entities, they probably act as a final storage and equilibration depth for any eruption sourced from beneath Askja. These bodies are likely to exist beneath many Icelandic volcanoes, but due to the difficulties in imaging them have not yet been mapped.
We have now started a project to image the magma storage regions beneath Bardarbunga volcano using similar methodology with the seismic data recorded on this project and others over the decade in which we have been recording data in Iceland. Bardarbunga caldera subsided 65 metres during the 2014-15 eruption, and we know that 1.8 cubic kms of melt was removed and extruded in the dyke and eruption. It will be instructive to compare the melt storage under Bardarbunga with that constrained under Askja and, at lower resolution, from our previous work over Grimsvötn.
Location of archived data
The raw and miniseed data are archived at Bullard Laboratories, Cambridge University on two different RAID arrays in different buildings, and also at SEIS-UK. The data will be uploaded to IRIS in August 2019, 3 years after the end of the loan. In the meantime, we are collaborating and providing this data for research with several researchers in other countries (Germany, Belgium, Estonia, Iceland, Ireland and France).
The locations of all the microearthquakes we have identified are published in Supplementary Information of Ágústsdóttir et al. (2016) [approx. 31,000 events from the Bardarbunga dyke], and Greenfield et al. [approx. 70,000 events from the Askja-Herðubreið area] where they are publicly available for download.
Text Citations
Drew, J., White, R. S., Tilmann, F. & Tarasewicz, J. (2013). Coalescence Microseismic Mapping, Geophysical Journal International, 195, 1773‒1785, doi: 10.1093/gji/ggt331
Einarsson, P. (1978), S-wave shadows in the Krafla caldera in NE-Iceland, evidence for a magma chamber in the crust, Bull. Volcanol., 41(3), 187–195.
Lomax, A., J. Virieux, P. Volant, and C. Berge (2000), Probabilistic earthquake location in 3D and layered models: Introduction of a Metropolis-Gibbs method and comparison with linear locations, in Advances in Seismic Event Location, edited by C. H. Thurber and N. Rabinowitz, pp. 101–134, Kluwer, Amsterdam.
Mitchell, M., White, R. S., Roecker, S. & Greenfield, T. (2013). Tomographic image of melt storage beneath Askja volcano, Iceland using local microseismicity, Geophysical Research Letters, 40, 5040–5046, doi:10.1002/grl.50899
Roecker, S. W., C. H. Thurber, K. Roberts, and L. Powell (2006), Refining the image of the San Andreas Fault near Parkfield, California using a finite difference travel time computation technique, Tectonophysics, 426(1-2), 189–205, doi:10.1016/j.tecto.2006.02.026.
Schuler, J., Greenfield, T., White, R.S., Roecker, S. W., Brandsdóttir, B., Stock, J. M., Tarasewicz, J., Martens, H. & Pugh, D. (2015). Seismic imaging of the shallow crust beneath the Krafla central volcano, NE Iceland, Journal of Geophysical Research, 120, 7156−7173, 10.1002/2015JB012350
Refereed publications using data from this loan
Ágústsdóttir, T., Woods, J., Greenfield, T., Green, R. G., White, R. S., Winder, T., Brandsdóttir, B., Steinthórsson, S. & Soosalu, H. (2016). Strike-slip faulting during the 2014 Bárðarbunga-Holuhraun dike Intrusion, central Iceland. Geophysical Research Letters, plus Supplementary Information, 43, 1495‒1503, doi: 10.1002/2015GL067423
Caudron, C., White, R. S., Green, R. G., Woods, J., Ágústsdóttir, T., Donaldson, C., Greenfield, T., Rivalta, E. & Brandsdóttir, B. Seismic amplitude ratio analysis of the Bárðarbunga-Holuhraun dike propagation and eruption, Journal of Geophysical Research, in press.
Green, R.G., White, R.S. & Greenfield, T. (2014). Bookshelf faulting in the north Iceland volcanic rift zone, Nature Geoscience,7, 29‒33, plus Supplementary Information, doi: 10.1038/NGEO2012
Green, R. G., Greenfield, T. & White, R. S. (2015). Triggered earthquakes suppressed by an evolving stress shadow from a propagating dyke, Nature Geoscience, 8, 629‒632, doi: 10.1038/NGEO2491
Green, R. G., Priestley, K. F. & White, R. S. (2017). Ambient noise tomography reveals upper crustal structure of Icelandic rifts, Earth and Planetary Science Letters, 466, 20–31, doi: 10.1016/j.epsl.2017.02.039
Greenfield, T. & White, R. S. (2015). Building Icelandic igneous crust by repeated melt injections, Journal of Geophysical Research, doi: 10.1002/2015JB012009
Greenfield, T., White, R. S. & Roecker, S. (2016). The magmatic plumbing system of the Askja central volcano, Iceland as imaged by seismic tomography, Journal of Geophysical Research, 121, doi: 10.1002/2016JB013163
Hudson, T. S., White, R. S., Greenfield, T., Ágústsdóttir, T., Brisbourne,A. & Green, R. G. (2017). Deep crustal melt plumbing of Bárðarbunga volcano, Iceland, Geophysical Research Letters, 44, doi: 10.1002/2017GL074749
Jenkins, J. S., Cottaar, S., White, R. S. & Deuss, A. (2016). Depressed mantle discontinuities beneath Iceland: Evidence of a garnet controlled 660 km discontinuity? Earth and Planetary Science Letters, 433 (2016) 159–168, doi: 10.1016/j.epsl.2015.10.053
Jenkins, J., Maclennan, J., Green, R. G., Cottaar, C. & White, R. S. Crustal formation on a spreading ridge above a mantle plume: receiver function imaging of the Icelandic crust, Journal of Geophysical Research, Solid Earth, submitted.
Pugh, D. J., White, R.S. & Christie, P.A.F. (2016). Automatic Bayesian polarity determination, Geophysical Journal International, doi: 10.1093/gji/ggw146
Pugh, D. J., White, R.S. & Christie, P.A.F. (2016). A Bayesian method for microseismic source inversion, Geophysical Journal International, doi: 10.1093/gji/ggw186
Sigmundsson, Freysteinn, Hooper, Andy, Hreinsdóttir, Sigrún, Vogfjord, Kristín, Ófeigsson, Benedikt, Heimisson, Elías Rafn, Dumont, Stéphanie, Parks, Michelle, Spaans, Karsten, Guðmundsson, Gunnar B., Drouin, Vincent, Árnadóttir, Thóra, Jónsdóttir, Kristín, Guðmundsson, Magnús Tumi, Högnadóttir, Thórdís, Friðriksdóttir, Hildur María, Hensch, Martin, Einarsson, Páll, Magnússon, Eyjólfur, Samsonov, Sergey, Brandsdóttir, Bryndís, White, Robert S., Ágústsdóttir, Thorbjörg, Greenfield, Timothy, Green, Robert G. et al. (2015). Segmented lateral dyke growth in a rifting event at Bárðarbunga volcanic system, Iceland, Nature, 517, 191‒195, doi:10.1038/nature14111
PhD Dissertations
2015 David Pugh - Bayesian source inversion of microseismic events
2016 Tim Greenfield - The velocity structure and micro-seismicity of Askja central volcano, Iceland
2016 Robert Green - The structure and seismicity of Icelandic rifts
2017 Jenny Jenkins - Mantle interfaces beneath Iceland
Conference Abstracts
We have published over 100 conference abstracts using the seismometers from this loan, and there is not space here to list them all. But the results are contained in the theses and refereed publications listed above which are all publicly available.

