Scientific Report 961
This report is also available as a PDF document .
Abstract
GPR and GPS were used to:
-
Identify the glacier base, and combined with measured borehole depths, map the glacier depth (0-190m) and calculate the radar velocity through ice (0.179m ns-1).
-
Identify three styles of subglacial glaciotectonic compressive deformation from the radargrams: a) subglacial thrust sheets (2.7-5m thick sheets moving at approximately 3m per year); b) an elon-gated hill, oriented parallel with the ice direction (elongation ratio 1.4:1; 20m high, 142m long, with a step proximal side and a shallow distal side), composed of till thrust sheets (4-5m thick)(drumlinoid); c) a series of till ridges perpendicular to ice direction (6m high, 50-110m in length) also comprising till thrust sheets (ribbed moraine)
-
Calculate spatial and temporal changes in the glacier velocity.
Background
The interaction between subglacial water and sediments is a critical component of glacier dynamics. Understanding this interaction, and any associated processes is vital for the prediction of glacier response to climate change and the reconstruction of past glacier behaviour from glacial sediments. In our project we plan to use a combination of the innovative wireless Glacsweb probes, dGPS and ground penetrating radar (GPR) to study the glacier dynamics at Skalafellsjökull, Iceland.
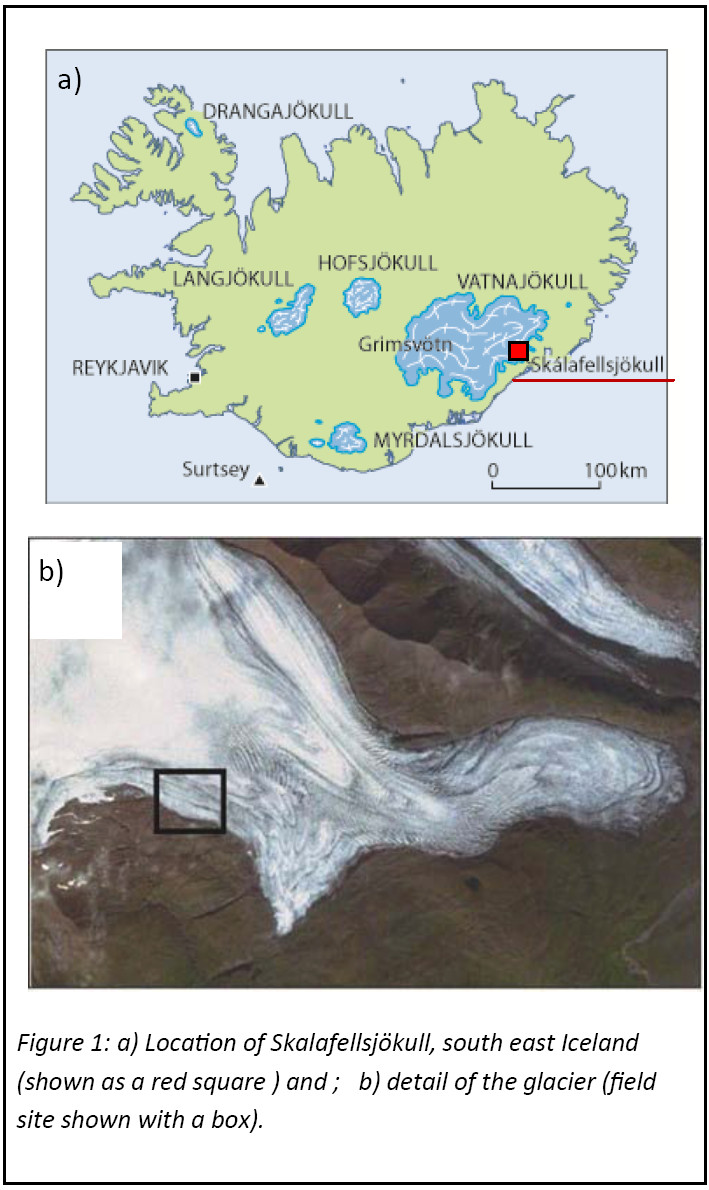
The study was undertaken at Skalafellsjökull, Iceland (Figure 1). This is an outlet glacier of the Vatnajökull icecap resting on Upper Tertiary grey basalts with intercalated sediments (Jóhannesson and Sæmundsson, 1998). This glacier is approximately 100km2 and 25km long (Sigurðsson, 1998). Our study site was located at 792m a.s.l. where the glacier was flat and crevasse free.
GPR
Survey procedure
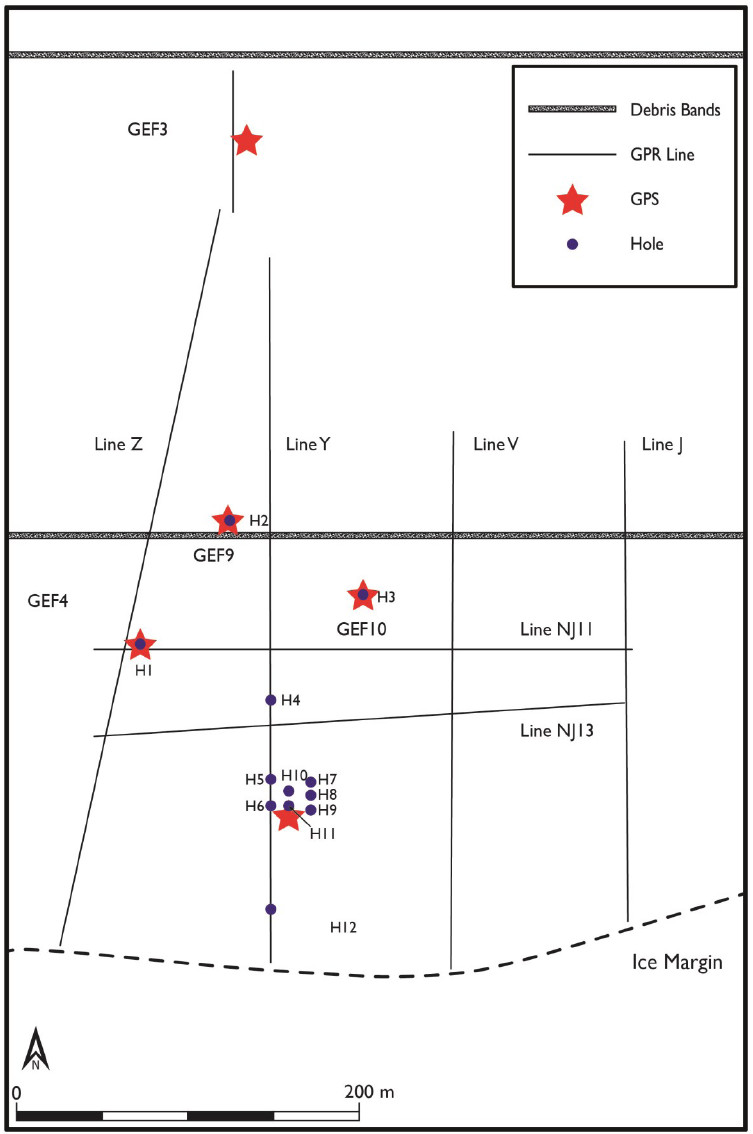
Ground penetrating radar (GPR) survey - The system used for the survey was a Sensors and Software Pulse Ekko 100 with a 1000V transmitter system. A common offset survey was performed using 50 MHz antennas on a grid pattern, with a 2m antenna spacing and 0.5 m sampling interval. A custom built sledge was constructed to hold the antennas at the correct distance apart and allow movement along the transect. The location of the transects were recorded using a Leica 1200 differential GPS. A total survey length of 2025m was undertaken (Figure 2). In addition a common midpoint survey (CMP) was also made using the 50 MHz antenna (for 120m along the central part of Line NJ113).
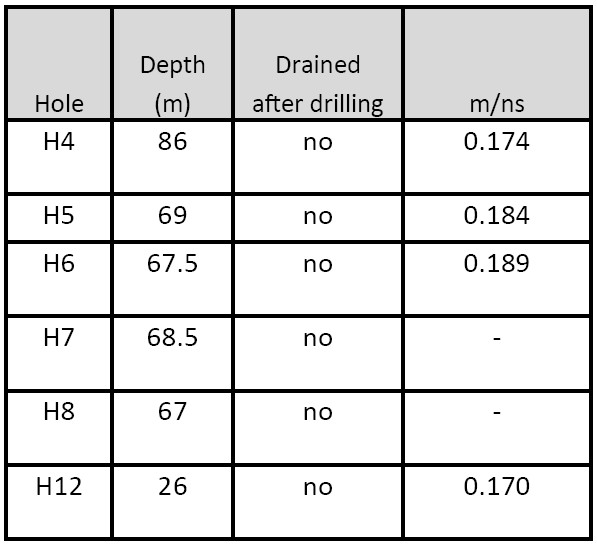
Boreholes were drilled with a Kärcher HDS1000DE hot water drill and videos were taken with a custom made CCD camera using infra-red (900nm) illumination. The depths of the boreholes were measured with the drill hose and camera cable (Table 1). All the holes remained water filled after drilling. Four wireless probes were inserted into the holes (two at the base 31 and 32, two in the ice 33 and 34). A wired probe to receive probe data was also inserted 20m down from the surface.
Processing and modelling
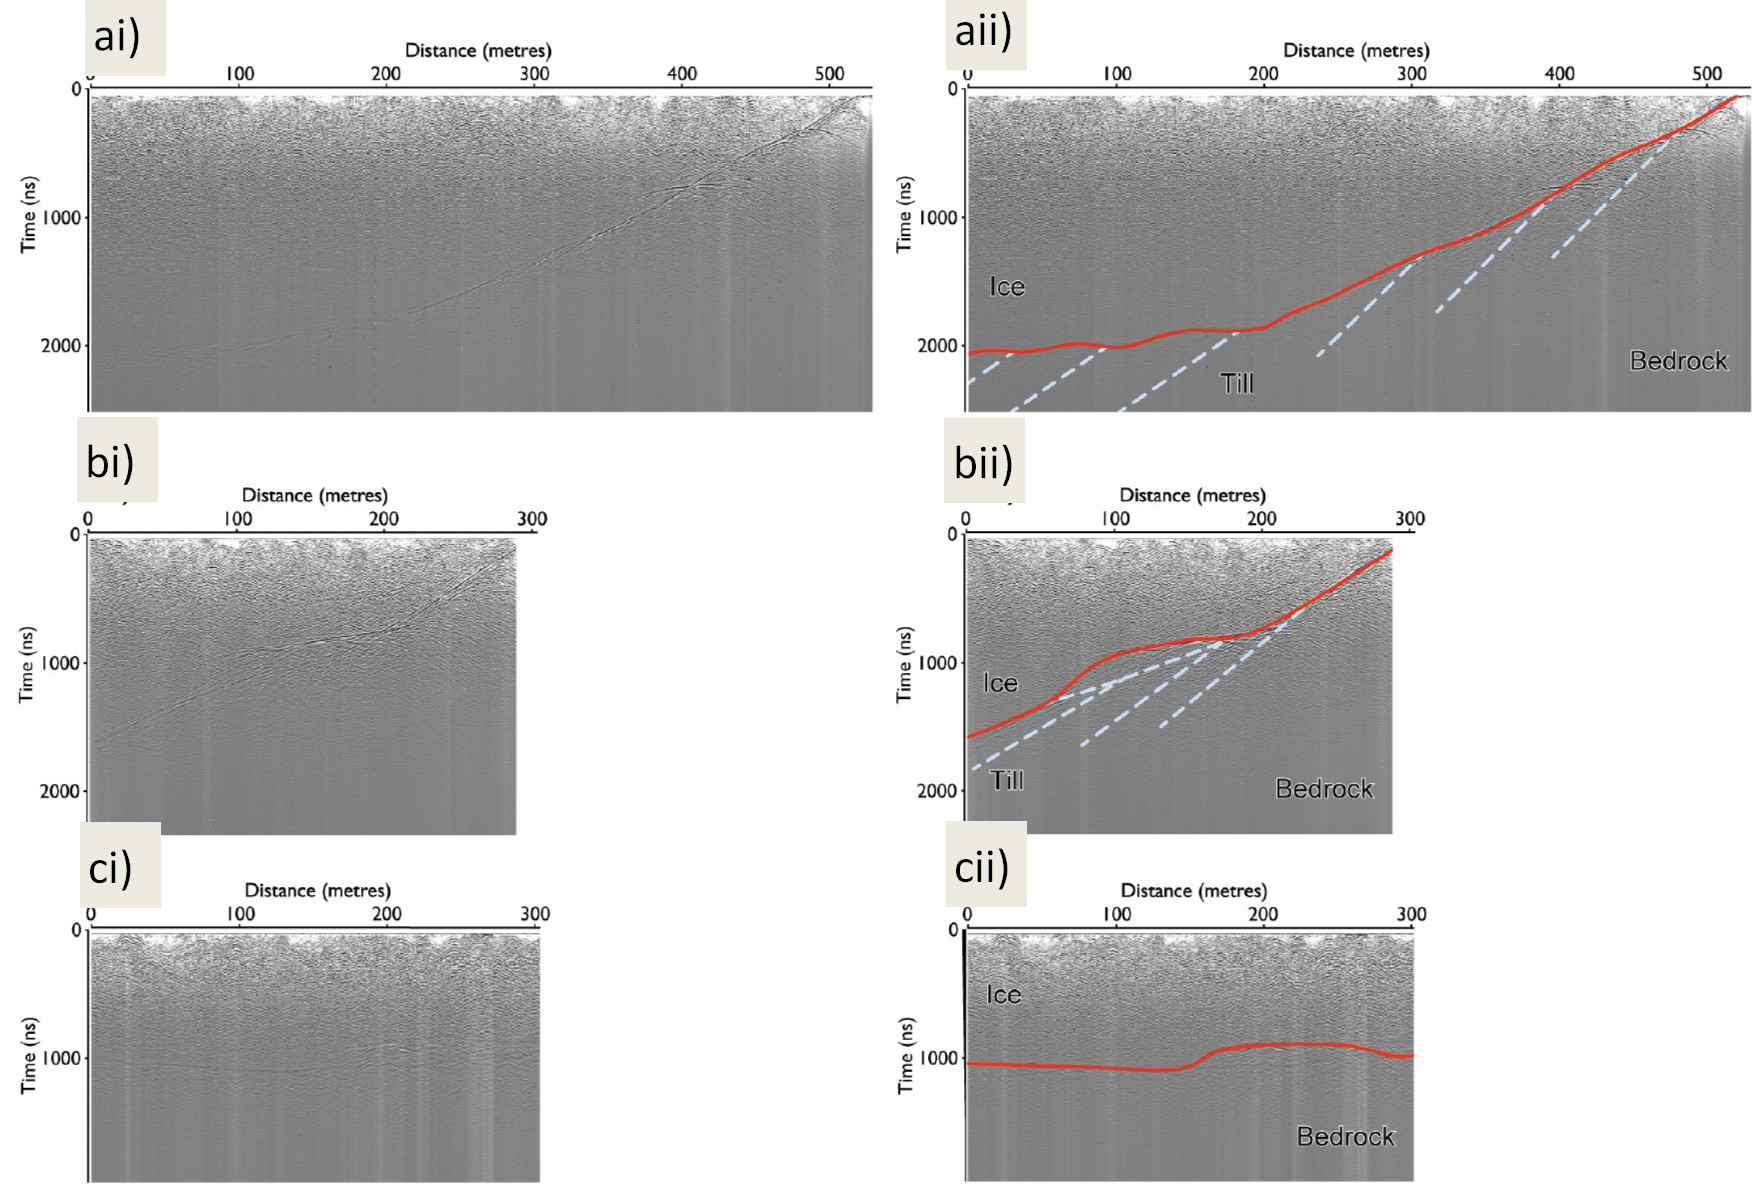
The data was analysed using the software package ReflexW. For the initial analysis of the common offset surveys, the following processes applied: the elimination of low frequency noise (de-wow filter), the application of a SEC (spreading and exponential compensation) gain to compensate for signal loss with depth (Figure 3).
The radar-wave velocity (v) in the whole ice column can be calculated from the measured glacier depths (d) and two-way travel time (t) where v = 2d/t. Once the radar-wave velocity was established we carried out a diffraction stack migration and a topographic correction could be applied to the data.
Unfortunately the CMP survey was carried out in a location that was subsequently found to have significant bed irregularity, and so did not provide an accurate estimate of radar velocity.
Interpretation to date
The radargrams from all four N/S transects show a very similar pattern with a clear glacier bed (Figure 3a-d). The average value for the radar-wave velocity through was 0.179m ns-1 (s.d.= 0.008) with an error of 4.7%. The relatively small standard deviation implies the boreholes were relatively straight and thus reflected the true ice depth.
Radargrams Z and Y show that beneath the glacier bed there are a series of strong reflections dipping to the west. These lines are present after the data has been migrated, and both before (shown in Figure 3) and after topographic correction. In radargrams V and J there is a more complex basal pattern.
We interpret the strong line as the bedrock (Figure 3) which can be observed in the field at the glacier margin, and the material beneath to represent till. At lines Z and Y the slope south of the glacier is mantled by a series of small moraines, and has an average slope angle of 30°. In contrast the slope to the south of lines V and J is bedrock, with a steep slope of 45°.
The E/W radargrams are shown in Figure 3e and f. These also show an irregular bed. By combining both sets of radargrams we interpret a three dimensional rise beneath the glacier approximately 100m wide and 150m long. This appears to comprise two till slices which cross cut the lower slices.
We can estimate radar-wave velocity through different materials using the method of Macheret et al. (1993) and Macheret and Glazovsky (2000) based on Looyenga (1965), by assuming a permittivity of basalt debris of 8.5 (Martinez and Byrnes, 2001; Olhoeft, 1989). This results in a radar-wave velocity of dry till or bedrock to be 0.101m ns-1 and saturated till (>20% water) to be 0.08m ns-1, which is similar to that found for till by other researchers (Murray et al., 1997).
Preliminary findings
The radar-wave velocity (0.179m ns-1) was slightly higher than that found in 2011 (0.174m ns-1) and 2008 (0.177m ns-1) (Hart and Martinez, 2009; Hart et al., 2012). All these results are high, as the normal value for temperate ice is approximately 0.16m ns-1 (Davis and Annan, 1989). This indicates a high proportion of voids within the glacier.
The GPR show three forms of subglacial glaciotectonic structures summarised in Table 2:
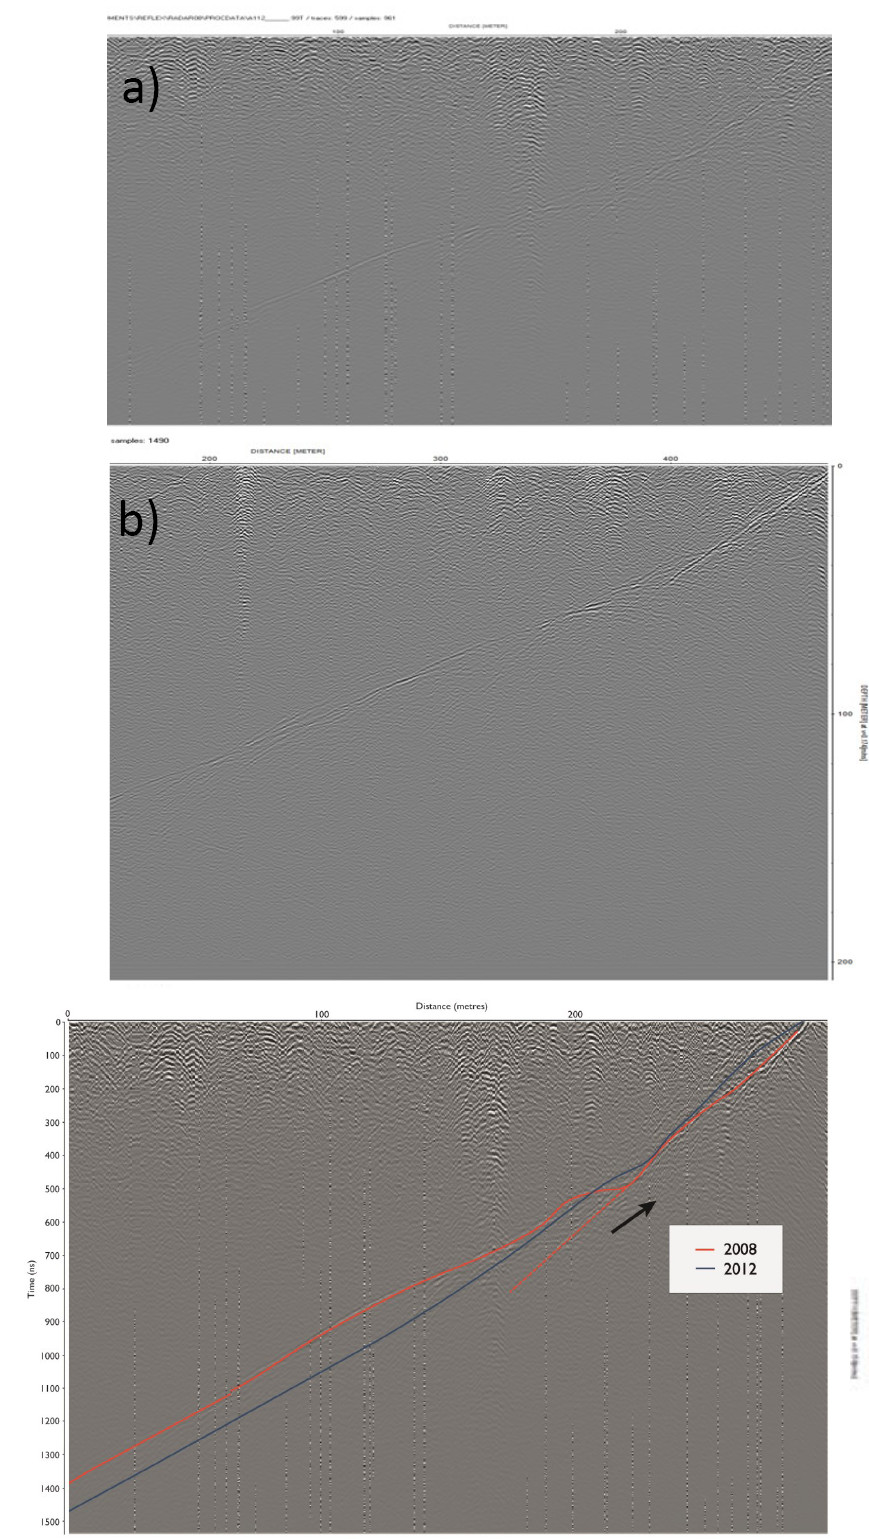
1) Within 300m of the glacier margin (in Line Z and Y), the subglacial till comprises a series of till ‘rafts’ with an average separation of 70ns Using the radar-wave velocities calculated above, the reflections have a mean separation of 3.5m for dry till, or 2.7m for saturated till (Figure 4a). These must reflect thrust sheets, and features of similar size and scale were observed in the foreland (Hart and Martinez, 2009).
Since the GPR lines were taken in a similar location it is possible to measure the displacement of the till rafts over a four year period. There was a total displacement of 12m, which is approximately 3m per year (Figure 5). This result was similar to that found between 2008 and 2011. This demonstrates the rate of active subglacial thrusting beneath the glacier.
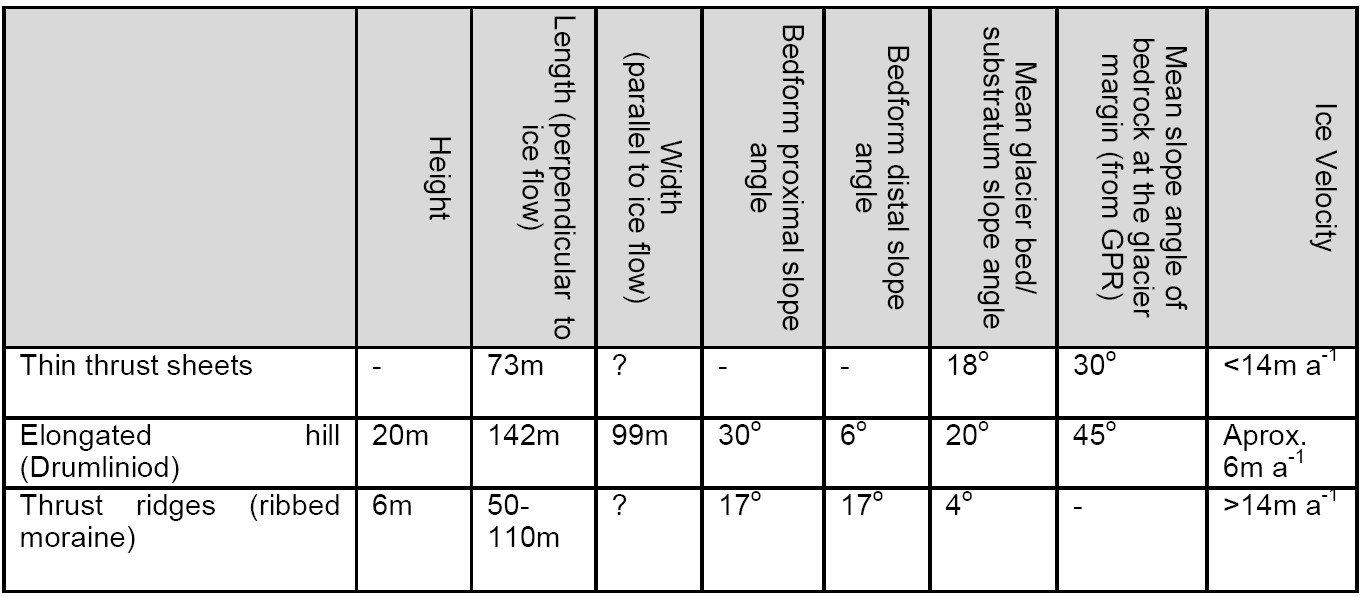
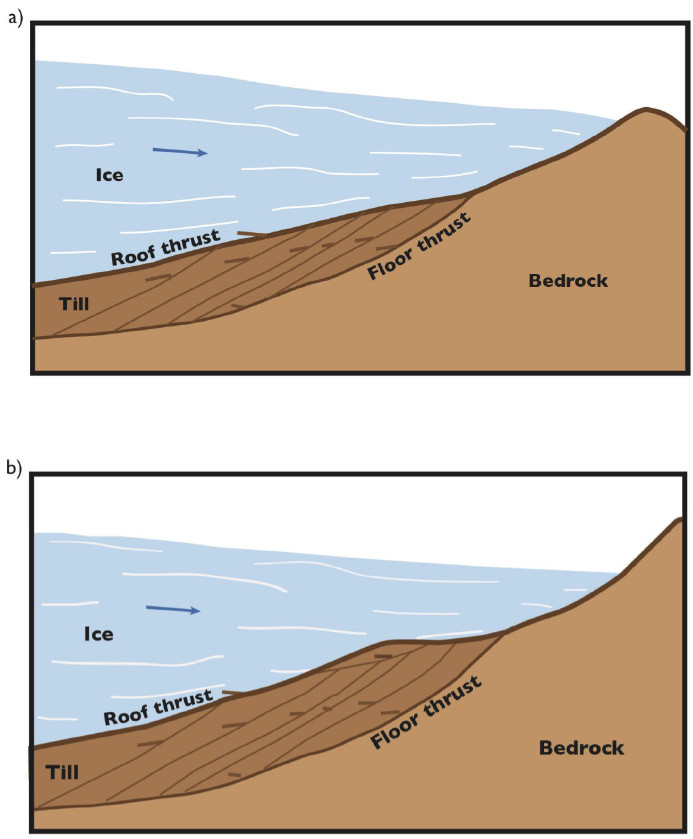
2) In Lines V and J there is an elongated shaped hill, oriented parallel with ice flow. comprising stacked thrust sheets, formed at the glacier margin where the bedrock slope was very steep; These features could be described as a streamlined subglacial hill (drumlin);
3) Towards the centre of the glacier, where the bedrock flattens out are a series of till ridges, perpendicular to the ice margin (also seen in 2011). These till bodies comprise till thrust sheets, and themselves are bounded by thrust sheets. We suggest the thrust ridges may be described as ribbed or Rogen moraine (Shaw, 1979; Hätterstrand and Kleman, 1999), and their scale is similar to other Quaternary features described in the literature (Dunlop and Clark, 2006; Finlayson and Bradwell, 2008).
The GPS survey
Survey Procedure
Four Leica 1200 dGPS units were installed on the ice on 2m pyramids (Figure 2), with a fixed base on the moraine. Their planned data collection schedule is shown in Table 3. The summer 2012 schedule went as planned, and the GPS were turned onto their winter schedule in late September, and some data was downloaded in October. Unfortunately a Leica software error meant that 2 of the units turned off on 9th December 2012, and due to the snow at the site it was not possible to manually re-install the new software (to allow the unit to continue recording) until July 2013. The other 2 continued to function until Jan 1st 2013.
Processing and Modelling
The GPS data has been processed using TRACK (v. 1.24), the kinematic software package developed by Massachusetts Institute of Technology (MIT) (https://www.unavco.org/, https://geoweb.mit.edu/~tah/track_example/) and the overall results are shown in Table 2. The overall processing strategy was to: 1) convert data to RINEX format; 2) process the local fixed base station (MORN) on the moraine against the IGS station at Hofn and export the processed MORN to RINEX format; 3) initially process GPS data against processed MORN using a basic parameter configuration in TRACK ; and 4) carry out more advanced TRACK processing (through trial and error) on those sites and days that require it (determined by analysis of the output generated by basic processing).
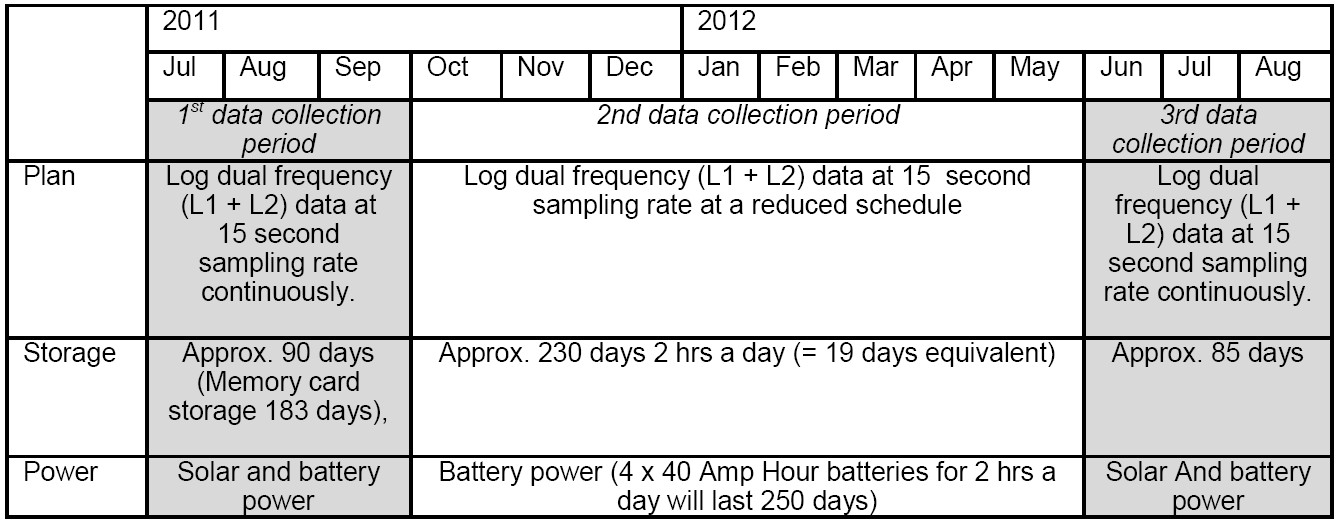
Overall, data processing has been successful; 87% of data have been reliably processed, with 69% of this being flagged as good and 18% being flagged as dubious. The GPS record down-glacier ice movement and can be used to establish sub-daily ice movement and velocity. Although some of the movement recorded by the GPS was associated with ice surface ablation and the resulting tilt of the tripods on which the antennas are mounted, the calculated melt over August 2012 from the GPS was the same as that measured in the field (0.05m per day), so errors were small.
Interpretation to date
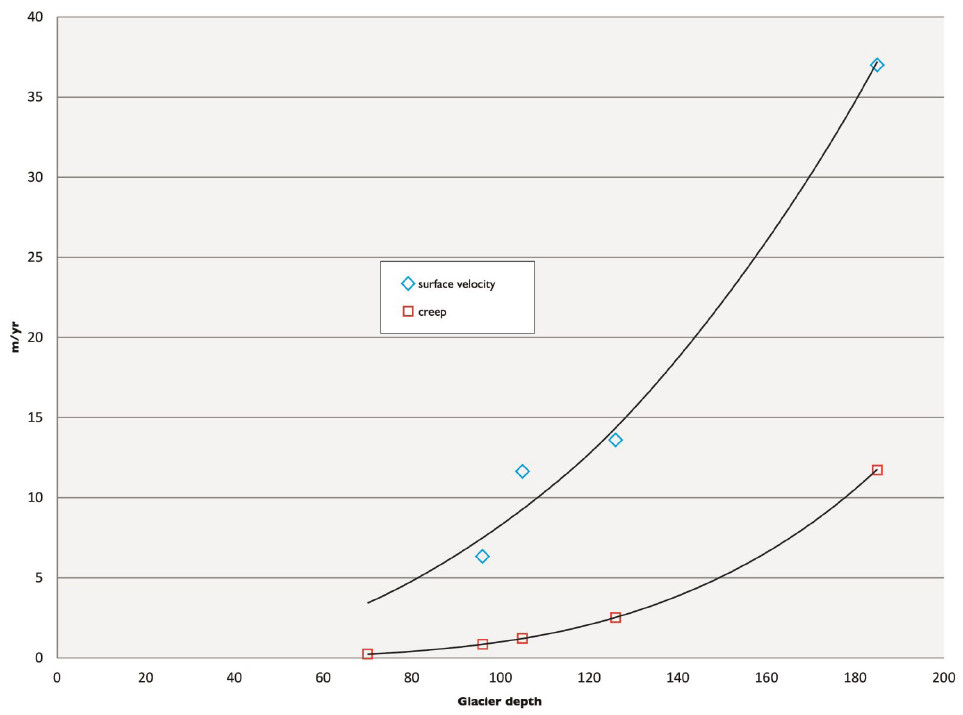
i) Ice flow — Ice is flowing towards the south west. It is fastest closest to the centre of the glacier and slowest towards the margin. There is a positive relationship between glacier velocity and ice depth (r2= 0.98) (Figure 6). Glacier velocity comprises creep, sliding and bed deformation. It is possible to estimate the internal deformation creep (Uc ) from the following (Nye, 1952; Paterson, 1994):
Where A is flow parameter, h is glacier thickness, n is 3 and the slope angle (α) is 3° (Figure 7). Duval (1977) showed the effect of water content (W) on A as follows:
Water content has been calculated for the main glacier and the basal debris-rich basal ice to be 0- 0.6% and 2% respectively (Hart et al, submitted). The difference between the surface velocity, creep and subglacial deformation gives an indication of basal sliding (Hodge, 1974). Assuming the subglacial deformation to be 3m, basal sliding ranges from approximately 28m/a at GEF 3 to 3m/a at GEF10.
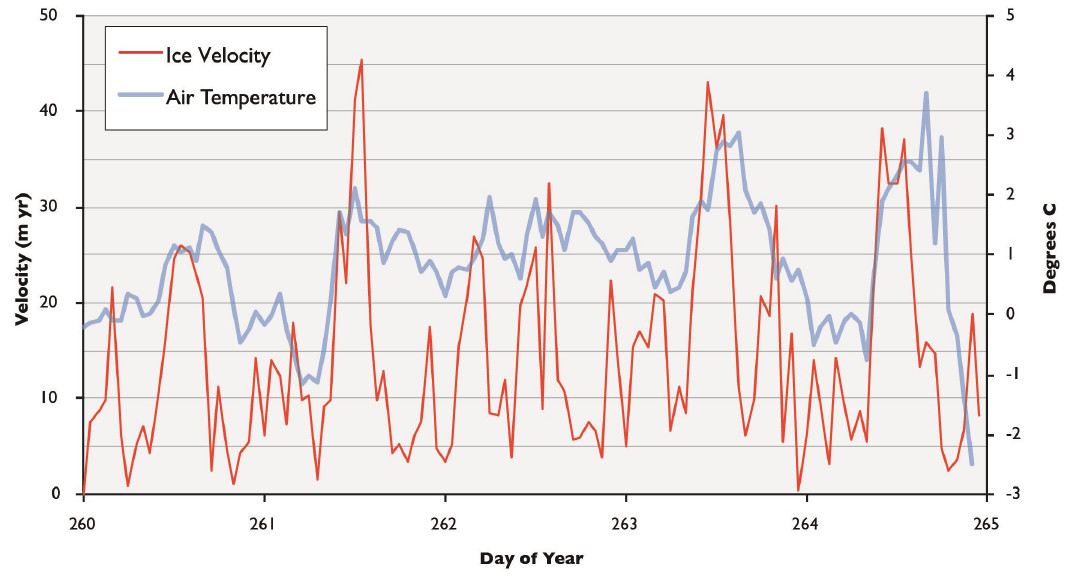
ii) Diurnal and longer term velocity changes — Ice velocities generally follow the pattern of air temperature throughout the day (Figure 7). There is a very strong peak towards mid-day with low velocities at night. However the velocity peak generally occurs 2-4 hours before maximum daily temperatures.
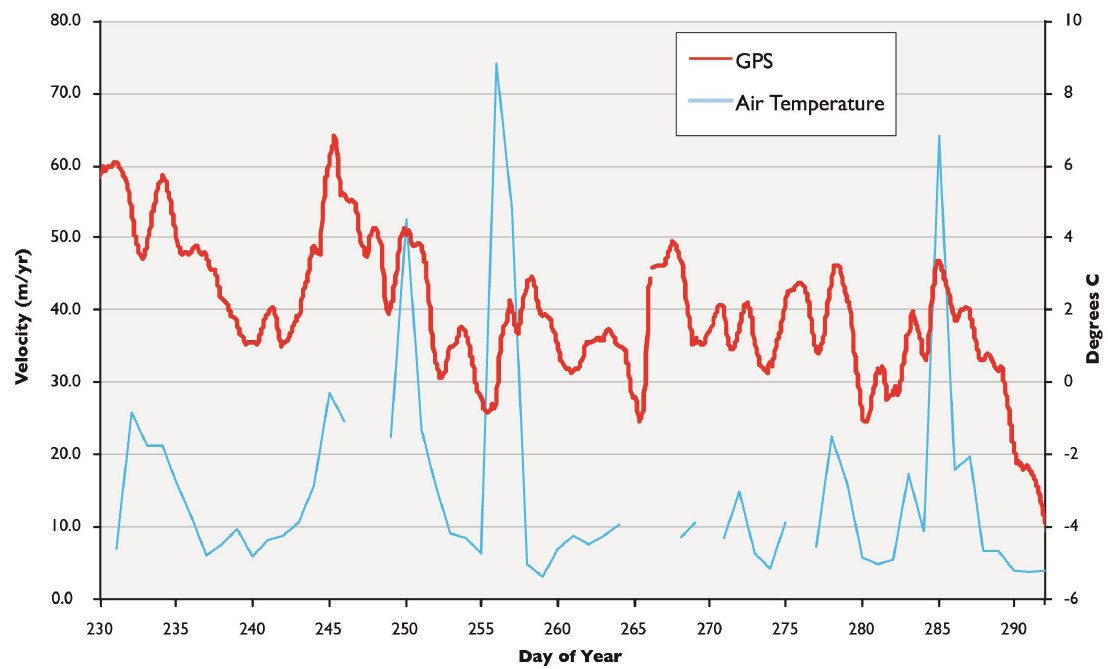
There is also a very strong relationship between ice velocity and high air temperatures (Figure 8). On warm days such as 245, 250, 278 and 285, there are high glacier velocities. Also when temperatures rise after going below zero, such as day 256.

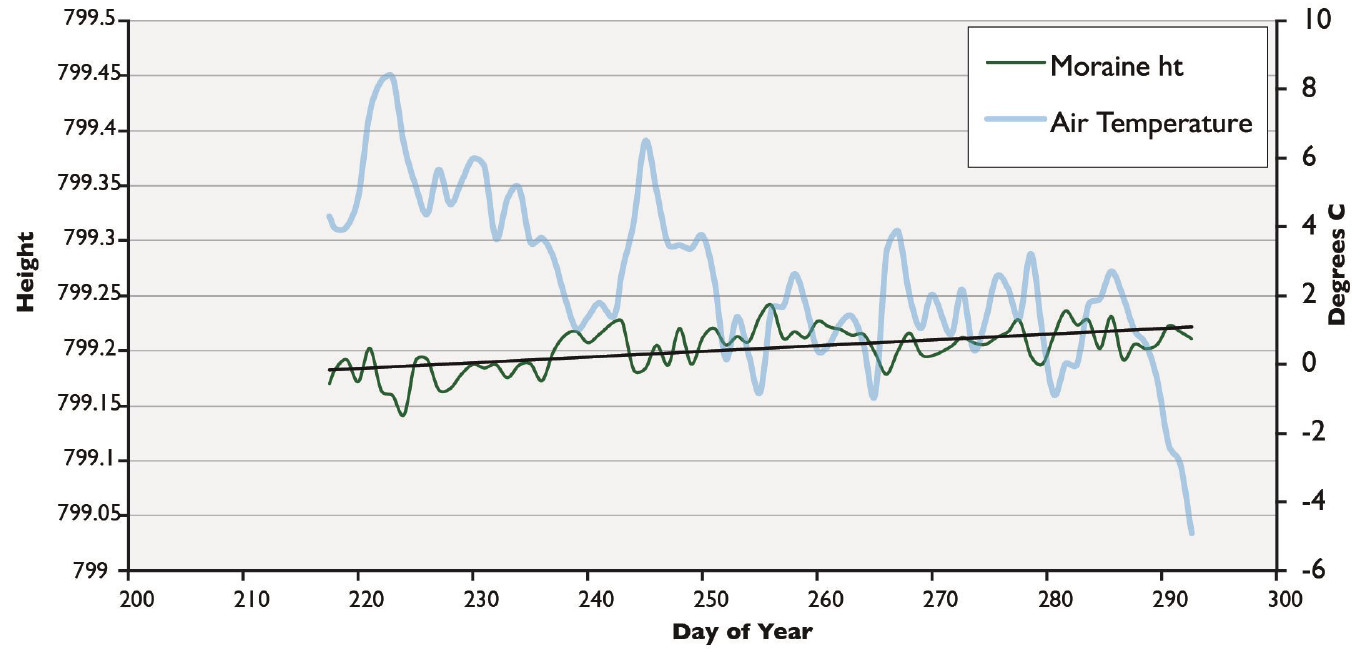
iii) Movement of the moraine — It was clear after analysis that the fixed base station on the glacier was moving (at the mm-cm level) on a daily basis. This did not affect the overall GPS analysis, as they were also referenced against the IGS Hofn station. However, it provided some additional information about the movement of the moraine (Figure 9). There is a slow increase in moraine height over the 75 day period (0.04 m). It can be seen that there is an inverse relationship between warmer days and moraine height movement.
Preliminary findings
The relationship between warm weather and increased velocity is due to meltwater controls of glacier sliding (Willis 1995; Fountain and Walder 1998). Diurnal variations in glacier velocity have been observed at a number of glaciers (Iken and Bindschadler, 1986; Nienow et al, 2005). Often the maximum velocity occurs when meltwater discharges are rising (rather than the peak) (Iken, 1981). Fischer and Clarke (1997) argued that as water pressure rises, strain in the ice is released resulting in enhanced sliding (slip). Nienow et al., (2005) suggest there are diurnal excursions of meltwater away from subglacial channels and associated rises in water pressure result in bed separation (slip).
During warmer days, associated with increased melt water, there are increased ice velocities and moraine height change. The initial increase in meltwater allows enhanced basal sliding (due to basal drag reduction) (Fischer and Clark, 1997), by bed separation. Once the strain release has occurred further meltwater inputs do not directly affect the system, hence the peak in sliding is usually before the peak in temperature (water generation). The summer subglacial drainage system is efficient, well connected and spatially extensive in response to changes in external temperatures and meltwater inputs (Willis, 1995; Fountain and Walder, 1998).This enables water to pass rapidly to glacier bed, which promotes enhanced basal sliding (Fischer and Clarke, 1997; Iken and Bindschadler 1986), and so these days are dominated by bed decoupling. During cooler days, there were lower ice velocities and greater change in moraine height. We suggest during these days glacier behaviour is dominated by the glacier being coupled to its bed. During this time both subglacial deformation at the ice/till interface and subglacial shearing must occur.
Conclusion
The GPR indicated a high radar velocity indicative of high air content within the glacier. Three styles of glaciotectonic structures were identified, including a series of till thrust sheets; a stacked asymmetric hill (drumliniod), where the margin was very steep; and a series of symmetrical till ridges (ribbed moraine) where the glacier bed flattened. The initial dGPS showed relationship between velocity and depth, and the importance of sliding and deformation in controlling glacier behaviour. There was evidence for stick-slip behaviour (with meltwater generation leading to bed separation), and a distinct difference between high temperatures days associated with decoupling, and cooler days associated with deformation, associated with the glaciotectonic deformation described above.
Acknowledgements
The authors would like to thank the Glacsweb Iceland 2012 team for help with data collection (Dr Dirk de Jager, Dr Richard Waller, Dr Kathryn Rose, Alex Clayton, Philip Basford, Jeff Gough, Sarah Stock). Thanks also go Mark Dover for figure preparation. This research was funded by Leverhulme.
References
Davis, J.L. and Annan, A.P. (1989). Ground penetrating radar for high resolution mapping of soil and rock stratigraphy. Geophysical Prospecting, 37, 531-551.
Duval, P. (1977). The role of water content on the creep rate of polycrystalline ice. IAHS, 118, 29-33.
Dunlop P., Clark C.D. (2006) The morphological characteristics of ribbed moraine Quaternary Science Reviews, 25 (13-14), 1668-1691.
Finlayson, A.G., Bradwell, T. (2008). Morphological characteristics and glaciological significance of Rogen moraine in Northern Scotland. Geomorphology, 101: 607-617.
Fischer, U. H. and Clarke, G. K. C. (2001). Review of subglacial hydro-mechanical coupling: Trapridge Glacier, Yukon Territory, Canada. Quaternary International, 86, 29-44.
Fountain, A.G., and Walder, J.S. (1998). Water flow through temperate glaciers. Reviews of Geophysics, 36 (3), 299-328.
Hart, J. K. and Martinez, K. (2009). A GPR investigation of Skalafellsjökull, Iceland. NERC GEF report, 6pp.
Hart, J. K. and Martinez, K. (2012). Investigating glacier stick-slip motion using a wireless Sensor Network. NERC GEF report, 10pp.
Hart, J. K, Rose, K. C., Clayton, A., Martinez, K. (submitted). Investigations to characterise the nature of englacial and subglacial water flow at Skalafellsjökull, Iceland. Earth Surface Processes and Landforms.
Hättestrand, C. and Kleman, J. (1999). Ribbed Moraine formation. Quaternary Science Reviews, 18, 43-61.
Hodge, S. M (1974). Variations in the sliding of a temperate glacier. Journal of Glacialogy, 13, 349-69.
Iken A (1981) The effect of the subglacial water pressure on the sliding velocity of a glacier in an idealized numerical model. J. Glaciol., 27 (97), 407–422.
Iken, A., Bindschadler, R.A. (1986). Combined measurements of subglacial water pressure and surface velocity Findelengletscher, Switzerland: conclusions about drainage system and sliding mechanism. Journal of Glaciology, 32, 101–119.
Jóhannesson, H. and Sæmundsson, K. (1998). Geological Map of Iceland, 1:500 000: Bedrock Geology, Icelandic Institute of Natural History.
Macheret, Y.Y., Moskalevsky, M.Y. and Vasilenko, E. V. (1993). Velocity of radio waves in glaciers as an indicator of their hydrothermal state, structure and regime. Journal of Glaciology, 39, 373–384.
Macheret, Y. Y. and A. F. Glazovsky (2000), Estimation of absolute water content in Spitsbergen glaciers from radar sounding data. Polar Research, 19, 205-216.
Martinez, A. and Byrnes, A.P.(2001). Modeling Dielectric-constant values of Geologic Materials: An Aid to Ground-Penetrating Radar Data Collection and Interpretation. Current Research in Earth Sciences, Bulletin 247, part 1.
Murray, T., Gooch D.and Stuart, G.W. (1997). Structures within the surge-front at Bakaninbreen, Svalbard using ground penetrating radar, Annals of Glaciology, 24, 122-129.
Nienow, P., Hubbard, B., Chandler, D., Mair, D., Sharp, M. & Willis, I. (2005). Hydrological controls on diurnal ice flow variability in valley glaciers. Journal of Geophysical Research. 110, F4
Nye, J. F. (1952). The mechanics of glacier flow. Journal of Glaciology, 2, 82-93.
Olhoeft, G. R. (1989), Electrical properties of rocks. In, Physical Properties of Rocks and Minerals, Y. S. Touloukian, W. R. Judd, and R. F. Roy (eds.), New York, New York, Hemisphere Publishing Corporation, 257–329.
Paterson, W.S.B. (1994). The Physics of Glaciers, Oxford Press, Butterworth-Heinemann, 4th Edition.
Sigurðsson, O. (1998). Glacier variations in Iceland 1930-1995. Jökull, 45, 3-25.
Willis IC, Sharp MJ, Richards KS. 1990. Configuration of the drainage system of Midtdalsbreen, Norway, as indicated by dye-tracing experiments. Journal of Glaciology, 36(122), 89–101.
Publications submitted
Hart, J.K., Rose, K. C., Clayton, A., Martinez (submitted). Investigations to characterise the nature of englacial and subglacial water flow at Skalafellsjökull, Iceland. Earth Surface Processes and Landforms.
Hart, J.K., Rose, K. C., Clayton, A., Martinez (aubmitted). An investigation of active subglacial thrust glaciotectonics from Skalafellsjökull, Iceland. Quaternary Science Reviews.
Data Archive
The data is archived at www.glacsweb.org
