Scientific Report 959
This report is also available as a PDF document .
Abstract
The SCANLIPS 3D experiment deployed 20 ESP seismometers in northern central Norway and Sweden between June 2013 and September 2014 to investigate the cause of the high topography which dominates Norway and process of topographic uplift. 97% data recovery was achieved. Data quality showed the ESP instruments performed well in comparison to 3T instruments previously deployed in Scandinavia. Over 400 receiver functions were calculated from teleseismic events recorded across the array. Inverse modelling and h-κ stacking of these receiver functions show there is no linear crustal root supporting the present day high topography. A region of thick crust which correlates with a negative residual isostatic gravity anomaly appears to confirm that locally the crust is overcompensated. Comparisons between the surface geology and variations in crustal structure and Moho sharpness suggest that the Caledonian orogeny may have reworked the Proterozoic basement, removing a high velocity lower crustal layer.
Background
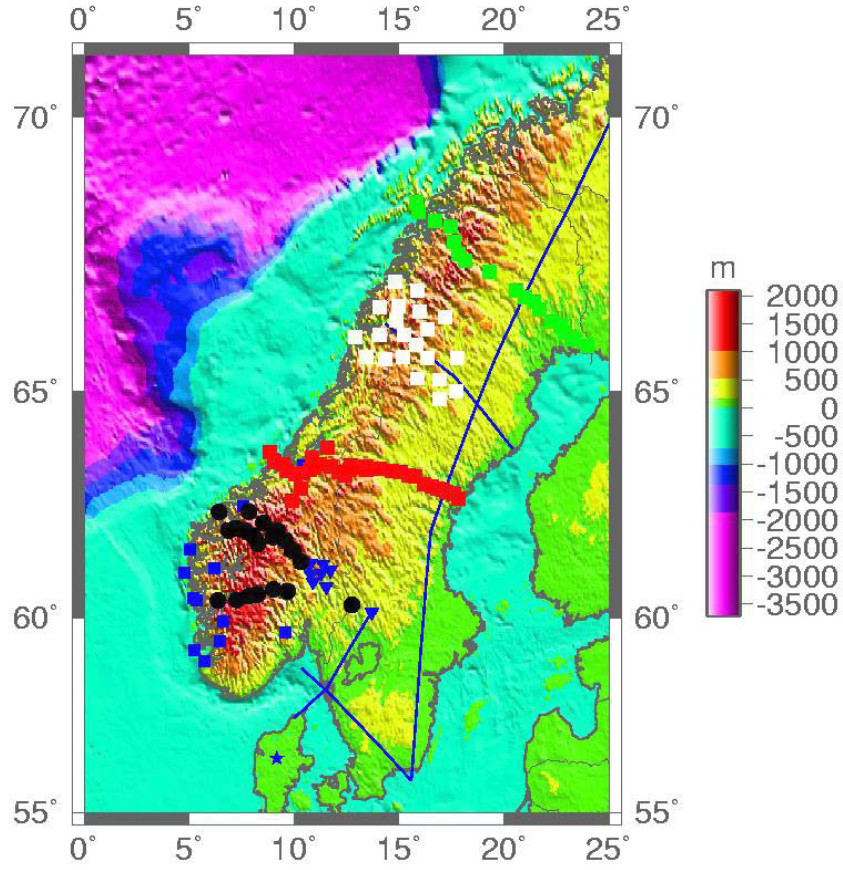
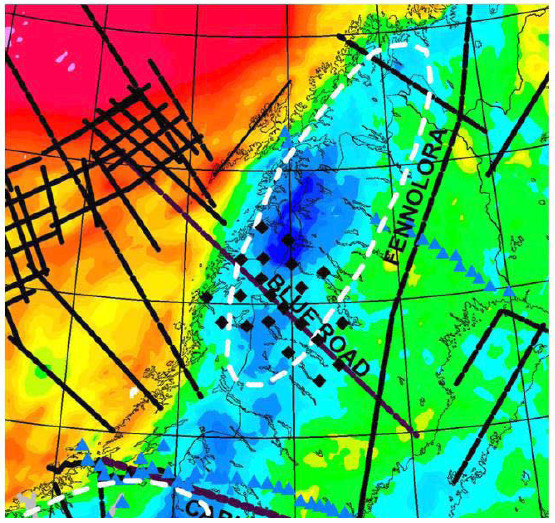
The SCANLIPS3D experiment builds on existing work conducted in Norway and Sweden (SCANLIPS and SCANLIPS2) to investigate the possible cause of the geologically recent (Miocene) uplift which has affected Scandinavia (Fig. 1). The Scandes mountains show high topography in the south (described by Svenningsen et al. 2007) relatively low topography in central Norway and Sweden (England and Ebbing 2012) and high topography in the North (Ebbing et al. 2012) which it is believed was created by the same regional uplift event. Because of the relatively short wavelength variations in topography, it is suspected that the variations in present day relief are likely to reflect variations in crustal structure. However, the crust shows relatively uniform seismic velocity structure along the length of the mountain range and there is no evidence of a significant buoyant root supporting the mountains. The SCANLIPS3D experiment focussed on an area in northern-central Norway where a prominent body of mid-proterozoic intrusive granitoids (The trans-Scandinavian Igneous Belt (TSIB)) crosses the mountain range, to further investigate the seismic structure in a location where there was a known prominent change in near surface geology, a significant residual isostatic gravity anomaly (Fig. 2) and a magnetic anomaly. In order to compare crustal structure cross the edges of the TSIB and the residual isostatic gravity anomaly the instruments were deployed in an array (Fig. 2).
Survey procedure
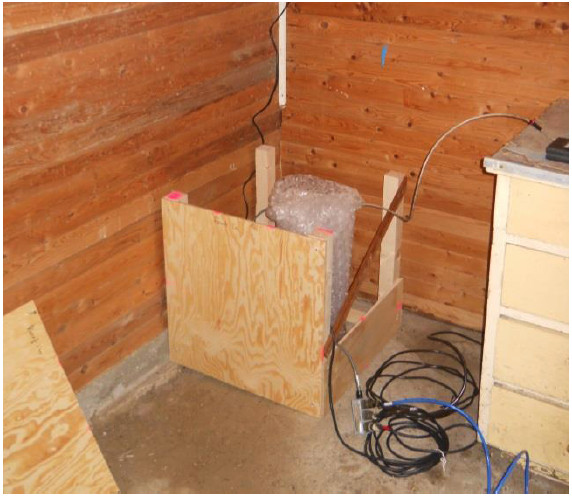
20 Guralp ESP (with 8 or 16 Gbytes of memory) 60 s period passive seismic instruments from the GEF were deployed in northern-central Norway in mid to late June 2013 and were recovered in early September 2014, providing 15 months of recording. The instruments were serviced in October 2013 and May 2014. Sites were chosen following a reconnaissance trip in 2012. The sites were chosen on the basis of proximity to bedrock, which despite the considerable topography was not always easy to find, particularly in Sweden where extensive glacial deposits cover most of the country and on the basis of minimal environmental noise. In order to ensure that the instruments ran over the winter of 2013-14 all instruments were deployed close to or inside buildings, usually barns or cellars, where mains electricity was available for charging batteries. Jomar Gellein, (Norwegian Geological Survey) whose help was invaluable in choosing the sites and deploying the instruments, designed and constructed protective wooden ‘boxes’ for the instruments. Instruments deployed inside cellars and barns were placed directly onto the floor of the building and then wrapped in bubble wrap insulation within the box to minimise noise induced by temperature variations (Fig. 3).
In the case of instruments deployed outside on bedrock an unglazed tile was cemented onto the bedrock. The instrument was then placed in a tube made from drain pipe which was then filled with dry sand for insulation. A large white bin was placed over the pipe. A wooden box, screwed to the bedrock and covered in silver reflective tarpaulin was then constructed over the bin (Fig. 4).

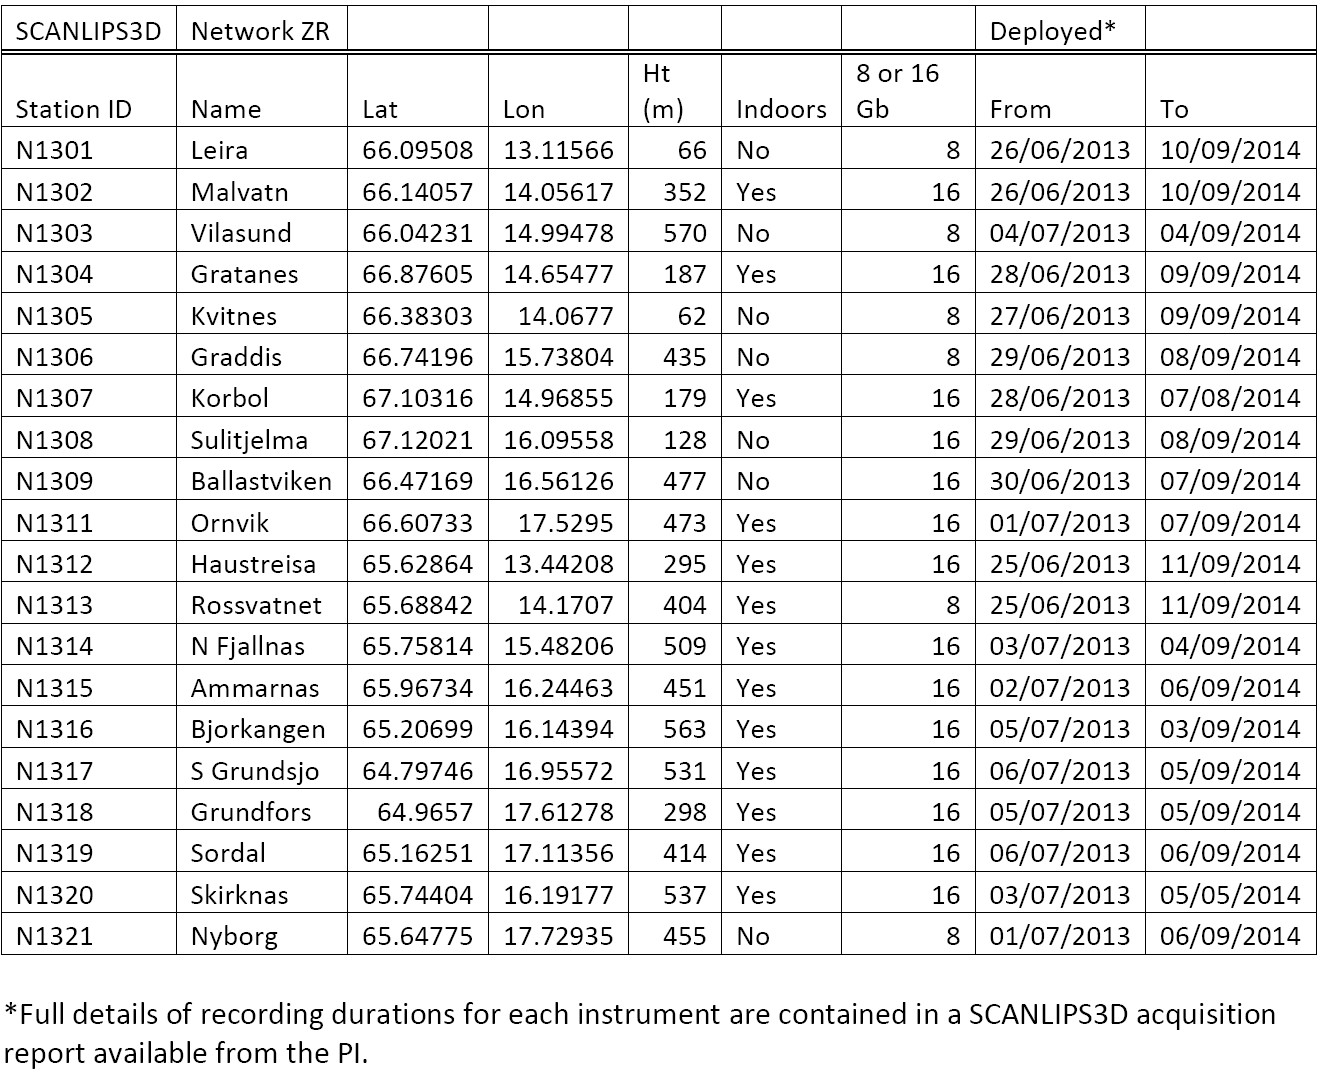
These sites proved to be very robust, provided good temperature insulation and were waterproof. The battery, mains charger, regulator and break-out box were left on the surface and covered with a box and sandbags. This was sufficient to keep the contents dry and working through the winter (Up to 2 m of snow cover and temperatures of -25 degrees). Each site took about 4 hours to fully install. Details of the instrument deployments with locations are provided in the attached summary (Appendix 1). Power to the instruments was supplied by 12V batteries (85 or 95 Ah) charged from the mains. Unfortunately, a few of the battery chargers, on their 5th year of deployment in Norway and/or Sweden, failed during the experiment. These were all replaced and the charge capacity of the batteries used ensured that data loss was minimised. One instrument was damaged during an electrical storm in July 2014 and had to be recovered unlocked. David Hawthorn (SEIS-UK staff) managed to recover the data from this instrument up to mid-July 2014 from the damaged memory board. It is estimated that data was recovered for 290 out of a possible 300 instrument months (97%). A longer period of recording would have been preferable but the potential for a delay in gaining access to sites at the end of the Scandinavian winter, particularly in Sweden, would have extended the experiment beyond the normal 24 month period of GEF loans. The instruments recorded with a sample rate of 100 Hz except for those with 8 Gb of memory which were adjusted to record at 50 Hz over the winter of 2013-14 to ensure that there was sufficient memory to continuously record at any potentially noisy sites.
Data quality
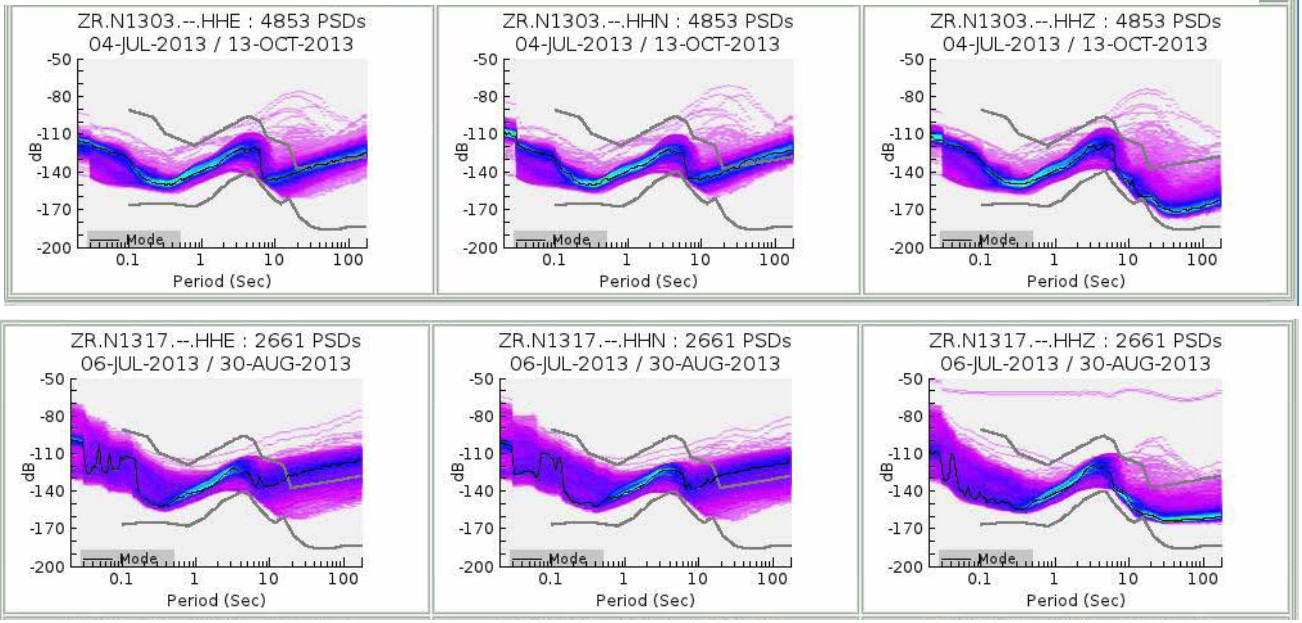
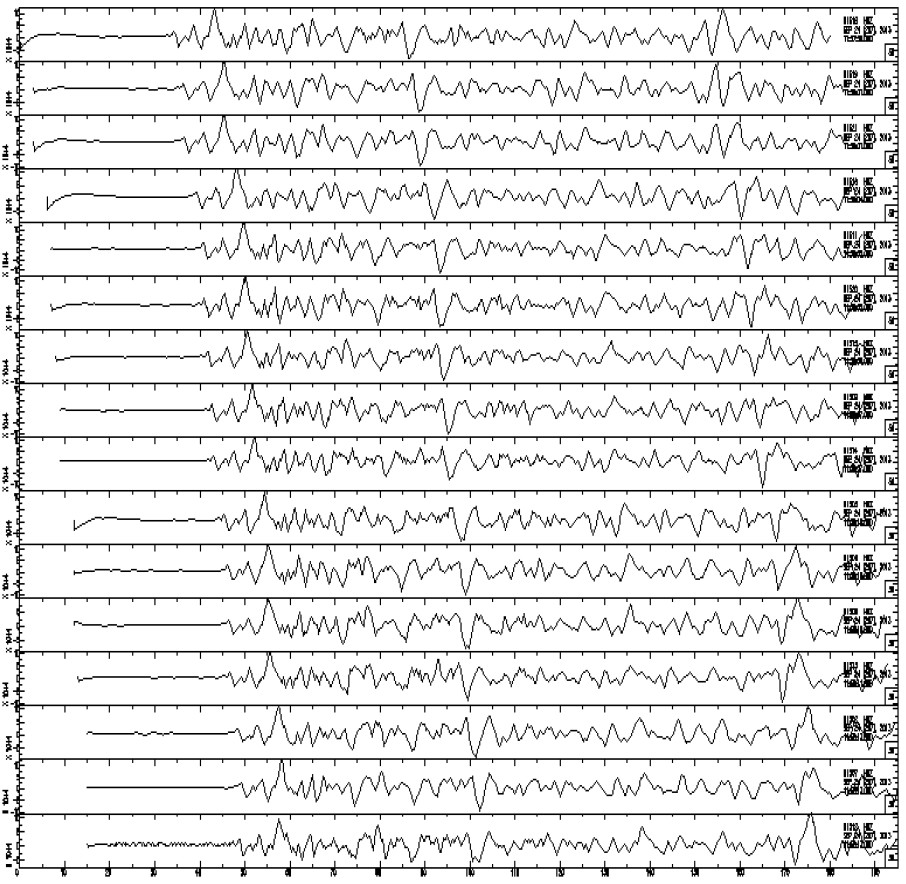
As noted above, the data recovery was excellent. Noise levels are shown on the attached plots (Fig. 5). As expected, from previous experience in Scandinavia, the instruments deployed outside directly on bedrock generally performed better than those inside barns and cellars where ground coupling was weaker (Fig. 5). Noise levels were comparable with the 3T instruments deployed during the SCANLIPS 2 experiment. In both experiments some of the instruments were deployed in similar locations / conditions which enabled a qualitative comparison of noise levels between the 3T data and the ESP data to be made. This suggests that the performance of the ESPs is comparable to the 3Ts in these conditions. The ambient noise levels for both these temporary deployments exceeds the internal noise floor for the instruments, consequently any advantages in noise performance of the 3T instruments are lost. It was concluded that, in most cases, a carefully deployed ESP offers as good a performance as a 3T for temporary deployments, when the extra band width of the 3T instruments is not required (3T 120 s period vs ESP 60s period). In general the data quality was consistently good across the seismic array, particularly for large magnitude events (Fig. 6).
Processing and Modelling
The data have been transcribed to miniSEED format and event data have been extracted for calculating receiver functions at each location. In addition, the SCANLIPS3D data have been supplemented by other data from permanent stations in Norway and Sweden and other temporary deployments to form continuous noise records for ambient noise tomography. This work has been conducted by Walid Ben Mansour as part of his research for a PhD at the University of Leicester. This report concentrates on the receiver function study conducted using the SCANLIPS3D data. A variety of methods were used to compute the receiver functions including the frequency domain water level deconvolution and iterative deconvolution methods to obtain the most reliable receiver functions. There were relatively few major events at appropriate distances (30 to 90 degrees) during the recording period which meant using events with magnitudes as low as Mb 5.5 and resulted in use of data with less than ideal signal to noise ratios. A total of 415 useable receiver functions were calculated across the 20 station array. Crustal thickness and average Vp values have been calculated from h-κ stacking for stacks of receiver functions at each seismic station. Moho sharpness was determined, based on the study of Youssof et al. (2013), and inverse modelling for the crustal velocity structure was undertaken using the code of Moorkamp et al. (2010).
Interpretation
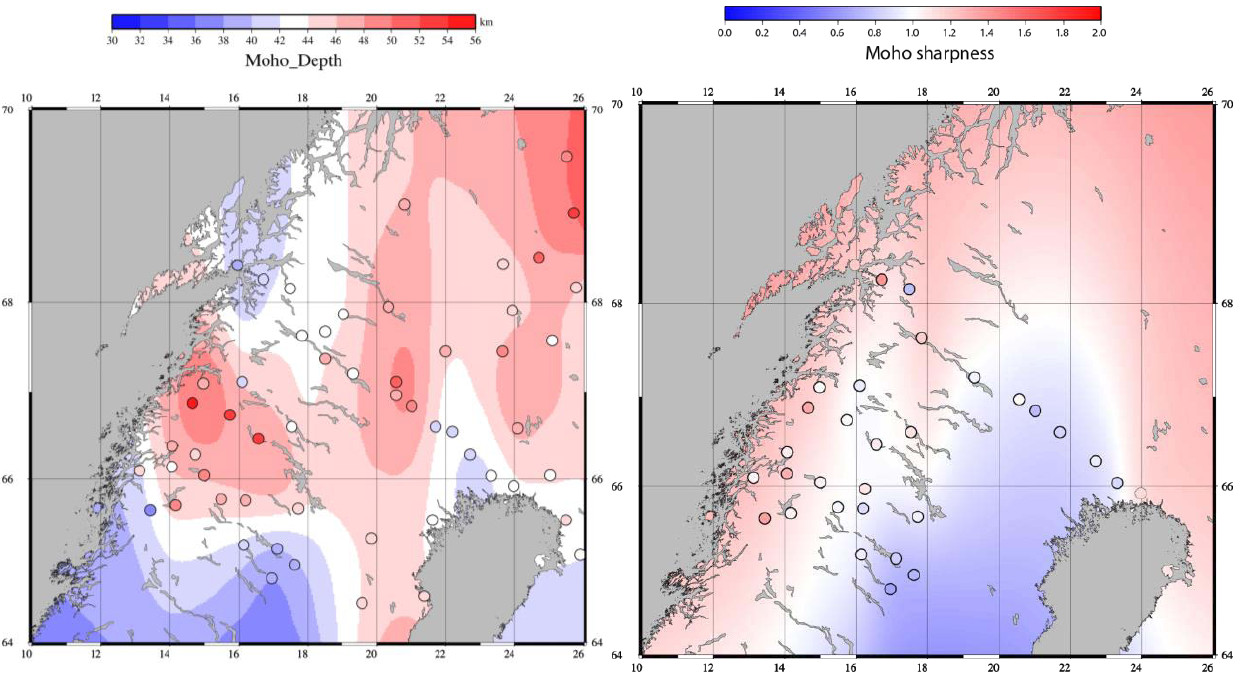
In comparison with the previous SCANLIPS experiments the array of instruments has revealed a more complex pattern of significant lateral variations in crustal structure. Inverse modelling and h-κ stacking of the receiver functions suggest that moving from East to West: crust between 40 to 46 km thick with a very high velocity (>7.2 km/s) lower crustal layer up to 10 km thick passes into a region beneath the current mountain range of crust of similar, or beneath the northern part of the array, of greater thickness (up to 52 km) (Fig. 7) but without the high velocity layer. The distribution of the thicker crust correlates well with the edge of the residual isostatic gravity anomaly (Fig.2), possibly confirming that a simple Airy isostatic model for the crust based on the topography in this area underestimates the true crustal thickness. The data also suggest that the crust does not thin as rapidly toward the coast as previously thought and that the main region of crustal thinning to form the Norwegian continental margin lies offshore.
The analysis of Moho sharpness reveals a diffuse or weakly defined Moho beneath the south-eastern side of the array and a more sharply defined Moho beneath the north-western part of the array (Fig. 7). These results are consistent with the presence of the high velocity lower crustal layer, identified by inverse modelling of the receiver functions and previous work (Ebbing et al. 2012 and England and Ebbing, 2012), which would reduce the velocity contrast at the Moho. The change in Moho sharpness may be related to reworking of the Proterozoic basement by the Caledonian orogenic deformation, either leading to loss of the lower crustal high velocity layer (which may have been the source rock for the Eclogites now found in places at the surface along the coast of Norway) or reworking of the layer into the crust during the orogeny.
Preliminary findings
The crust beneath northern-central Scandinavia shows considerable lateral variations in thickness and physical properties. A region of very thick crust corresponds to a negative residual isostatic gravity anomaly. Areas of exposed Proterozoic basement are underlain by crust with a high velocity lower layer. The region dominated by Caledonide deformation is characterised by thick crust without a high velocity lower crustal layer. These observations are consistent with the results of the previous SCANLIPS experiments but show that the properties of the crust show more spatial variation than was expected from the results of the 2D profiles created from the previous experiments.
Conclusion and recommendations
The SCANLIPS3D experiment involved deployment of an array of 20 seismometers, on loan from the GEF, across northern-central Scandinavia. The experiment was extremely successful in terms of the percentage recovery of data (97%) and the quality of the data. Further developments in site construction proved to be successful, which contributed to the high recovery of data. Qualitative comparison of data from the ESP instruments deployed in similar conditions to 3T data collected during the SCANLIPS2 experiment suggest that the performance of the ESP instruments is comparable. Analysis of receiver functions derived from teleseismic data recorded on the array of instruments has shown considerable lateral variations in crustal structure. High velocity crust beneath the Proterozoic basement rocks exposed in Sweden disappears beneath the Scandes mountain range. This is interpreted as the result of reworking of the crust during the Caledonian orogeny.
References
Ebbing, J., England, R., Lauritsen, T., Olsen, O., Stratford, W., and Weidle, C. 2012. Structure of the Scandes lithosphere from surface to depth. Tectonophysics, 536-537, 1-24. DOI: 10.1016/j.tecto.2012.02.016
England, R.W. & Ebbing, J., 2012. Crustal structure of central Norway and Sweden from integration of a teleseismic receiver function profile and modelling of the gravity anomaly. Geophysical Journal International. DOI: 10.1111/j.1365-246X.2012.05607.x
Moorkamp. M., Jones, A.G. & Fishwick, S. 2010. Joint inversion of receiver functions, surface wave dispersion and magnetotelluric data. Journal of Geophysical Research. Doi: 10.1029/2009JB006369
Svenningsen, L., Balling, N. Jacobsen, B.H., Kind, R., Wylegalla, K. & Schweitzer, J. 2007. Crustal root beneath the highlands of southern Norway resolved by teleseismic receiver functions. Geophys. J. Int., doi: 10.1111/j.1365-246X.2007.03402.x
Youssof, M., Thybo, H., Artemieva, I.M. & Levander, A. 2013. Moho depth and crustal composition of Southern Africa. Tectonophysics, 609, 267-287. Doi: 10.1016/j.tecto.2013.09.001
Data Archiving
The data are currently archived at the University of Leicester on the SEIS-UK system and the miniSEED volumes are ready for final archiving and public release through the IRIS datacentre from September 2017. The Network code is ZR. In addition the data are being shared with the Norwegian NeoNor experiment which is investigating the Neotectonics of Norway and with the Magnus 2 experiment which is currently recording at over 50 broadband stations across Norway, Sweden and Finland in order to build a regional tomographic model of the crust and lithosphere. The SCANLIPS3D data will also be released with the Magnus 2 data, via GFZ Potsdam at the end of the Magnus 2 experiment in mid-2019.
Publications arising from Loan 959
Ben Mansour, W., England, R.W., Moorkamp, M. & Fishwick, S. (in prep) Seismic imaging of the crust across the Northern Scandinavian mountains from analysis of teleseismic receiver functions. For submission to: Geophysical Journal International.
Conference presentations arising from Loan 959
Ben Mansour, W., England, R W., Moorkamp, M. Joint inversion of seismological data and magnetotelluric data for the Northern Scandinavian Mountains. AGU fall meeting – San Francisco, USA, December 2014.
England, R W., Ben Mansour, W., Ebbing, J., Moorkamp, M. Structure and evolution of the crust beneath the Scandinavian mountain belt from geophysical data. EGU Annual Meeting – Vienna, Austria, April 2015.
W Ben Mansour, England, R W, Moorkamp, M. Seismic study of the crust beneath the Northern Scandinavian Mountains from Receiver Function Analysis. EGU Annual Meeting – Vienna, Austria, April 2015.
England, R. W. The Moho in and around Europe – Rolf Meissner memorial meeting – Kiel, Germany, June 2015.
Appendix 1
