Scientific Report 956
This report is also available as a PDF document .
Abstract
SEIS-‐UK provided a loan of 13 broadband seismic systems (10 x CMGESP and 3 x 6TDs), for deployment in a network of approximately 150km x 200km in the northern portions of the Afar depression. Instruments were kept in the Afar depression from February 2012 to January 2013. These systems recorded continuously at 50Hz with relatively minor data losses due to equipment problems. Background seismicity has been analysed in northernmost Afar for the period February 2012 to January 2013. Results show both the border faults and axial fauls in the Danakil depression are active and the seismogenic thickness is very shallow at around 6 km. Teleseismic data is being used to constrain lithosphere and asthenosphere structure beneath Afar, the Red Sea, Gulf of Aden and Yemen using surface-‐wave tomography. Results show segmented low velocity zones beneath the ocean ridges suggested segmented upwelling and partial melting of asthenosphere.
Background
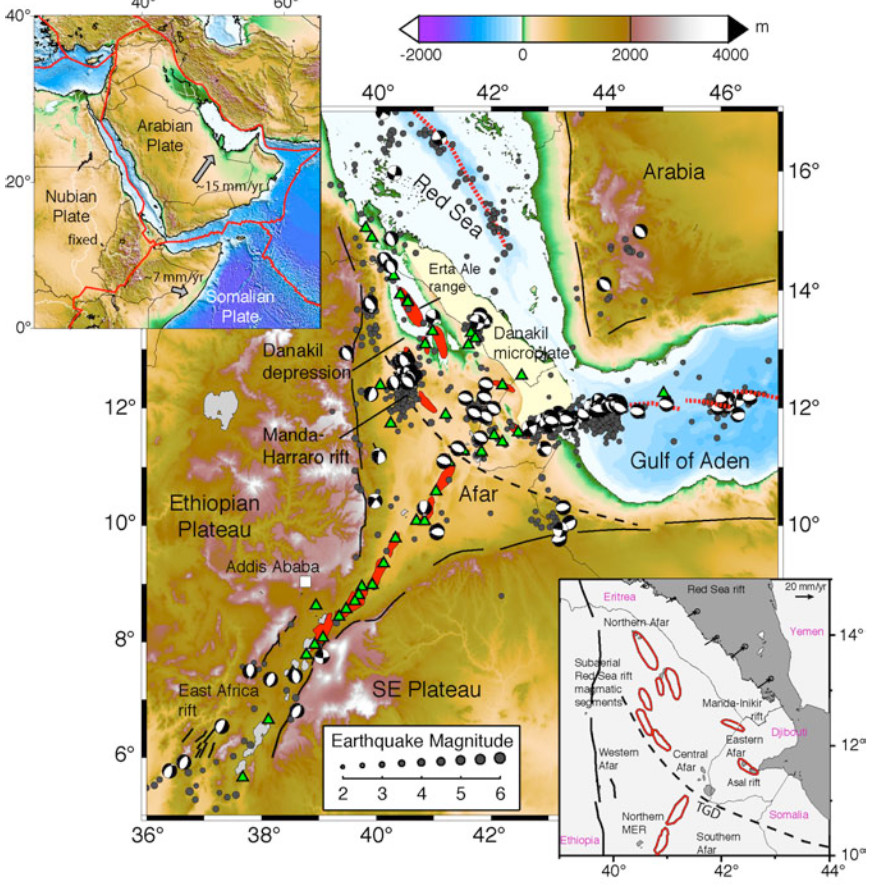
The Afar Depression (Figure 1) marks the intersection of the southern Red Sea rift (RSR), the Gulf of Aden rift (GOA) and the Main Ethiopian Rift (MER), forming an archetypal rift-‐rift-‐rift triple junction (e.g. McKenzie et al., 1972). The Afar rifts are the most mature part of the continental East-‐Africa Rift system and hosts the on-‐shore extension of the Red Sea and Gulf of Aden oceanic spreading (e.g. McKenzie et al., 1972). They are the only place on the planet where the transition from late-‐stage continental rifting to oceanic seafloor spreading is occurring subaerially today, and it is occurring above anomalously hot mantle (Bastow and Keir, 2011). Recent active rifting and dike injection has focused scientific attention on this area (Ebinger et al., 2010). In September 2005, a 60km long segment of the Dabbahu-‐Manda-‐Hararo (DMH) rift segment opened in two weeks (Wright et al., 2006), and geodetic and seismic monitoring, using data mainly from this experiment, have revealed 14 episodes of dike injection along this segment of the rift (e.g. Wright et al., 2006, Ayele et al., 2009, Hamling et al., 2009, Belachew et al., 2011). A primary objective of this study is to focus on understanding the magma plumbing system and fault kinematics In the Danakil depression and Erta Ale volcanic system. This portion of the rift is located north of the Dabbahu segment, with results anticipated to provide insights on along rift variations in character and kinematics of rifting.
Survey procedure
Prior to February 2012, 12 ESPD seismometers from loan 885 were initially localized during October 2009-‐January 2011 around the Dabbahu segment of the Afar rift with the primary objective of investigating the on-‐going seismcity associated with dyking. In February 2011, 7 of the seismometers were moved northward into the Danakil depression in order to record microseismicity in the northernmost basin of Afar. During the project 2 ESPD sensors failed, and were replaced in October 2011 by 3 x 6TD sensors. These 10 ESPDs and 3 6TDs were left in the Danakil depression until January 2013 and therefore form loan 956 results for which are reported here.
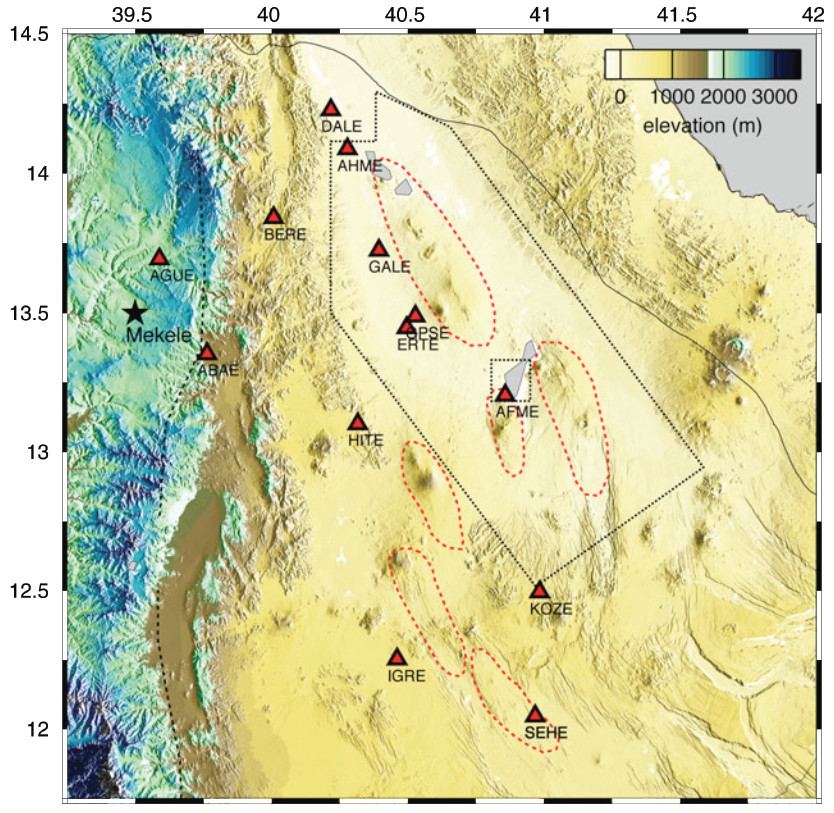
Help and collaboration from Addis Ababa University (in particular Dr Atalay Ayele), the National Regional Afar State government, the Federal Ethiopian Government and SEIS-‐UK employees was essential for the success of the project. Logistical procedures were already well-‐advanced following the 2005 NERC funded Urgency network and 2007-‐2009 Afar Consortium network in Afar. We located stations mainly in fenced compounds to maximize security. Care was taken to achieve a regular spacing of stations, but not at the expense of finding a secure location. Available locations were mainly limited to towns with a fenced government compounds (e.g., police stations, clinic, government offices). We could distribute the stations at regular intervals in the region, but were unable to access the eastern side of the Danakil depression due poor security conditions there. However our station distribution was adequate to achieve the scientific objectives (Figure 2).
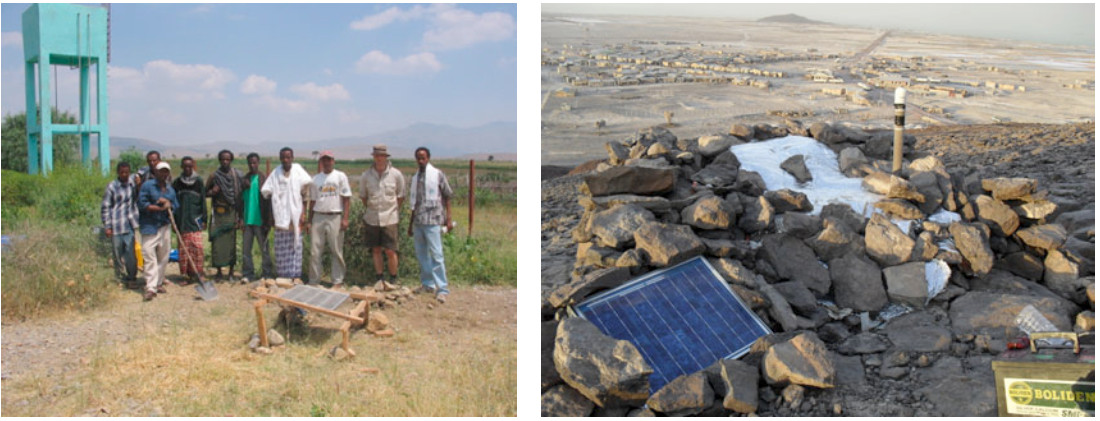
Most of the seismometers were deployed in a hole ~1-‐1.5m deep, ~0.7m in diameter. Seismometers were placed in a plastic bag and buried directly in the soil, with the sensor pits were protected from the heat using buried reflective sheets. A second hole close to the seismometer hole was dug, and a plastic bin placed inside. This was of a depth so that the bin was ~20cm above the surface. The battery, break out box, were placed in this box with all cables attached. Cables for the sensor and firewire led from this box to the seismometer hole. Cables for the GPS and solar panels led out of the box and connected with the solar panels and GPS antenna located nearby. All cables out of the box were fed through flexible plastic conduit and secured to posts or buried. The battery/cable box was then covered with insulation and plastic, and secured with tape. Before the box was secured the configuration of the sensors was checked using the palms for the ESP and 6TD. 3 seismic stations were deployed subaerially with the sensor deployed directly on bedrock and covered with a plastic bucket, then a cairn of fist sized rocks, and finally by several layers of reflective foil. For these subaerial deployments the battery and breakout box etc were placed in a bucket in a similar fashion for subsurface deployments except that the bucket was completely above the ground, and then protected by a cairn of stones and by reflective foil (figure 3).
All the GCF format data collected from the seismometers in the field has been converted to miniseed format and stored on the SEIS-‐UK computing system. In addition a dataless seed file with details regarding station names and corresponding instrument serial numbers, station locations, time periods of operation was also created on the SEIS-‐UK system. On completion of all the fieldwork the full set of collated miniseed files and finalized dataless seed volume was copied to the IRIS-‐Data Management Center.
Data quality
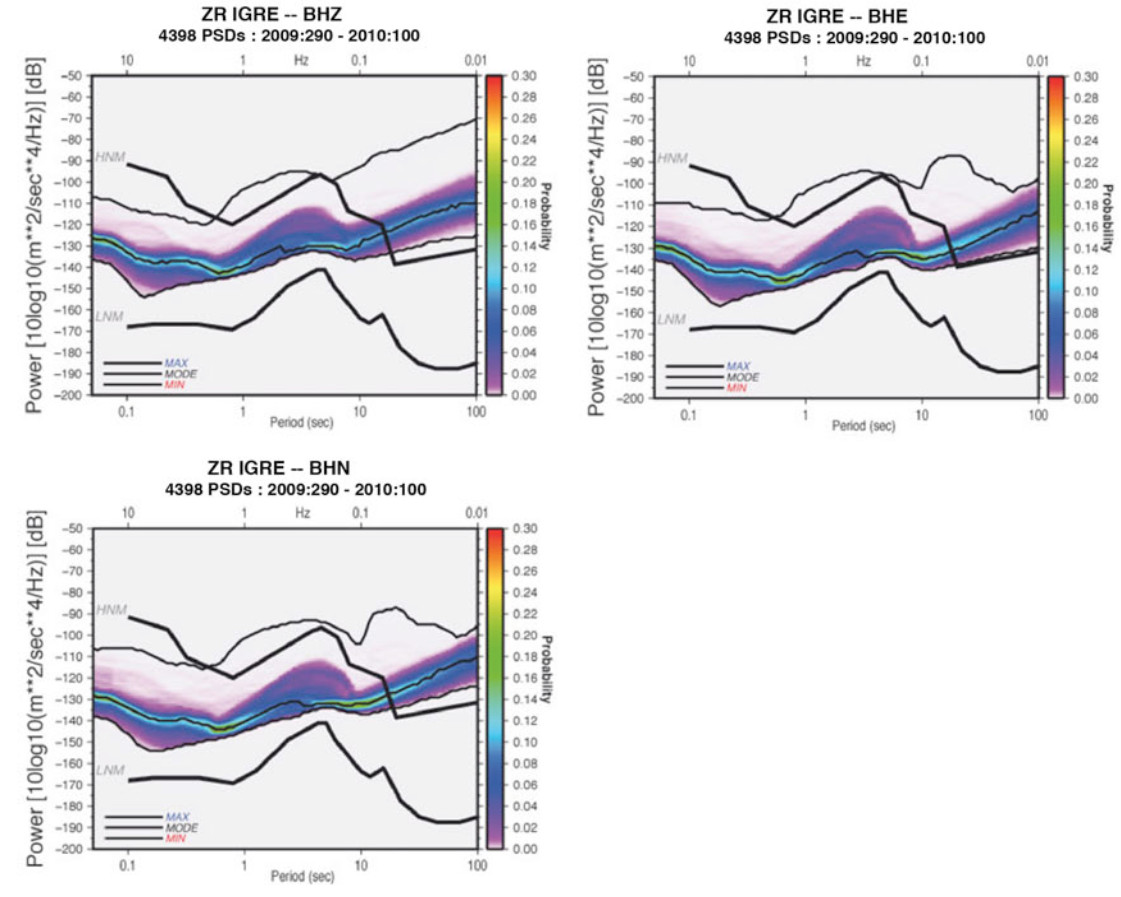
The ESPD and 6TD systems used in the study and were generally user friendly. The data were generally of good to excellent quality and of relatively low noise, especially during the night (figure 4). We encountered relatively few problems with the instruments. Instrumental problems were restricted to 1 of the ESP’s being unable to lock during station removal. In addition, one instrument suffered from a failed horizontal component for the duration of the project. We had a few stations temporarily stop working due to battery failure, though this was relatively uncommon since we regularly replaced the batteries due the harsh temperature conditions. One solar panel was stolen during the project.
Processing
Earthquake locations: Continuous seismic data for February 2012-‐January 2013 was initially loaded in 1-‐hour-‐long segments, and filtered using a bandpass filter of 1-‐10Hz. Data is manually inspected for earthquakes and arrival times of P-‐, and S-‐waves from earthquakes recorded at 3 or more seismic stations are measured. Provisional earthquake locations are computed using Hypo2000 for earthquakes including 4 or more P-‐ or S-‐phases using a simple 4-‐layer, 1-‐D velocity model for the Afar crust, defined using wide-‐angle seismic reflection and refraction data (Makris and Ginzburg, 1987). We use a linear increase in seismic velocities within each crustal layer, a technique designed to avoid artificial clustering of earthquakes at sharp discontinuities in velocity associated with using a stepped mode. Our resultant locations have average horizontal errors of < 500 m and errors in depth of < 2km.
Earthquake magnitude, energy release and moment tensor inversion: Local magnitudes (ML) of the earthquakes were computed from the maximum zero-‐to-‐peak amplitude measured on simulated horizontal component Wood-‐Anderson displacement seismograms after removal of instrument response [Richter, 1935]. These measurements are used in conjunction with hypocentral distances to estimate local magnitude (ML) using the distance correction applicable to the MER (Keir et al., 2006). These analyses also show that the magnitude of earthquakes ranges ML 0.4-‐4. Seismic moment release (Mo) is determined using the empirical relationship derived between ML and Mo by Hanks and Kanamori (1979]. Earthquake moment tensors were computed from full waveform inversion using the code of Ford et al. (2009).
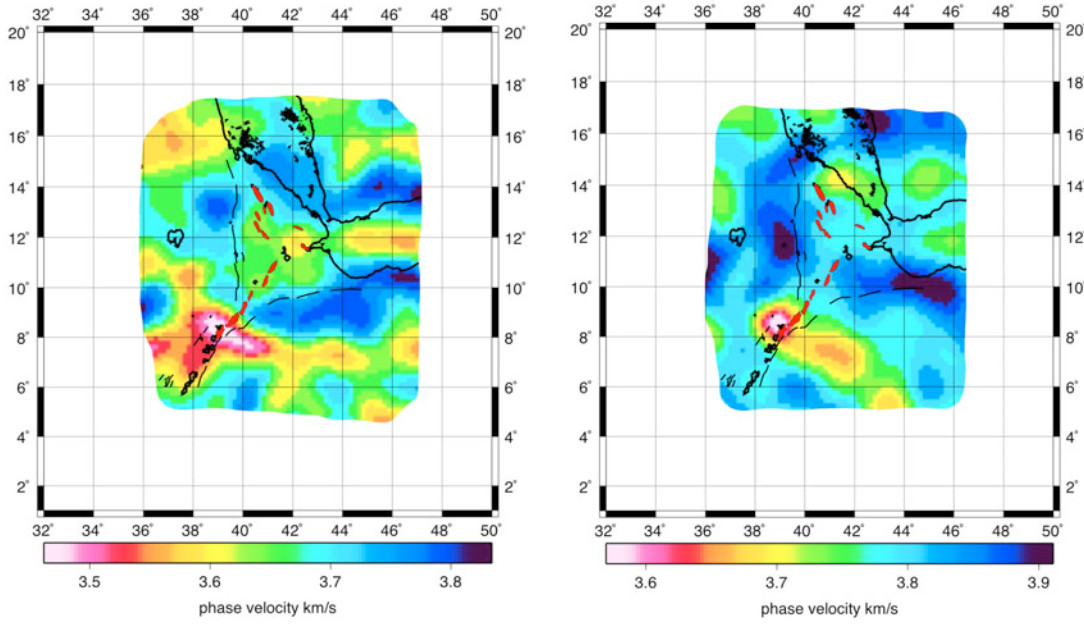
Teleseismic imaging Surface-‐wave tomography -‐ dispersion curves of teleseismic earthquakes have been picked and inverted for phase velocity maps at periods ranging from 25 seconds to 125 seconds. The provisional results show that at 40 seconds the lowest S-‐wave velocities are beneath the central Ethiopian rift (Figure 6). Other distinct low velocity anomalies are beneath the Afar depression and also a segment of the central-‐west Gulf of Aden rift. The low velocity anomalies in the subaerial parts of the map are likely zones of magma intrusion in the mantle lithosphere, whereas the low velocity anomaly in the Gulf of Aden is likely upwelling asthenosphere beneath the axis of the ridge.
Interpretation and results
Danakil depression microseismicity -‐ hypocentres of ~2000 earthquakes locatable during 1 February 2012 to 31 July 2012 from arrival time measurements of at least 4 phases are displayed in Figure 5. The majority of seismicity is clustered near volcanic centres in the rift axis, and also on the western margin of the Danakil depression. In the rift axis of the Danakil depression, earthquakes define distinct clusters near the Dallol magmatic centre, near Alu-‐Dala Filla and Erta Ale, strongly suggesting that the subsurface movement of magma beneath the volcanoes induces these earthquakes. Earthquakes are also particularly focused further south, within the Dabbahu magmatic segment. At the western margin of the rift, earthquakes are particularly focused near the towns of Berhale and Abala. The paucity of young volcanism here coupled with presence of fault scarps at the surface suggests these earthquakes represent ongoing slip on the border fault system of the Danakil depression.
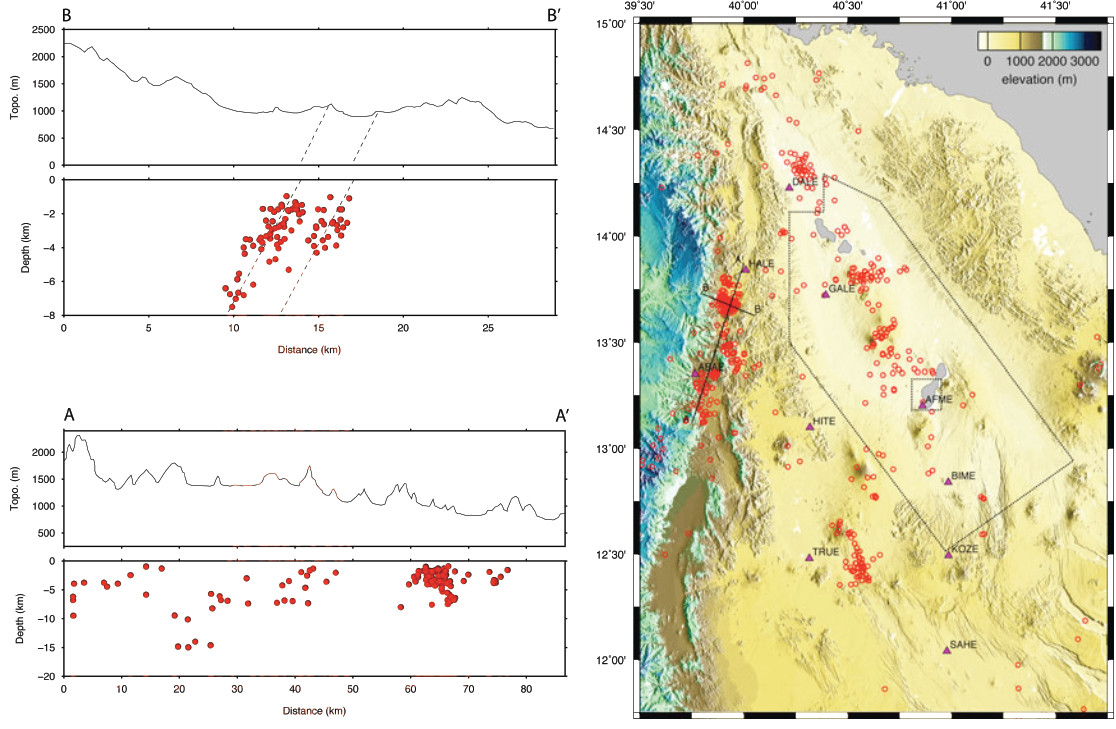
The section A-‐A’ along the rift margin is displayed in Figure 5 and shows that most earthquakes are shallower than 8km, but do extend to a maximum depth of 15 km. The section also shows that the depths of earthquakes along the rift margin increases towards the south. Section B-‐B’ crosses the dense seismic cluster just south of Berhale. The cross section shows that earthquakes define two discrete clusters that are 3 km apart. The 2 clusters are elongate along axes that dip 70 degrees towards the west. The axes of the clusters intersect the surface near sharp breaks in slope likely caused by protracted deformation on faults. We interpret these 2 clusters as showing activity along 2 sub-‐parallel faults that dip at 70 degrees towards the west. These antithetic faults (dipping away from the rift) are likely normal dip slip.
Teleseismic imaging
Surface-‐wave tomography -‐ dispersion curves of teleseismic earthquakes have been picked and inverted for phase velocity maps at periods ranging from 25 seconds to 125 seconds (figure 6). The provisional results show that at 40 seconds the lowest S-‐wave velocities are beneath the central Ethiopian rift. Other distinct low velocity anomalies are beneath the Afar depression and also a segment of the central-‐west Gulf of Aden rift. The low velocity anomalies in the subaerial parts of the map are likely zones of magma intrusion in the mantle lithosphere, whereas the low velocity anomaly in the Gulf of Aden is likely upwelling asthenosphere beneath the axis of the ridge.
Conclusion and recommendations
These SEIS-‐UK loans have enabled collected of high quality data from one of the most inaccessible parts of the world. 13 seismic stations were operated safely and continuously for one year. No seismometer was lost or stolen during the experiment and 1 seismometer was damaged because of instrument failure meaning they could not be locked during decommissioning. One solar panel was stolen. New analyses of seismicity, and surface-‐wave tomography have been conducted on the data. Of these, the surface-‐wave tomography is near completion and being written up by PhD student Ryan Gallacher at the University of Southampton. The local seismicity analysis is progressing and has so far been used to constrain the behavior of border fault and axial fault systems.
References
Ayele, A., D. Keir, C. Ebinger, T.J. Wright, G.W. Stuart, W.R. Buck, E. Jacques, G. Ogubazghi, J. Sholan, September 2005 mega-‐ dike emplacement in the Manda-‐Harraro nascent oceanic rift (Afar Depression), Geophys. Res. Lett., 36, L20306, doi:10.1029GL039605, 2009.
Bastow, I.D., D. Keir, Protracted development of a magmatic rifted margin in Afar, Nature Geoscience, 4, doi: 248-‐250, doi: 10.1038/NGEO1095, 2011.
Belachew, M., C. Ebinger, D. Cote, D. Keir, J. Rowland, J.O.S. Hammond, A. Ayele, Comparison of dike intrusions in an incipient seafloor spreading segment in Afar, Ethiopia: Seismicity perspectives, J. Geophys. Res. 116, B06405, doi: 10.1029/2010JB007908, 2011.
Ebinger, C., A. Ayele, D. Keir, J. Rowland, G. Yirgu, T. Wright, M. Belachew, I. Hamling, Length and timescales of rift faulting and magma intrusion: the Afar rifting cycle from 2005 to present, Annu. Rev. Earth Planet. Sci., 38, 437-‐464, doi: 10.1146/annurev-‐ earth-‐040809-‐152333, 2010.
Hammond, J.O.S., J-‐M. Kendall, G. Stuart, D. Keir, C. Ebinger, A. Ayele, M. Belachew, The nature of the crust beneath the afar triple junction: Evidence from receiver functions, Geochem. Geophys. Geosyst., 12, Q12004, doi: 10.1029/2011GC003738, 2011.
Hanks, T. C., and H. Kanamori (1979), A moment magnitude scale, J. Geophys. Res., 84, 2348–2350, doi:10.1029/JB084iB05p02348.
Keir, D., G. W. Stuart, A. Jackson, and A. Ayele (2006), Local earthquake magnitude scale and seismicity rate for the Ethiopian rift, Bull. Seismol. Soc. Am., 96, 2221 2230, doi:10.1785/0120060051.
Makris, J., and A. Ginzburg (1987), The Afar Depression: Transition between continental rifting and sea-‐floor spreading, Tectonophysics, 141, 199–214.
McKenzie, D.P., D. Davies, and P. Molnar (1972), Plate tectonics of the Red Sea and East Africa, Nature, 224, 125-‐133.
Peterson, J. (1993), Observations and modelling of seismic background noise, U.S. Geol. Surv. Open File Rep., 93-‐322, 1-‐95.
Richter, C. F. (1935), An instrumental earthquake magnitude scale, Bull. Seismol. Soc. Am., 25, 1–32.
Wright, T., C. J. Ebinger, J. Biggs, A. Ayele, G. Yirgu, D. Keir and A. Stork, Magma-‐maintained rift segmentation at continental rupture in the 2005 Afar dyking episode, Nature, 442, 291-‐294, doi:10.1038/nature04978, 2006.
Yang, Y. and D.W. Forsyth (2008), Attenuation in the upper mantle beneath Southern California: physical state of the lithosphere and asthenosphere, J. Geophys. Res., 113, B03308.
Table of stations deployment details
Code Inst. Digitizer Latitude Longitude Elev. HITE 3ESP T34977 13.10124 40.31691 0566
HALE 3ESP T34591 13.84221 40.00772 0797
GALE 3ESP T34589 13.72514 40.39401 -‐087
AFME 3ESP T34601 13.20396 40.85848 -‐058
ERTE 3ESP T34739 13.44630 40.49690 -‐005
AHME 3ESP T34599 14.08887 40.27840 0046
IGRE 3ESP T34398 12.25259 40.46123 0675
KOZE 3ESP T34731 12.49478 40.98489 0543
ABAE 3ESP T34510 13.35350 39.76355 1447
DALE 3ESP T34636 14.22897 40.21783 -‐097
ERTE 6TD T6108 13.44630 40.49690 -‐005
GULE 6TD T6083 13.69449 39.58854 2021
GPSE 6TD T6093 13.48817 40.52833 0000
Publications resultant from the loan
Completed Hammond, J.O.S., Kendall, J.M., Wookey, J., Stuart, G.W., Keir, D. and Ayele, A. (2014) Differentiating flow, melt, or fossil seismic anisotropy beneath Ethiopia. Geochemistry Geophysics Geosystems, 15, (5), 1878-‐1894. (doi:10.1002/2013GC005185).
Hammond, J.O.S., Kendall, J.-‐M., Stuart, G.W., Ebinger, C.J., Bastow, I.D., Keir, D., Ayele, A., Belachew, M., Goitom, B., Ogubazghi, G. and Wright, T.J. (2013) Mantle upwelling and initiation of rift segmentation beneath the Afar Depression. Geology, 41, (6), 635-‐638. (doi:10.1130/G33925.1).
Stork, A.L., Stuart, G.W., Henderson, C.M., Keir, D. and Hammond, J.O.S. (2013) Uppermost mantle (Pn) velocity model for the Afar region, Ethiopia:an insight into rifting processes. Geophysical Journal International, 193, 321-‐328. (doi:10.1093/gji/ggs106).
In progress
Gallacher, R., Keir, D., Harmon, N., Hammond, J.O.S., et al., Surface wave tomographic imaging beneath the Afar triple junction, in prep for_ Geology_.
