Scientific Report 954
This report is also available as a PDF document .
Abstract
We conducted two flight campaigns in 2011 in a typical Mediterranean ecosystem in southern Portugal. The study site is particularly interesting because of the gradient in land-use characterized by an agri-environmental scheme (within the borders of a Special Protected Area for birds) to support steppe bird populations in the northwest of the area and extensive shrub encroachment processes, outside the SPA, in the southeast.
Hyperspectral AISA Eagle & Hawk data, laser scanning data, and aerial photography were acquired for a coverage of 37km by 7 km. Atmospheric conditions, including water vapour and aerosol contents, were measured during the over-flights. Data went through atmospheric and geometric correction, and were pre-processed in a reasonable quality. The flight campaign was joined by comprehensive ground activities: field spectroscopic measurements for calibration, validation and analysis, top-of-canopy photos for shrub cover fraction derivation and allometric measurements to calculate shrub biomass (plot level), and data on the bird communities at the landscape level.
Several studies were or are still being conducted on basis of the collected data, of which some also have been published or presented at conferences and workshops, while others are still undergoing. This includes studies on mapping shrub cover fractions on sub-pixel scale, estimating vegetation biomass, or mapping beta diversity. All of these aim at assessing the use of hyperspectral data for monitoring natural ecosystems and ecosystem transitions, in the frame of the pre-launch activities of the EnMAP hyperspectral satellite mission.
The project was supported by equipment loans from the NERC Geophysical Equipment Facility (GEF) and Field Spectroscopy Facility (FSF). The Leica System 1200 GPS borrowed from the GEF was used as a base station for the flight campaign.
Background
Due to its climatic regime, the wide occurrence of shallow soils and a long and intense history of human use, Mediterranean ecosystems are highly susceptible to degradation. A typical example is the area between Castro Verde and Mértola within the Alentejo region in southern Portugal, which is characterised by strong environmental gradients caused by these processes. The area features a sharp gradient in soil quality and land degradation, followed closely by a gradient of land abandonment and consequent scrub encroachment. Part of this region is included in the Special Protection Area for birds (SPA) of Castro Verde, with a bespoke agri-environmental scheme aimed at maintaining the traditional cereal farming system and to promote its steppe bird populations, of international importance for some threatened species. Additionally, the scrub encroachment process, more predominant outside the SPA where no land use incentives exist, affects the steppe bird community which is replaced by a Mediterranean shrub bird community of less conservation concern.
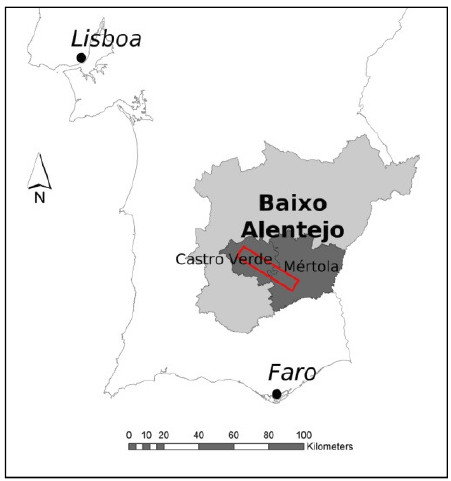
The aim of this project is to assess the capability of hyperspectral imagery for monitoring the processes described above. The synergies between these data and laser scanning (LiDAR) data are further aim of the project. This project is included in the scientific activities of the EnMAP Core Science Team, which aims at assessing the use of spaceborne hyperspectral data for monitoring natural ecosystems and ecosystem transitions, in the frame of the pre-launch activities of the German EnMAP hyperspectral satellite mission (due for launch in 2017).
For these aims, field spectroscopy data as well as data on several ecosystem parameters were collected on site, and airborne imagery (AISA Eagle & Hawk and LiDAR) was acquired by NERC’s Airborne Research & Survey Facility (ARSF), at two altitudes (1500m and 4500m). The flight campaign was funded through joint NERC ARSF and EUFAR (EU11-04/HyMedEcos-Gradients) research grants.
These data will be used for algorithm development research aimed at quantifying gradual changes in shrub cover and biomass and in the bird communities.
Field and airborne surveys
An equipment loan was provided from NERC Geophysical Equipment Facility (GEF) in the form of a GPS receiver (Leica System 1200 GPS with antenna). This was mounted on top of a trig point (approximately at the centre of the flight area) and served as a reference GPS base-station to aid NERC ARSF airplane’s navigation and posterior image processing.
The flight design accounted for the collection of HRSI (AISA Eagle and Hawk hyperspectral imagers) and laser scanning data (Leica ALS50-II sensor) at two different altitudes - 1500m and 4500m. The estimated ground resolution of the collected HRSI is of ca. 1m and 3m in the visible and near infra red spectral regions (AISA Eagle) and 2m and 6m in the mid respectively at both altitudes.
This was aimed at a full coverage of the study area by four parallel flight lines at the higher altitude, subsequently re-flown at the lower altitude, plus an additional short perpendicular flight line, crossing the previous over calibration target in the town of Castro Verde, flown twice (respectively before and after the main coverage) at each altitude.
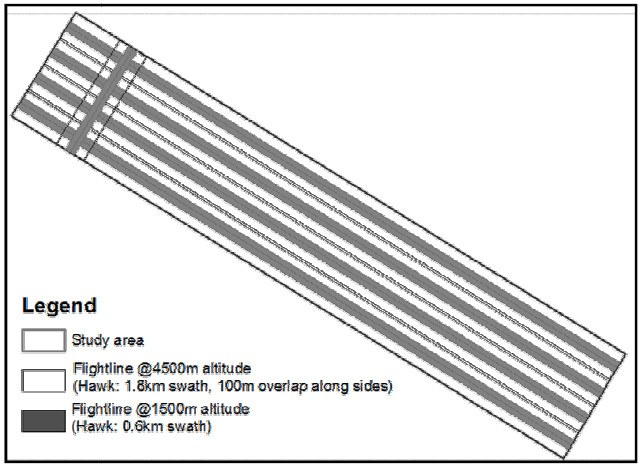
The flight campaign was successfully conducted on the 7th of April 2011 (between 11.30am and 3.00pm), with the collection of data with all sensors for the 8 SE-NW flight lines and the 4 SW-NE (cross) flight lines. Additionally, digital aerial photography (Leica RCD105) was collected at both altitudes.
The flight campaign was joined by comprehensive ground activities including the acquisition of field spectra for image data calibration and for model calibration / validation, of shrub (and grassland) vegetation data at the plot level, and of data on the bird communities at the landscape level. The field campaign thus took place from 29th of Mach to 27th of April in 2011.
Field spectroscopic measurements were taken for two main purposes: reference spectral measurements of selected targets were collected for image data calibration (and validation); and spectroscopy data of different land cover types (with particular focus on the dominant shrub species) were collected for further data analysis.
The measurements were collected using an Analytical Spectral Device (ASD-3) full range field spectrometer (spectra range from 350 to 2500 nm; spectral resolution - 3 nm @ 700 nm, 8.5 nm @ 1400 nm and 6.5 nm @ 2100 nm; sampling interval - 1.4 nm @ 350-1050 nm and 2 nm @ 10002500 nm), which is calibrated thus allowing for absolute measurement of radiance values.
Additionally, we characterised the meteorological/atmospheric conditions throughout the overflight area. For this purpose we deployed three hand-held Microtops II sunphotometers and a Delta-T sunshine sensor in several locations during the overflight, measuring the water vapour and aerosol contents of the atmosphere, and the direct/diffuse ratio as a measure of sky haziness (Figure 5). Also, two weather stations located in the study region were collecting continuously data during the overflight period.
The sampling of field spectra following our classification scheme (see above), focused particularly the shrub vegetation. Nevertheless, all land cover types were sampled for field spectra, in order to allow for a good spectral representation of the region’s land cover. This way the following spectral data were collected:
-
Non-shrub features, mainly of natural vegetation surfaces. In total, 123 spectra were measured throughout the entire study region.
-
Shrub features, of the two dominant species (Cistus ladanifer and Cistus monspeliensis) with different heights (little, medium-high, high), in different spatial configurations (growing individually, in sparse, medium-dense or dense patches), with different understorey (grass, litter, soil, stone, etc.). In addition, we measured different shrub plant elements of both species at different ages (young and adult leaves; green, woody and dry stems; buds; flowers; all in light and shade conditions) under quasi laboratory conditions (using sunlight illumination). A total of 174 spectra were captured at two specific locations.
In total, 90 shrub plots were sampled for shrub fractional cover and biomass. These plots were distributed among 9 sampling regions and followed a stratified random scheme. The criteria for selecting appropriate sampling plots were: Plots of 2x2m side length within 4x4m homogeneous environment of shrub vegetation; located close to nadir region of the flight; cover the variability of shrub vegetation coverage and biomass quantity; guaranteed accessibility.
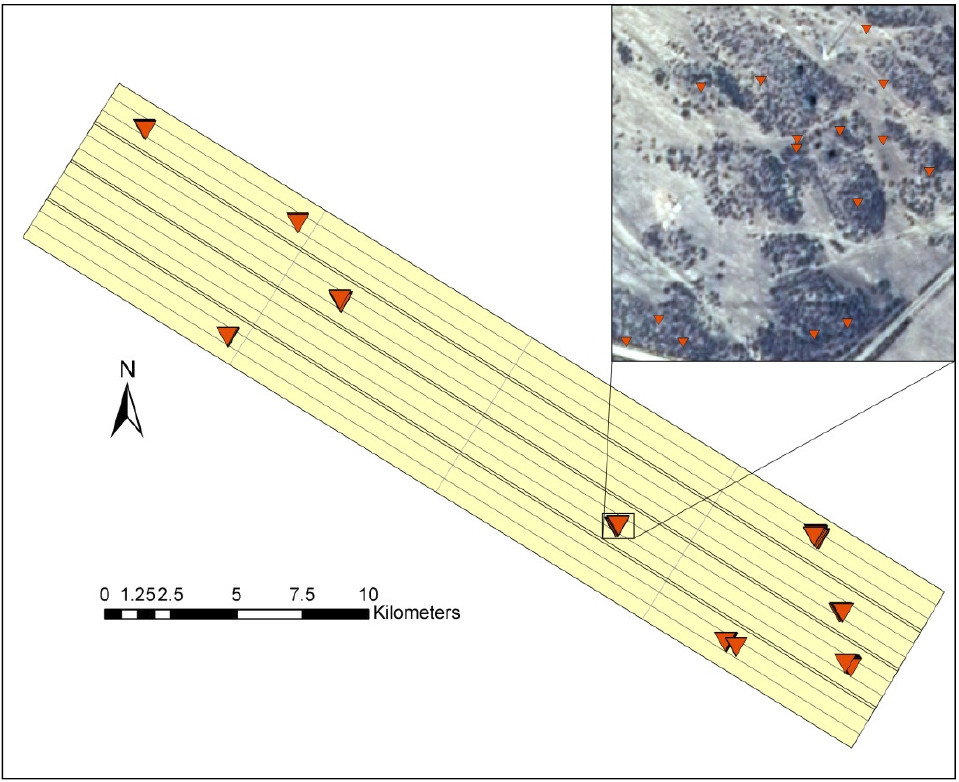
For estimating shrub vegetation fractional cover we collected top-of-canopy photography from a height of ca. 4.5m above ground, by using a digital camera box built on a telescopic pole structure.
All photographs were captured in the late morning and early evening and always facing perpendicular to the sun, in order to guarantee similar light and shade conditions.
Allometric measurements were taken on all shrubs within a sampled plot, in order to estimate plot shrub biomass, following species-specific allometric formulas. These measurements included maximum crown height, and both larger crown diameter and smaller crown diameter.
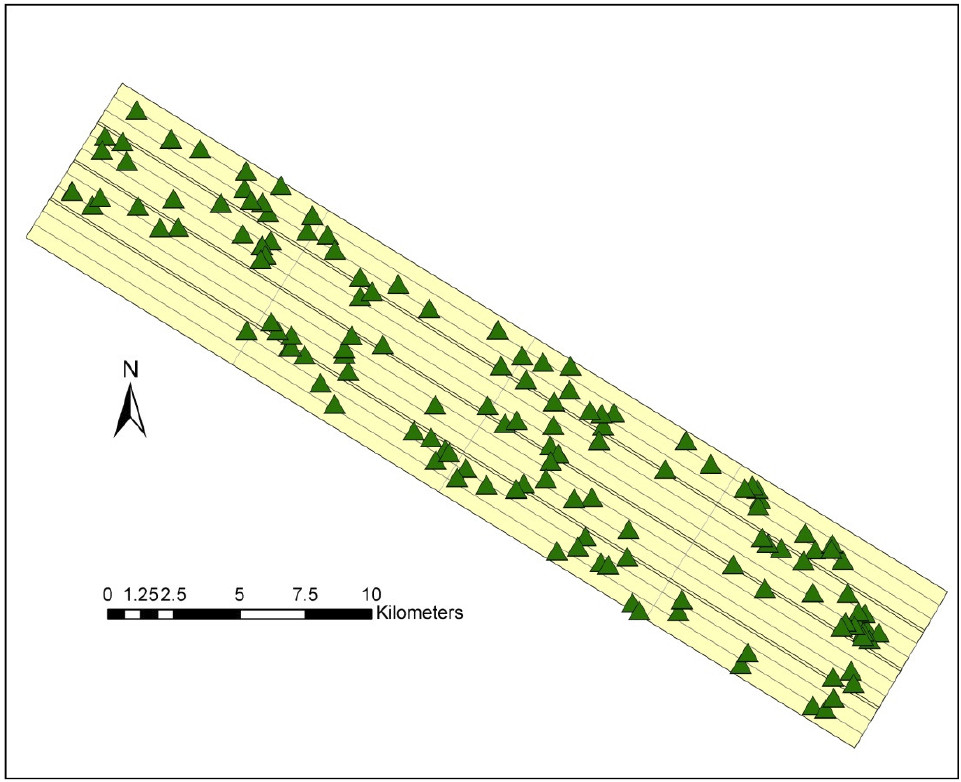
The bird communities were sampled through minute duration counts on circular plots with 125m distance limit. All bird censuses were carried out during the birds’ period of peak-activity, i.e. the early mornings (first four hours after sunrise) and evenings (last two hours before sunset), and all visual and auditory bird observations were registered. The sampling locations were purposely chosen in the field, in order to guarantee a good geographical distribution of plots and across the shrub encroachment gradient. In total 133 plots were sampled and 1148 individuals of 45 different species recorded (Figure 4).
Data quality
In the day previous to the overflight it was reported a major sand storm in the Sahara, which produced a plume off and over the Iberian Peninsula (see Figure 5). This plume was still partially present on the following day which will have influence the general SNR of the collected data. The overall quality of the data, as reported on flight log sheet was 5/10, and “large amounts of haze” noted.
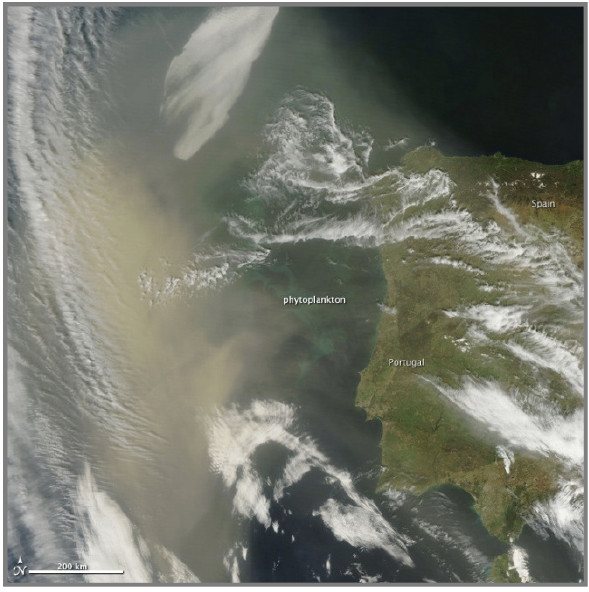
Nevertheless, 6 flight strips were collected (4 along the gradient and two across) at each altitude, according to planned.
The LiDAR data obtained were of apparently good quality and covered all of the area. Height and Intensity information were captured, with an average return of 99.31%. While the sensor was set to a Multi-pulse mode, ca. 99.4% of the emitted signals were recorded as a single pulse return.
The aerial photography captured (in total of 295 frames) was of good quality, including navigation information, such as location, heading, pitch and roll. They were provided, however without any further correction.
Data processing
AISA data of 6 flight lines each flight altitude (i.e. 1500m and 4500m) and campaign (i.e. April and August) were acquired (see above). These data went through radiometric and atmospheric correction using a radiative transfer model approach (Richter and Schl pfer 2002), with subsequent spectral polishing (Savitzky-Golay filtering) and nadir normalization to correct for across track illumination differences (Richter 2007). This was followed by a geometric correction and subsequent data stacking of the imagery of both sensors (Schl pfer and Richter 2002), resulting in hyperspectral images of 1.8m g.s.d. (low-altitude data) and 5.4m g.s.d. (high-altitude data), respectively. After excluding spectral regions of atmospheric absorption, 307 spectral bands remained. The data of the 4500m altitude (with an spatial overlap of 100m to the adjacent stripe) were subsequently mosaicked using a minimum off-nadir systematic, i.e. avoiding pixels corresponding to large scan angles. This results into image mosaics with coverage of 37km by 7 km.
This mosaic was used for the simulation of data of the forthcoming Environmental Mapping and Analysis Program (EnMAP) satellite hyperspectral sensor (Segl et al. 2012; Stuffler et al. 2007), resulting in an image with 242 spectral bands and a g.s.d. of 30m. These were further reduced to 146 bands by excluding those relating to spectral regions of atmospheric absorption or data extrapolation.

The LiDAR data were processed in order to produce a Digital Surface Models (DSM) respectively at 0.9m and 2.7m g.s.d. for the low-altitude and the high-altitude data. A Digital Terrain Model (DTM) was derived from the high-altitude data at 5m g.s.d., by performing Height Filtering (Streutker and Glenn 2006). These procedures were done in the BCAL software tool (http://bcal.boisestate.edu/tools/lidar/).
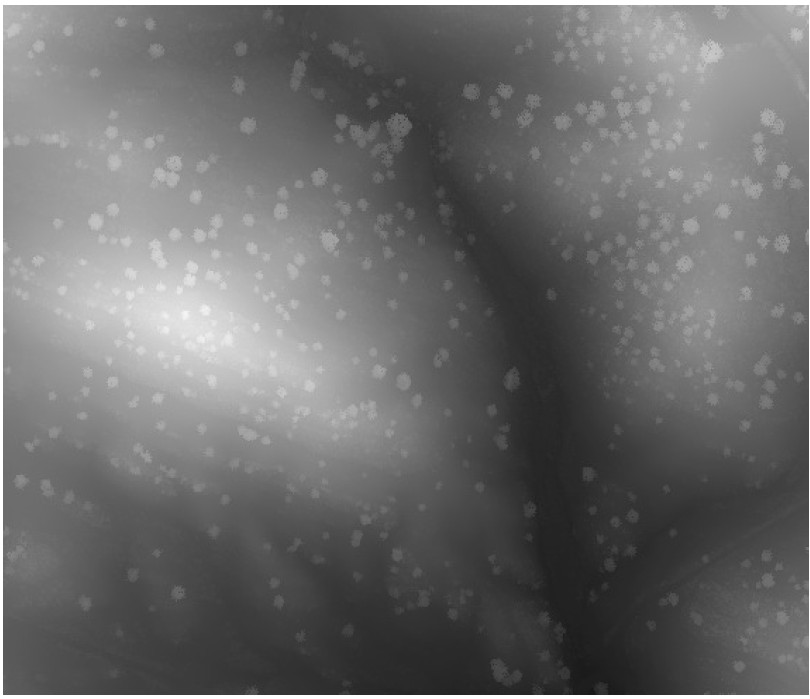
LiDAR point cloud distribution metrics were extracted for the 90 shrub plots, plus 10 additional noshrub plots. These metrics include: maximum, minimum, mean, median, range, coefficient of variation, standard deviation, skewness and percentile of the height and intensity data; and total number and percentages of 1st, 2n, 3r and 4th returns.
Plot data (top-of-canopy photography and biomass) have been also processed. On basis of top-ofcanopy photos (see above) the fraction of photosynthetic active Cistus shrub vegetation was estimated. Therefore, a grid of 10cm by 10cm cells was overlaid on top of the photos. Each cell was assigned whether it belongs to active Cistus shrub vegetation or not. The aggregation of these shrubclass cells to the plot leaded to the fraction of photosynthetic active Cistus shrub vegetation at 1.8m scale. Biomass was calculated on basis of allometric measurements (see above) following the estimation-formula provided by Blanco Oyonarte & Navarro Cerrillo (2003). Based on this, the biovolume of each individual plot was calculated and the biomass derived. As this formula only applies for larger Cistus shrub plants, we adjusted it for all-encompassing biomass estimations. This was done through destructive sampling 64 small individual shrub plants (of both species).
Interpretation
A) CASE-STUDY Shrub cover factions: Probabilities of conventional classification approaches might be not necessarily optimized for the characterization of quantities, e.g. cover fractions. Therefore, we explored probabilities derived from an import vector machines (IVM) classifier (Zhu and Hastie 2005), a kernelbased logistic regression approach, as quantitative measures of class proportion (Suess et al. 2014). We developed a strategy to utilize probabilities for the characterization of class transitions in addition to the class label. This strategy incorporates the use of synthetic spectral mixtures, which represent gradual class transitions, into the model selection process. On basis of field spectroscopy data we demonstrated the stability of this strategy for noisy training data, and concluded that this approach (IVMquant) constitutes a simple, efficient and stable tool for quantitative analysis.
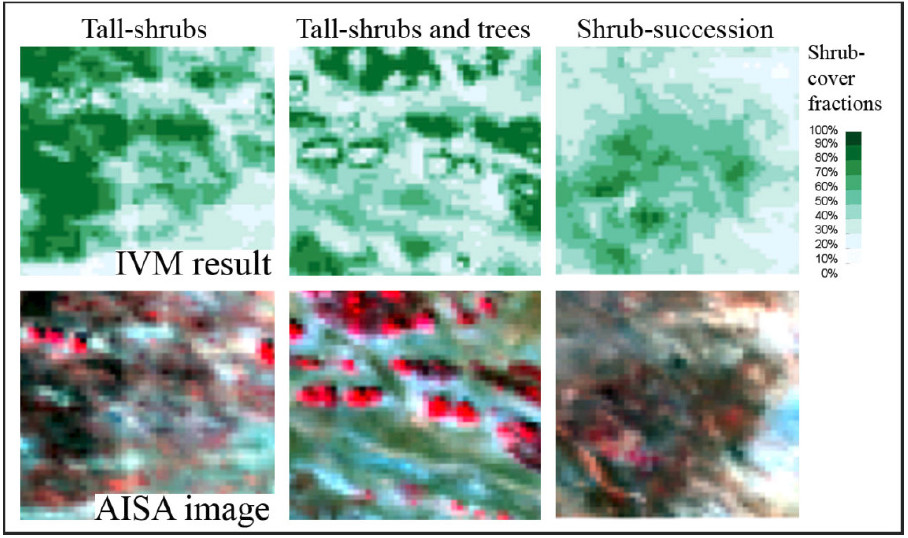
Following our aim of mapping shrub vegetation in natural-heterogeneous environments, we transferred the methodological framework of IVMquant to hyperspectral imagery, where class proportions are referred to as spatially explicit sub-pixel cover fractions. For this purpose we used hyperspectral imagery of a subset of a AISA dataset captured at 1500m. The examination of functional and spatial patterns of estimated shrub-cover fractions revealed promising results. This study has been concluded and a manuscript is being prepared for submission to publication.
B) CASE-STUDY Shrub biomass: The objective of this study is to investigate the synergies between hyperspectral and laser scanning data for estimating shrub vegetation biomass. For this purpose, AISA hyperspectral data (acquired at the low-altitude) and the LiDAR point cloud metrics were compiled for the 100 shrub plots (including the 10 no-shrub plots), from both airborne campaigns, as well as plot fractions of shrub cover (extracted from the top-of canopy photography, through image segmentation). These data will be used to fit the shrub biomass values, as derived from the allometric measures. This case study is however still undergoing and no results are yet to be seen.
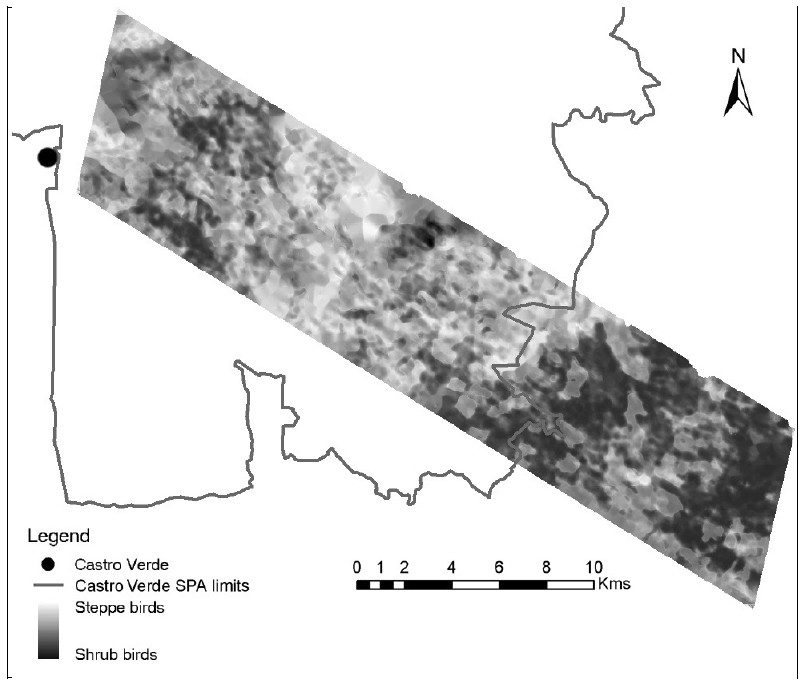
C) CASE-STUDY Mapping beta-diversity with hyperspectral data: In this study, the EnMAP simulated data were used to map the spatial patterns of bird community compositional turnover, or beta-diversity, by means of a purposively developed methodological approach called Sparse Generalised Dissimilarity (SGDM) Modelling. This approach consists on coupling Sparse Canonical Correlation Analysis (Witten et al. 2009) with Generalised Dissimilarity Models (Ferrier et al. 2007) for enabling the direct use of remote (high-dimensional) sensing data. This study has been concluded and a manuscript is being prepared for submission to publication.
Conclusion and recommendations
The analysis on the airborne remote sensing data, or on the derived products is partially still undergoing. However all of the pre-processing of the data is concluded, which would have not been possible without the GPS ground station lent from the NERC GEF. We found that the equipment was optimal for the purpose needed.
Our research objectives were partially achieved and we successfully used airborne hyperspectral imagery, with support from laser scanning data, for retrieving sub-pixel shrub cover information and for modelling spatial patterns of beta diversity. Further research is still undergoing, such as the estimation of above ground vegetation biomass or the mapping of Natura2000 habitats in the study region. Three manuscripts have been prepared in the scope of this project, two of which are still in preparation, while other are still in the planning phase (see section below).
Publications
Publications in international peer-reviewed journals
One manuscripts has been accepted for publication:
- Suess, S., van der Linden, S., Leit o, P.J., Okujeni, A., Waske, B., Hostert, P. (2014) Import Vector Machines for Quantitative Analysis of Hyperspectral Data. IEEE Geoscience and Remote Sensing Letters, vol. 11, no. 2: 449-453.
Two publications are being prepared for submission:
-
Leitão, P.J., Moreira, F., Osborne, P.E., Pinto, M.J., Catry, I., Suess, S., Milton, E.J., van der Linden, S.,& Hostert, P. (in prep) Mapping beta diversity from space using Sparse Generealised Dissimilarity Modelling: dealing with multi-dimensional and multi-collinear spectral data.
-
Suess, S., Leitão, P.J., van der Linden, S., Okujeni, A. & Hostert, P. (in prep.) Import Vector Machines for quantitative Mapping of vegetation cover fractions in natural-heterogeneous environments.
Further publications are being planned:
- Leitão, P.J. et al. (in prep) Hyperspectral data for mapping Natura 2000 habitats. Suess, S., Leit o, P.J. et al. (in prep) Retrieval of biochemical and biophysical parameters insupport of ecosystem and species habitat models.
- Leitão, P.J. et al. (in prep) Synergies between EnMAP and airborne laser scanning data for estimating shrub vegetation biomass.
Communications in scientific meetings:
Four oral communications have been delivered / accepted:
- Leitão, P.J., Moreira, F., Osborne, P.E., Pinto, M.J., Catry, I. & Hostert, P. (2013) Mapping turnover in bird community composition with satellite spectral data. Annual Meeting of the German Ecological Society. 9th-13th September, Potsdam, Germany.
- Leitão, P.J., Suess, S., Schwieder, M., Milton, E.J., van der Linden, S., Hostert, P. (2013) Hyperspectral satellite data for modelling spatial beta diversity patterns of birds along an environmental gradient. ESA Living Planet Symposium. 9th-13th September, Edinburgh, UK.
- Suess, S., Leitão, P.J., van der Linden, S., Okujeni, A. & Hostert, P. (2013) Import Vector Machines for quantitative Mapping of vegetation cover fractions in natural-heterogeneous environments. EnMAP Workshop, 14th November, Bonn, Germany.
- Leitão, P.J., Suess, S., Schwieder, M., van der Linden, P. & Hostert, P. (accepted) Monitoring ecosystem transitions with EnMAP: preparatory research activities. Global Land Project Open Science Meeting, 19th-21st March 2014, Berlin, Germany.
One poster communication has been delivered:
- Suess, S., van der Linden, S., Leitão, P.J., Okujeni, A., Waske, B. & Hostert, P. (2013) Import Vector Machines for sub-pixel analysis. 8th EARSeL Imaging Spectrometry Workshop. 8th-10th April, Nantes, France.
References
Blanco Oyonarte, P., & Navarro Cerrillo, R.M. (2003). Aboveground phytomass models for major species in shrub ecosystems of western Andalusia. Investigación agraria: Sistemas y recursos forestales., 12, 47-55
Ferrier, S., Manion, G., Elith, J., & Richardson, K. (2007). Using generalized dissimilarity modelling to analyse and predict patterns of beta diversity in regional biodiversity assessment. Diversity and Distributions, 13, 252-264
Richter, R. (2007). Atmospheric/Topographic Correction for Airborne Imagery, ATCOR-4 User Guide, Version 4.2. In: DLR-German Aerospace Center, Remote Sensing Data Center
Richter, R., & Schl pfer, D. (2002). Geo-atmospheric processing of airborne imaging spectrometry data. Part 2: Atmospheric / topographic correction. International Journal of Remote Sensing, 23, 2631-2649
Schl pfer, D., & Richter, R. (2002). Geo-atmospheric processing of airborne imaging spectrometry data. Part 1: parametric orthorectification. International Journal of Remote Sensing, 23, 26092630
Segl, K., Guanter, L., Rogass, C., Kuester, T., Roessner, S., Kaufmann, H., Sang, B., Mogulsky, V., & Hofer, S. (2012). EeteS-The EnMAP End-to-End Simulation Tool. Ieee Journal of Selected Topics in Applied Earth Observations and Remote Sensing, 5, 522-530
Streutker, D.R., & Glenn, N.F. (2006). LiDAR measurement of sagebrush steppe vegetation heights. Remote Sensing of Environment, 102, 135-145
Stuffler, T., Kaufmann, C., Hofer, S., F rster, K.P., Schreier, G., Mueller, A., Eckardt, A., Bach, H., Penn , B., Benz, U., & Haydn, R. (2007). The EnMAP hyperspectral imager - an advanced optical payload for future applications in Earth observation programmes. Acta Astronautica, 61, 115-120
Suess, S., van der Linden, S., Leit o, P.J., Okujeni, A., Waske, B., & Hostert, P. (2014). Import Vector Machines for Quantitative Analysis of Hyperspectral Data. IEEE Geoscience and Remote Sensing Letters, 11, 449-453
Witten, D.M., Tibshirani, R., & Hastie, T. (2009). A penalized matrix decomposition, with applications to sparse principal components and canonical correlation analysis. Biostatistics, 10, 515-534
Zhu, J., & Hastie, T. (2005). Kernel Logistic Regression and the Import Vector Machine. Journal of Computational and Graphical Statistics, 14, 185-205
