Scientific Report 936
This report is also available as a PDF document .
Abstract
A campaign of glaciological and geophysical data acquisition was conducted on Pine Island Glacier in 2011-12 to investigate ice dynamics and subglacial conditions. A passive seismic array, using NERC GEF equipment, was deployed in support of active-source seismic experiments. Clear seismic events from the ice-bed interface were detected on all stations. Some periods of enhanced noise degrade up to 30% of the recording period and the source of this is being investigated further. Basal seismicity was found to be less than that beneath a comparable glacier, in both event frequency and amplitude, and is consistent with a glacier bed comprising soft, water-saturated deforming sediments.
Background
Pine Island Glacier
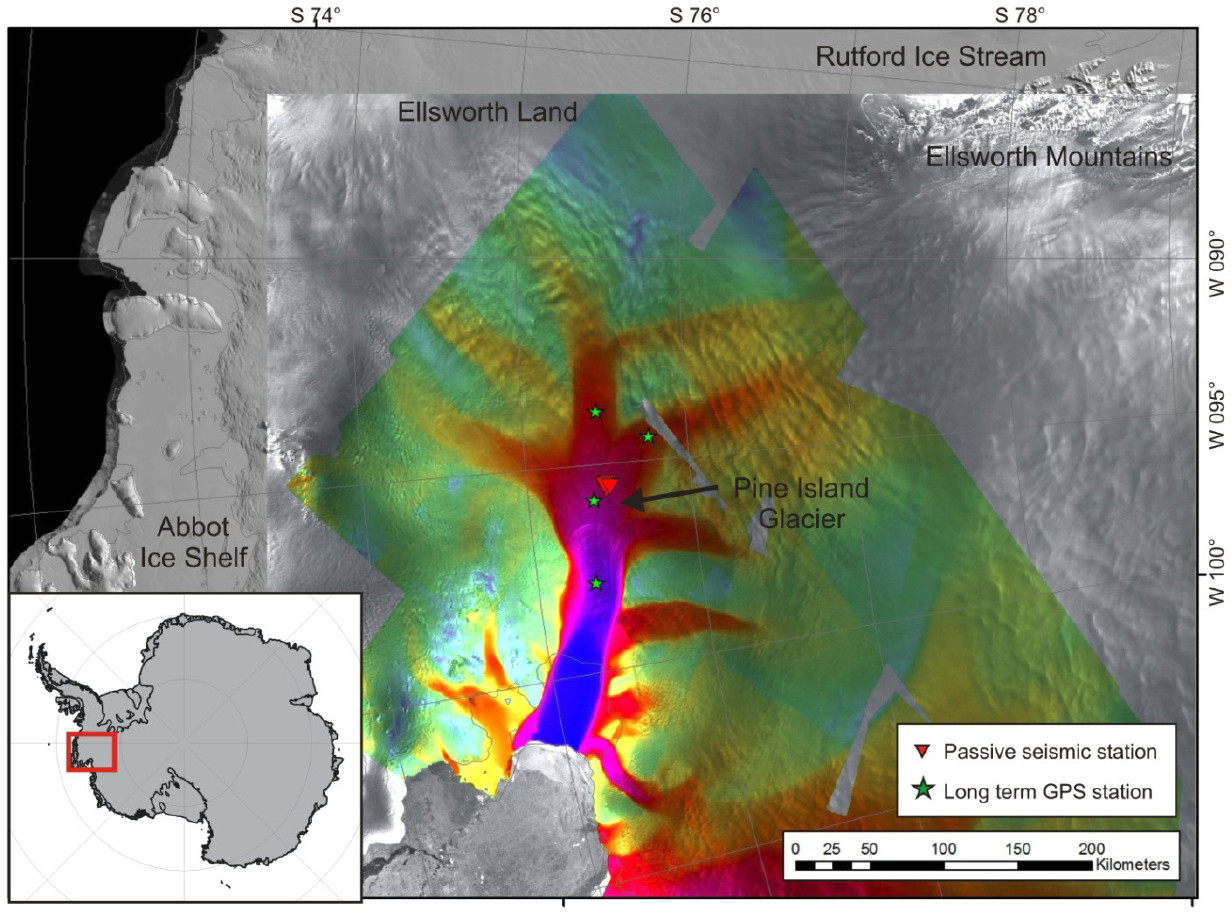
Pine Island Glacier (PIG; Fig. 1) is the largest glacier in the West Antarctic Ice Sheet (WAIS); it is also the one that is changing most rapidly. Ice discharge from PIG increased by ~30 Gt yr-1 between 1996 and 2007, and it is currently the greatest single contributor to the mass imbalance (and hence sea-level contribution) of WAIS1. Basal conditions are a significant factor in controlling ice flow, but a physically-based understanding of the basal boundary is still lacking. The fourth and final field campaign of a project studying the basal conditions and changing flow of PIG (the TIGRIS Project) was conducted in the 2011-12 austral summer.
Objectives
The main objectives of this fieldwork were:
- To determine some of the physical properties of the ice and the subglacial material using seismic reflection and AVO techniques, and radar sounding.
- To measure the ice flow at a number of previously-occupied locations and determine any on-going changes.
- To repeat measurements of ice thickness, surface elevation and gravity at one previously-occupied location and determine the presence and rate of any subglacial erosion.
Passive seismic monitoring
Six passive seismic stations were provided by NERC GEF (SEIS-UK) for this project and were used primarily in support of the active seismic acquisition. Their role was to monitor the spatial distribution and temporal characteristics of the glacier bed’s natural seismicity. Glaciers are known to exhibit natural basal seismicity associated with the ice moving over its substrate. The prime reason for acquiring the passive seismic data was to determine whether the glacier bed was noisy or quiet during some of the active seismic experiments. Although this result does not feed quantitatively into the interpretation, it is still important to know whether the derived properties describe a relatively dynamic or quiescent glacier bed.
Survey procedure
Station deployment
Each passive seismic station (Figure 2) comprised a Reftek 130 DAS with 32GB flash memory and GPS receiver (GEF), 4.5 Hz, 3-component geophone (GEF), solar regulator (GEF), 100Ah sealed gel lead-acid battery and a 40W solar panel. Sample rate was 1 kHz and recording was continuous.
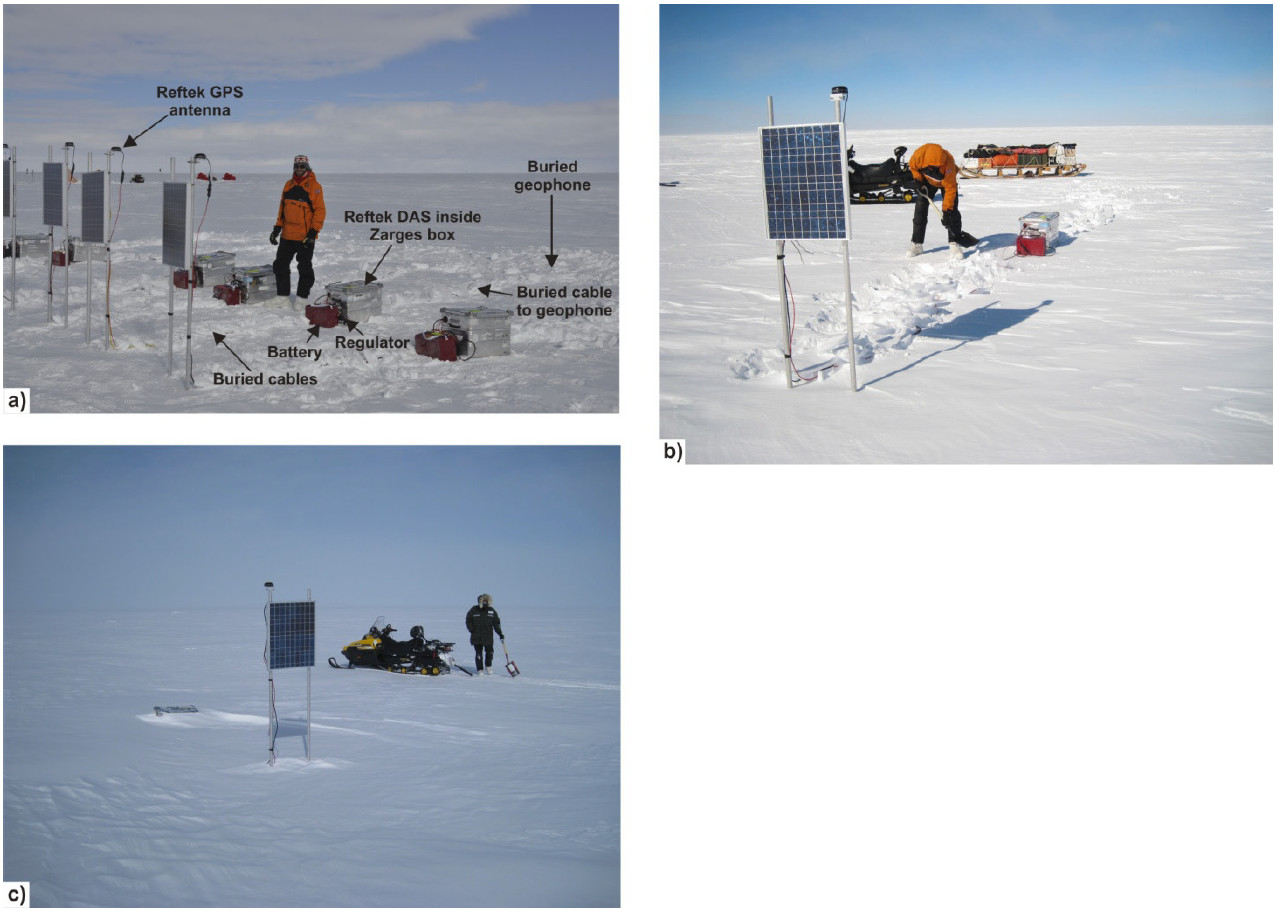
At each location the geophone was buried ~1 m below the snow surface (principle axis aligned in the ice flow direction), as far away from all other items as possible (~3m); Reftek, and cables were inside the Zarges box, battery and regulator were outside; the solar panel (with the GPS receiver on top) was mounted vertically, facing North, ~1.5 m above the snow surface, as far from the geophone (~6m) and Zarges box (~3m) as possible. Loose cables were covered with snow. Figure 2 shows station deployment examples. This set-up worked very well in this environment and gave no operational problems. Care needs to be taken to avoid damage when digging up the cables and geophone at the end of a deployment.
Huddle test
A 6-day Huddle Test comprising all six stations was conducted at the beginning of the project, close to the main camp. Concurrently, seismic reflection and radar surveys were carried out to finalise the proposed station locations. At the end of the Huddle Test, all stations were successfully downloaded and selected periods of data checked. Similar background noise levels were present on all stations, and basal events could be identified, indicating that all were working correctly and the main array could be deployed.
India Array
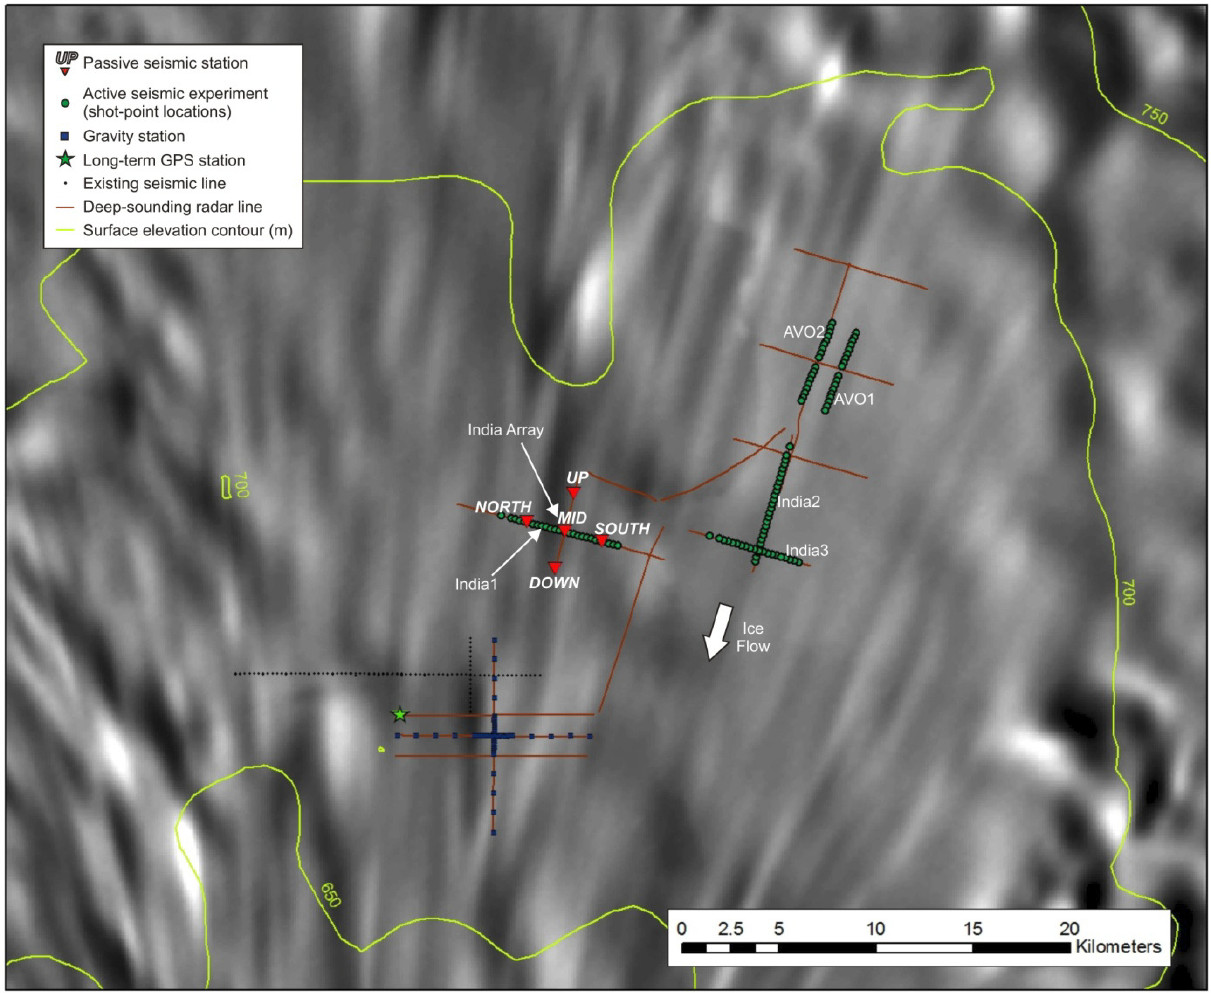
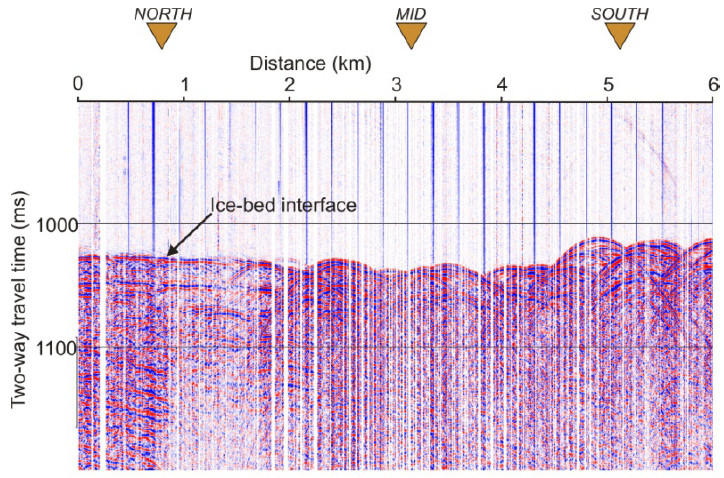
The main passive seismic experiment (Fig. 3) comprised a single array (India Array) of 5 stations (the sixth was retained as a spare) - one central station with the other four at positions upstream, downstream and in both cross-stream directions, around this central location. Station spacing was 2 km; the glacier is ~2 km thick and this spacing was chosen to give a reasonable chance of good source locations, especially for events occurring within the footprint of the array itself. The 3 stations aligned perpendicular to ice flow were coincident with a seismic reflection line, and straddled a transition between smooth bed topography and a region of elongated, flow-parallel ridges and mounds of bed material (Fig. 4) . Although the original intention had been to occupy a second array, major operational delays meant that there was insufficient time for this. The India Array recorded for 33 days.
Deployment comments
-
The Clie palmtops were far superior to the Acceca ones in these environmental conditions (particularly operating in low temperatures and experiencing prolonged, cold storage between uses). They often lost memory (and battery power), but this could always be re-loaded from the installed flash card on the spot, once connected to a Reftek.
-
On this kind of project, the equipment is likely to have experienced many weeks at low temperatures (e.g. 0 to -20 C) during storage and transport prior to deployment. Experience shows that after installation and power-up for the first time, leaving them alone for a few hours, without checking the status at all, eliminates virtually all minor settlingdown issues.
-
Similarly, when moving stations mid-project (e.g. from Huddle Test to array), keeping the Refteks powered-up minimises problems.
Data quality
Data recovery and event identification
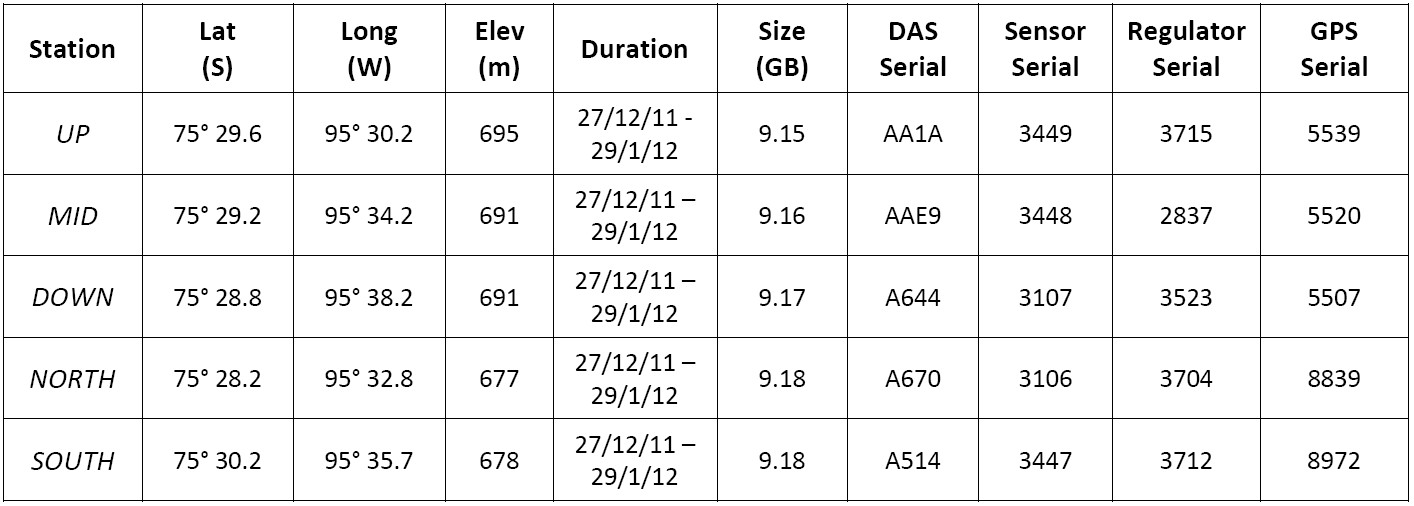
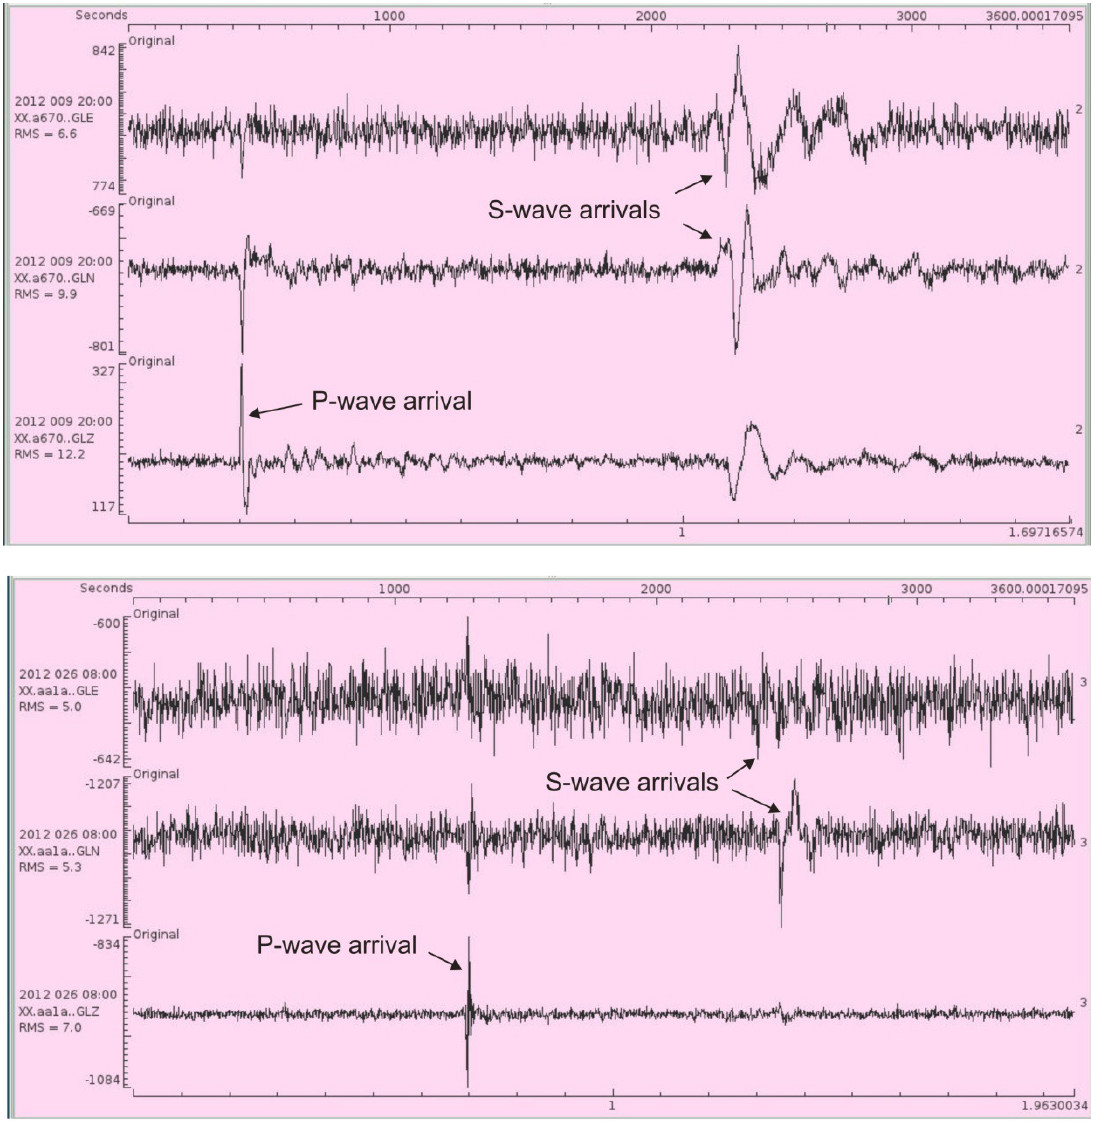
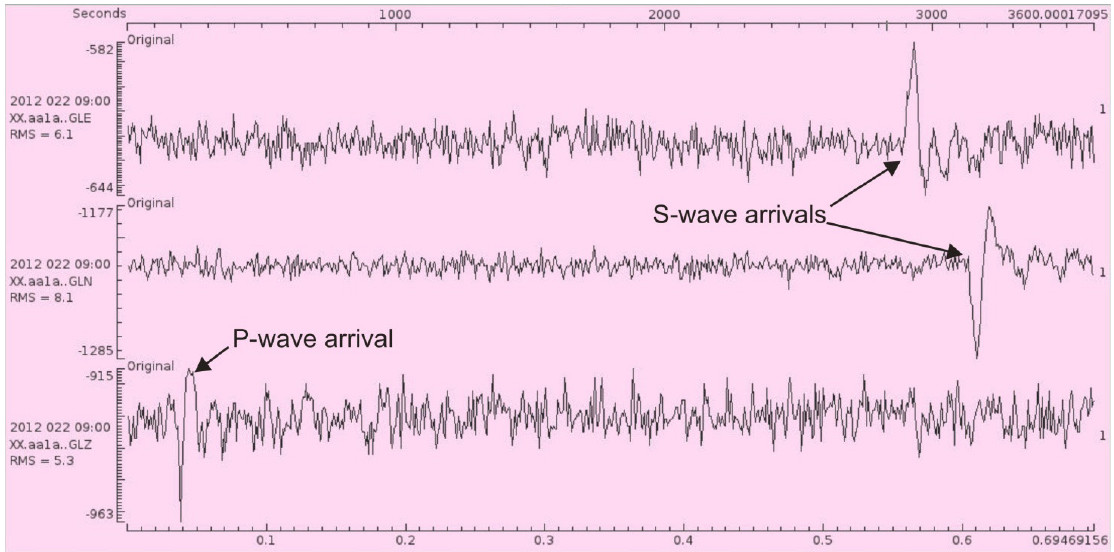
Data recovery seems to have been >90% and data quality is as expected for this environment. The only qualification to this statement arises from periods of pervasive noise (see below) which requires further investigation. Bearing in mind the poor record of the GEF high-frequency equipment on earlier projects, this success is very welcome. Ambient noise in this environment is generally very low. This was of particular benefit here, as many of the bed events are low amplitude. Examples of bed events are given in Figure 5. Identification is usually straightforward, primarily from the P- and S-wave separation and the wavelet characteristics (discrete, with sharp onsets and short duration). Some characteristics of the basal events are indicated in Table 1.

Noise
a) Pervasive noise. All 5 stations in the India Array have unusually noisy periods (Fig. 6), comprising nearly 30% of the total recording time in some cases. Any basal seismicity occurring during these periods will be difficult to identify. Noisy periods generally lasted between 1 hour and 2 days and often occurred on many stations (up to all 5) simultaneously.
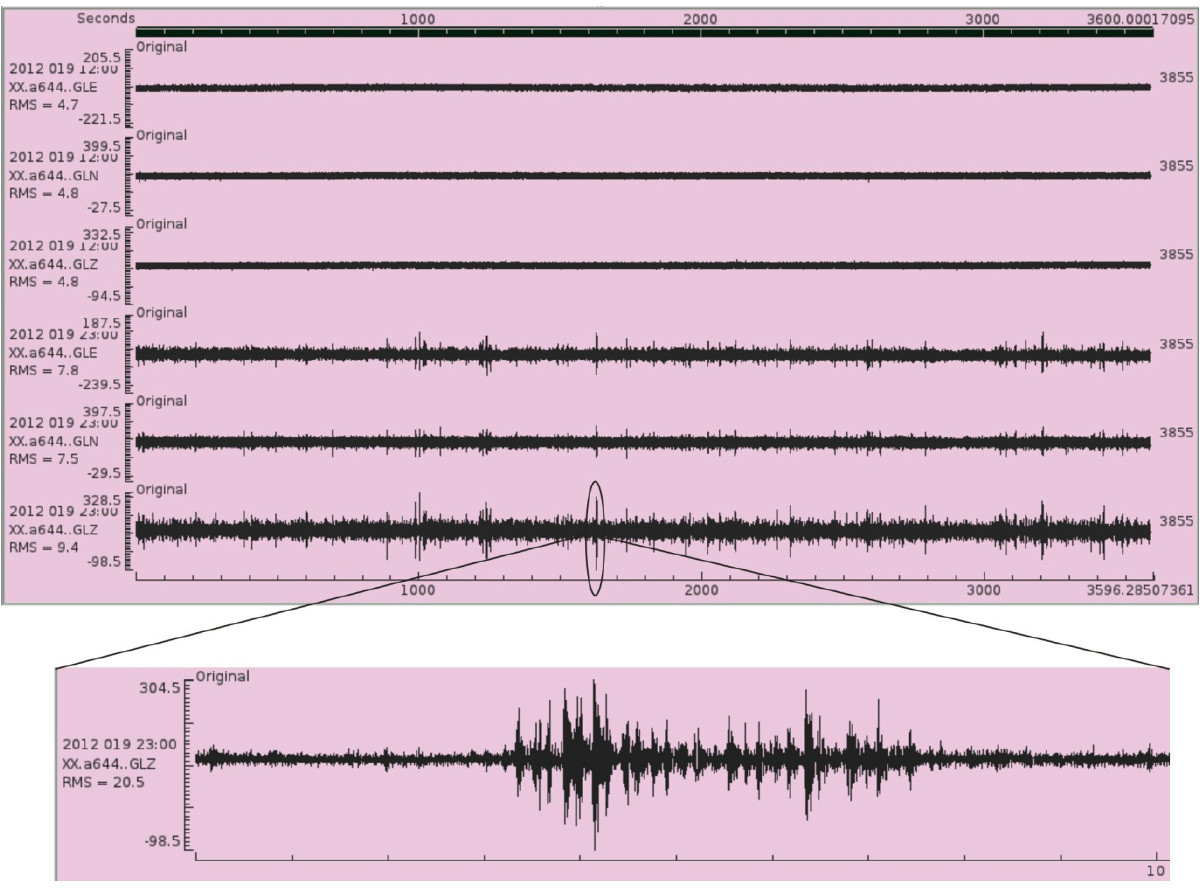
Table 1 gives some of the basic characteristics of this noise. In addition, arrival separations (P-, S- and surfacewaves) suggest sources perhaps within only a few hundred metres of a station. Most significantly, the source of this noise does seem to be environmental, not instrumental. In particular, the solar panel regulators are not implicated, some models of which have given concerns previously. The actual origin of this noise is currently uncertain, however, one likely cause is related to the strain regime of the ice. The survey area is only a few kilometres upstream from transverse crevasses (which then occur with increasing intensity all the way to the grounding line, >100 km downstream) and over time, crevasses begin to open progressively further upstream. This noise could be related to the extensional strain within the ice as it accelerates towards this crevassed zone. (Note, although we expect it will be only a short time (<5 years) before our survey area itself becomes crevassed and difficult to work in, for the period of this project it was safe, both for personnel and equipment.)
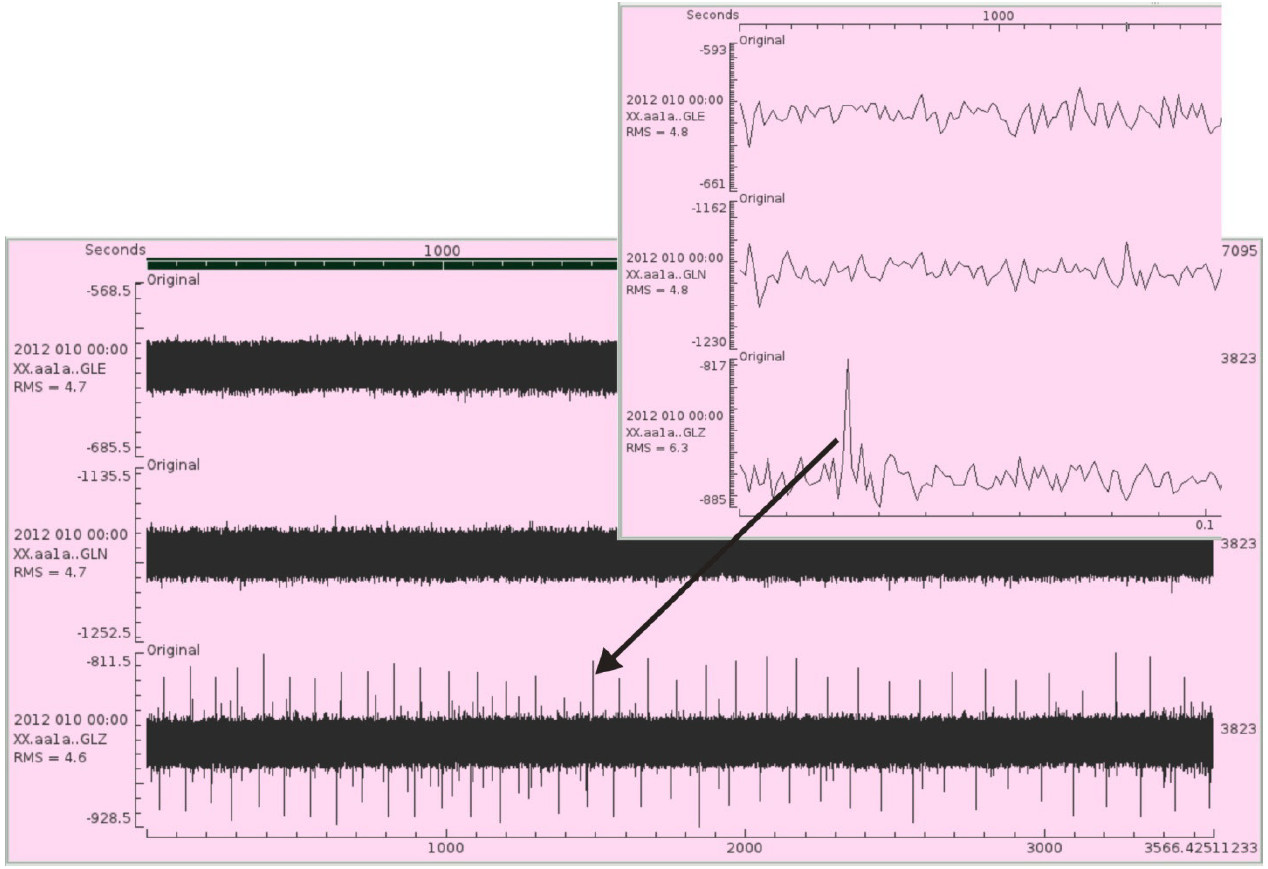
b) Discrete noise (DAS AA1A). One station shows regular spikes on the vertical channel throughout the whole recording period (Fig. 7). Alternating positive and negative deviations repeat periodically on this channel. The source of this noise is not clear but its constant, repetitive nature, presence on only one channel of one instrument and the spikes’ nature (only one deviation direction, each time) suggests it could be instrumental. SEIS-UK are already investigating this.
Processing
All 5 stations have been processed to identify events from the glacier bed. Identification criteria used were:
- P and S waves present
- P-S separation consistent with source close to the glacier bed
- Sharp onset and short-duration wavelet
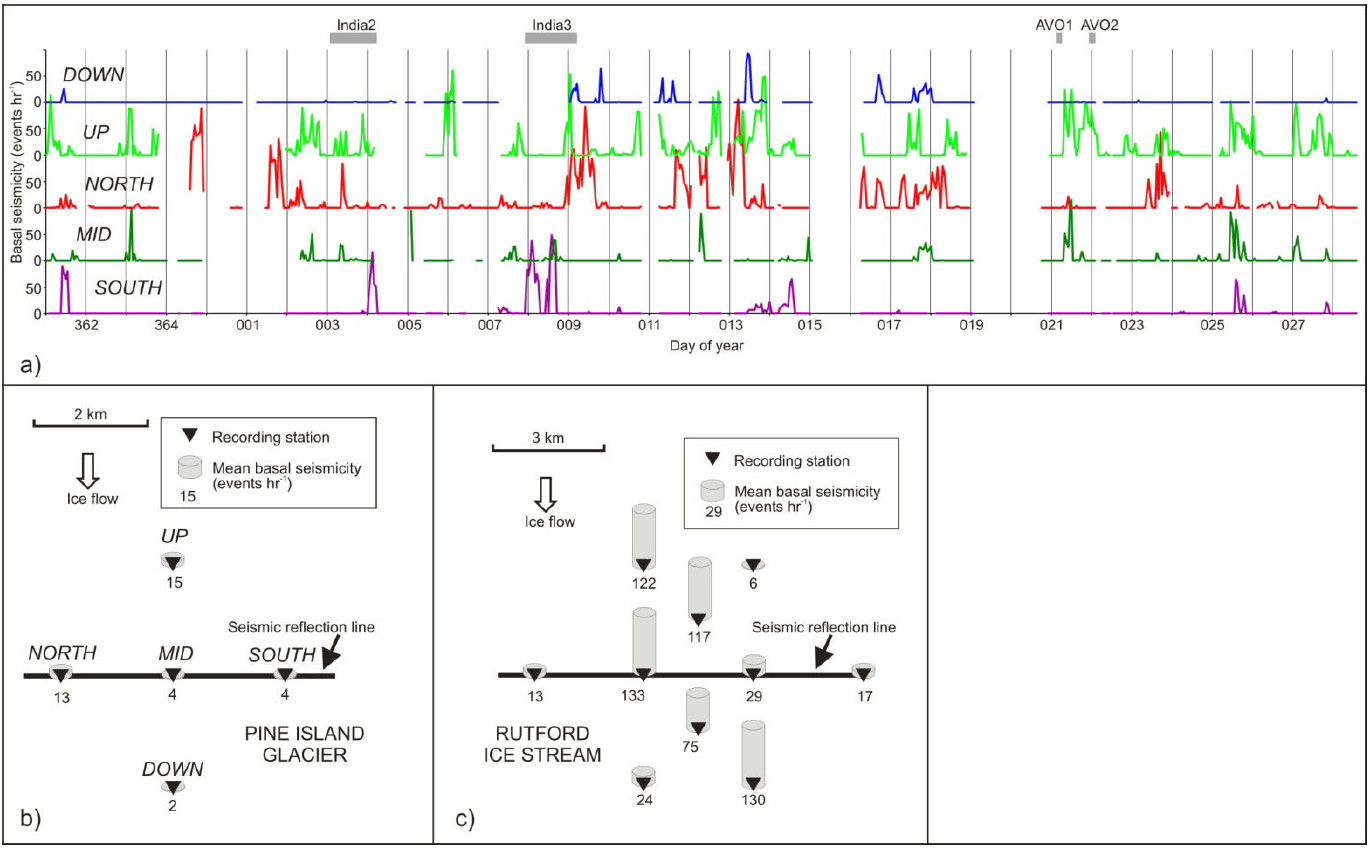
All identification has so far been done manually. Automatic picking may be attempted in future but it is possible the majority of events could prove too weak for this to be particularly effective. Figure 8 shows the basic basal seismicity characteristics at each station in the India Array. (Note that this figure takes no account of wavelet amplitude so is not an indication of total energy.) As observed elsewhere2, shear-wave splitting can be considerable (up to ~10%) as ice can be strongly anisotropic (Fig. 9)
Interpretation and preliminary findings
Mean levels of basal seismicity in this region of PIG are low. This is well illustrated by a comparison with a similar experiment on Rutford Ice Stream (Fig. 8) where seismicity at some stations is an order of magnitude more frequent. This contrast is even greater, considering that Rutford Ice Stream moves at only 1/3 the speed of PIG (350 m/a compared with >1 km/a) and that bed events on Rutford Ice Stream are not only more numerous, but also higher in amplitude and energy. One implication of this observation is that friction at the ice-bed interface on PIG may be much lower that on other ice streams (in agreement with current modelling studies), a factor which could be associated with its current vulnerability to rapid change.
Conclusions
Although there is much more that can be done with these data, they have already delivered their primary objective; basal seismicity on Pine Island Glacier is generally low and most events are low energy. This suggest that the physical state of the basal sediment varies to only a low degree between relatively active and quiescent periods, and that, taken overall, the active seismic experiments can be interpreted with few concerns for any time-varying nature of the bed. However, there is also valuable detail in the seismicity time-series which may still prove relevant (Fig. 8):
- Slight increase in overall seismicity during India2 Line acquisition
- One particularly active station during India3 Line acquisition
- Very low seismicity during AVO1and AVO2 acquisition, except for one station during AVO2.
Similar studies from other polar glaciers have shown that monitoring basal seismicity can distinguish between areas of deforming sediment and sliding at the glacier bed3. Preliminary comparison with the seismic reflection data from PIG (Fig. 4) is consistent with this; the reflection coefficient indicates that the bed is soft, watersaturated sediments everywhere along this line, as suggested by the low levels of basal seismicity.
Current Progress and Future Plans
Progress on the whole Pine Island Glacier project has been delayed by the departure, and non-replacement, of the person appointed to work on the data. This also affects the data acquisition reported for Loan 927, as well as a number of other complementary data sets, all designed to address the on-going dynamic changes and basal conditions on PIG. As a result, the plan for future progress with these current data has been revised. The GPS and active seismic data will be incorporated into projects of iSTAR, NERC’s Ice Sheet Stability Research Programme. The passive seismic data from this loan will be taken over by NERC PhD student Emma Smith (jointly supervised by BAS and University of Cambridge), currently working on a similar dataset acquired from Rutford Ice Stream4, including event location, fault-plane solutions, anisotropy investigation (from shear-wave splitting) and further consideration of the pervasive noise (Fig. 6).
References
-
Rignot, E., et al. (2008), Recent Antarctic ice mass loss from radar interferometry and regional climate modeling, Nature Geosci. 1, 106 110. ↩
-
Harland, S.R. et al. (in press), Annals of Glaciology, 46. ↩
-
Smith, A. M. (2006), Geophys. Res. Lett., 33, doi:10.1029/2006GL028207. ↩
-
Pritchard, H.D. et al. (2010), GEF Loan Report, Loan No. 852 ↩
Appendix
