Scientific Report 935
This report is also available as a PDF document .
Abstract
GPR and high frequency seismometers were used to:
-
Survey the glacier depth (0-180m), calculate the radar velocity through ice (0.174m ns-1), investigate the nature of subglacial thrust sheets (3m thick slices moving at 3m per year).
-
Characterise the seismic signal and their sources. Seismic signals could be passed through a low pass filter of 250 MHz with little data loss. Five basal seismic events were identified, which occurred on warm dry days up to 3 hours after peak temperatures.
Background
The response of glaciers to climate change is poorly understood, and numerical models have failed to predict the rapid ice loss observed (Alley et al., 2005;1 Vaughan and Arthern, 2007;2 IPCC 2007). Recent studies of continuous measurements of glacier velocities have indicated that ice motion is commonly episodic and it has been proposed that this reflects stick-slip motion (Bahr and Rundle, 1996;3 Fischer and Clark, 1997;4 Tsai and Ekstrom, 2007;5 Weins et al., 20086). Seismometers have been used to detect basal slip (Weaver and Malone, 1979;7 Anandakrishnan and Bentley, 19938) and changes in water flow at the glacier base (Métaxian et al., 20039).
The aim of the project was to combine GPR measurements of depth with passive seismic data at Skalafellsjökull, Iceland to understand glacier stick-slip motion.
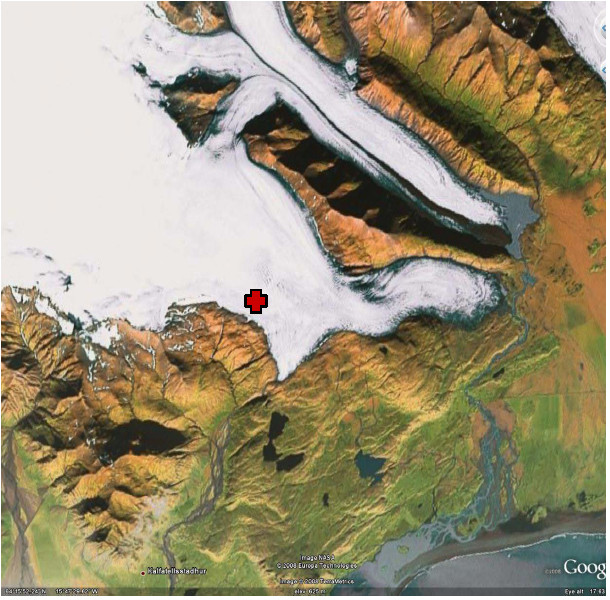
The study was undertaken at Skalafellsjökull, Iceland (Figure 1). This is an outlet glacier of the Vatnajökull icecap resting on Upper Tertiary grey basalts with intercalated sediments (Jóhannesson and Sæmundsson, 199810). This glacier is approximately 100km2 and 25km long (Sigurðsson, 199811). Our study site was located at 792m a.s.l. where the glacier was flat and crevasse free.
GPR
Survey procedure
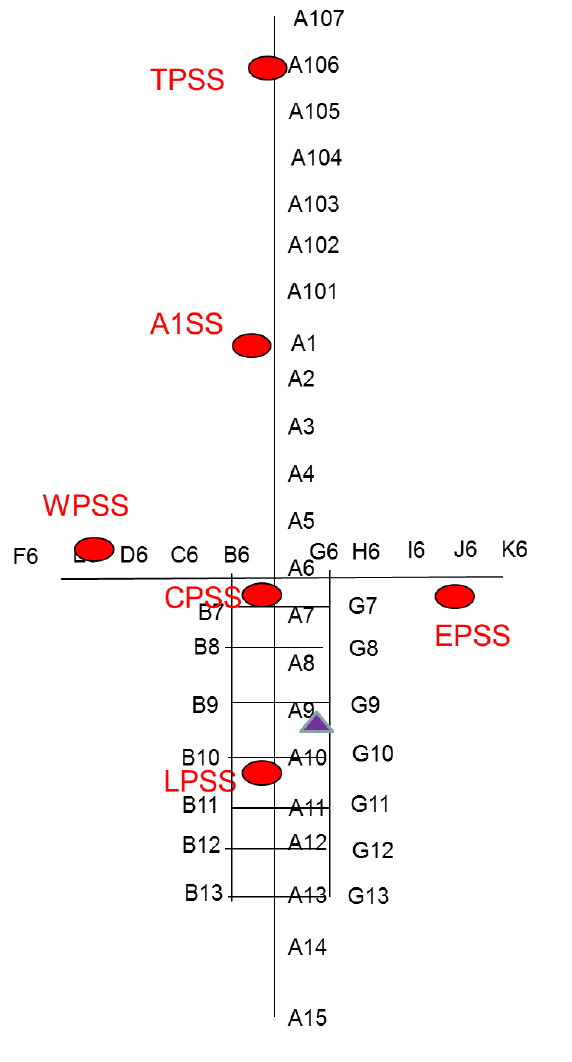
The system used for the survey was a Sensors and Software Pulse Ekko 100 with a 1000V transmitter system. Initially a common offset survey was performed using 50 MHz antennas on a grid pattern, with a 2 m antenna spacing and 0.5 m sampling interval. A custom built sledge was constructed to hold the antennas at the correct distance apart and allow movement along the transect (Figure 2). In addition a common midpoint survey (CMP) was also made using the 50 MHz antenna (between point A11-A12). The location of the transects were recorded using a TOPCON differential GPS.
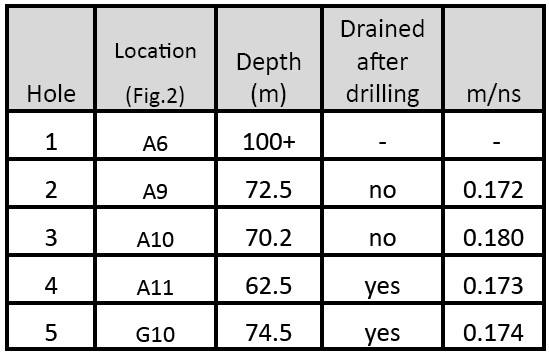
Boreholes were drilled with a Kärcher HDS1000DE hot water drill and videos were taken with a custom made CCD camera using infra-red (900nm) illumination. The depths of the boreholes were measured with the drill hose and camera cable.
Processing and Modelling
The data was analysed using the software package ReflexW. For the initial analysis of the common offset surveys, the following processes applied:
the elimination of low frequency noise (de-wow filter), the application of a SEC (spreading and exponential compensation) gain to compensate for signal loss with depth (Figure 3a). Radar-wave velocity in the whole ice column can be calculated from the measured glacier depths:
[1]
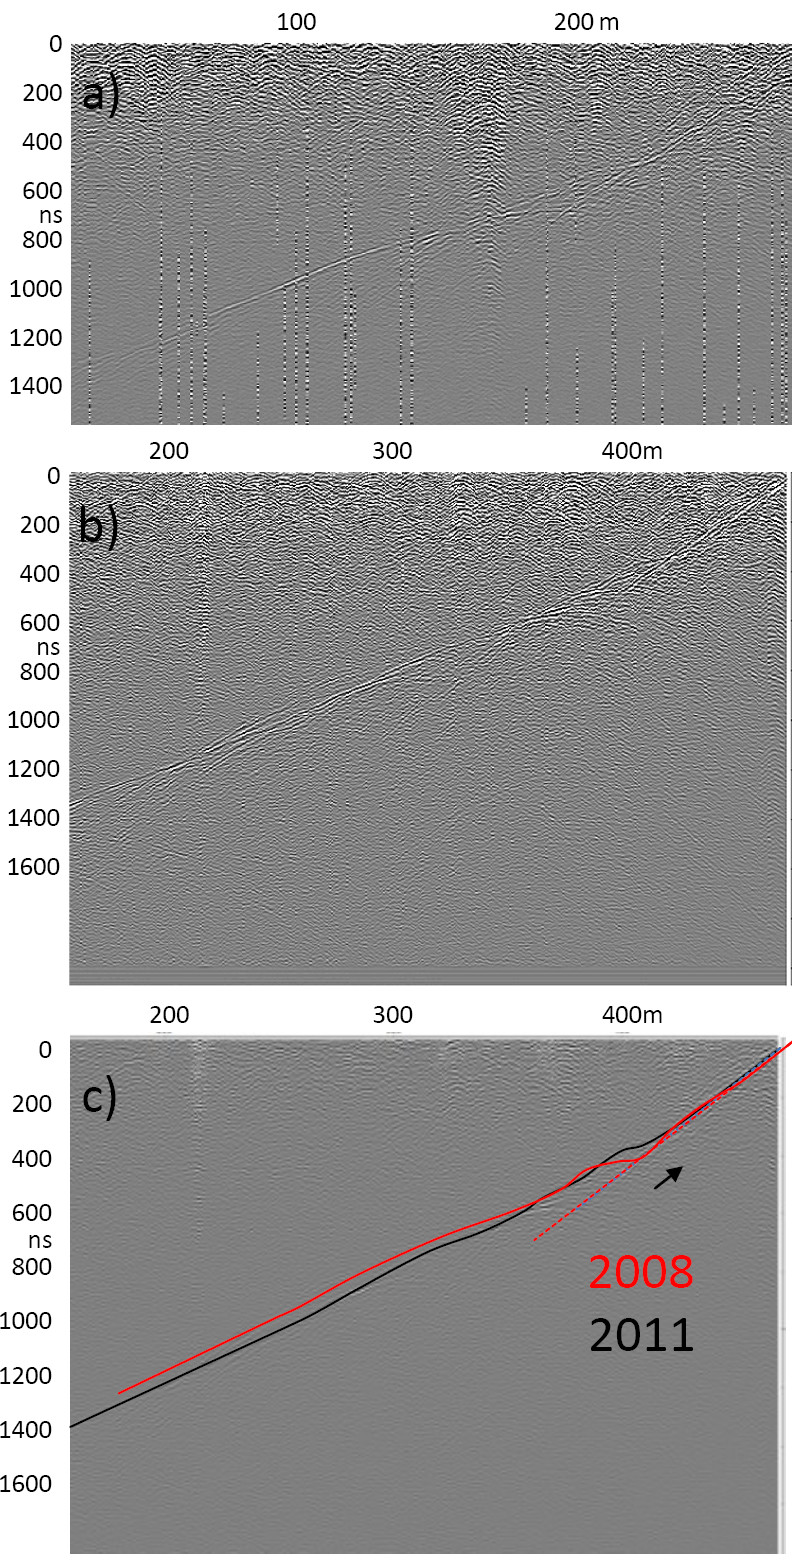
Once the radar-wave velocity was established we carried out a diffraction stack migration and applied a topographic correction to the data (Figure 3b).
Interpretation to date
Figures 3 and 4 shows a radargram along Line A, where the bed of the glacier is very clear. The average value for the radar-wave velocity through was 0.174m ns-1 (s.d.= 0.003) with an error of 2.2%. This is the same as the error discussed in detail by Barrett et al. (2007)12. The relatively small standard deviation implies the boreholes were relatively straight and thus reflected the true ice depth.
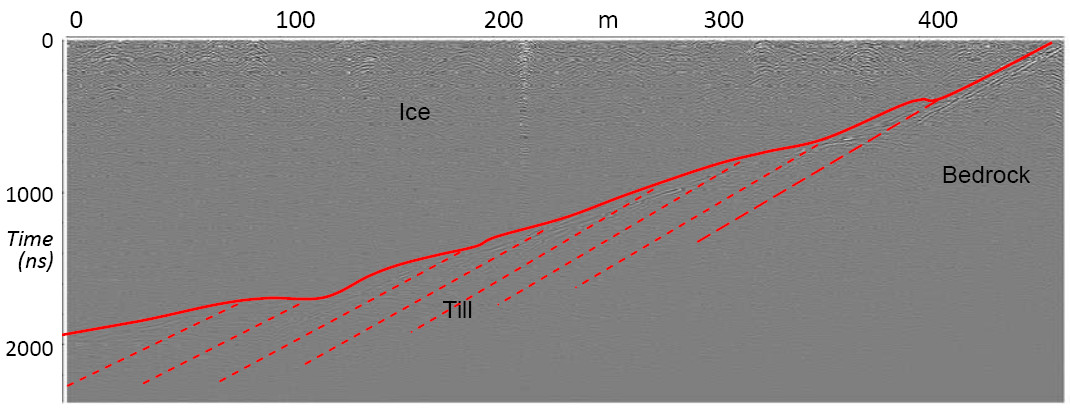
The base of the glacier is dipping to the west and a strong second reflection is evident beneath the first reflection in all the radargrams. Towards the glacier margin (400m-465m), there is a sharp boundary with a relatively steep angle (approximately 25°). Upglacier, this boundary has a lower angle (approximately 12°) and shows a series of lines at a steeper angle below it. These lines are present after the data has been migrated, and both before and after topographic correction. The strongest line appears to represent an extension of the sharp reflection seen at the margin.
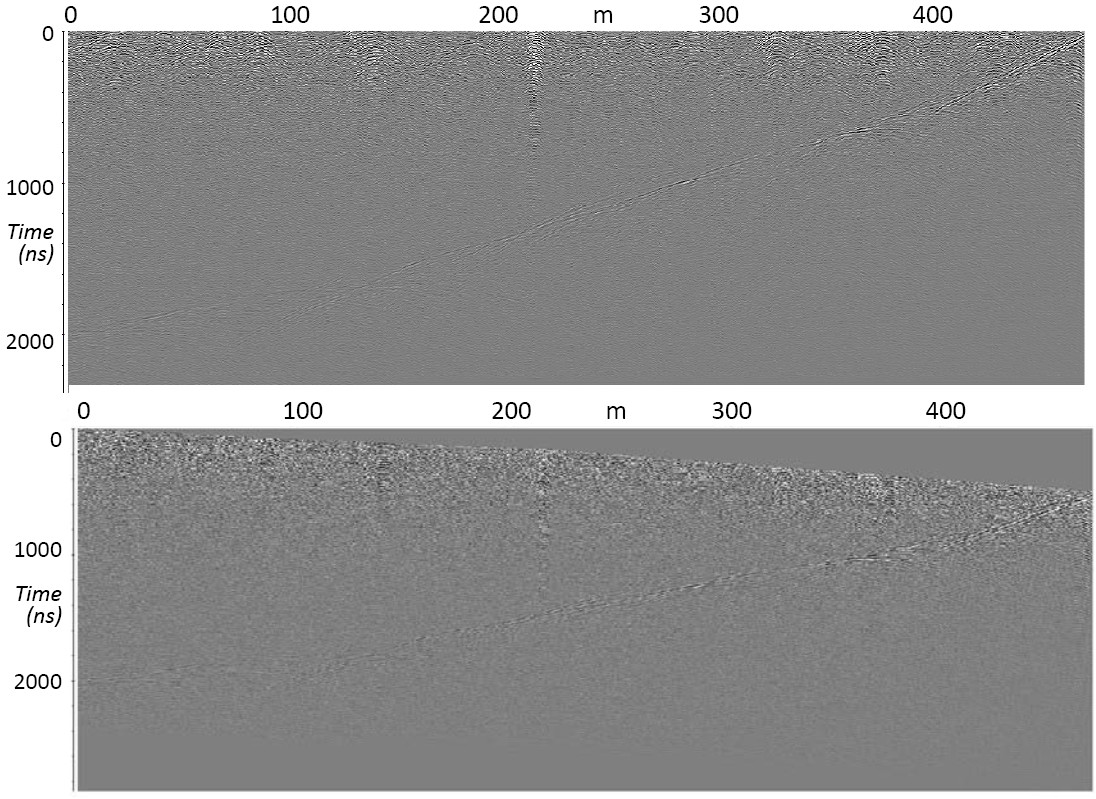
We interpret the strong line as the bedrock (Figure 4) which can be observed in the field at the glacier margin, and the material beneath to represent a till. Within the till are a series of lines with an average separation of 70ns.
We can estimate radar-wave velocity through different materials as follows (Looyenga, 1965;13 Macheret et al.,1993;14 Macheret and Glazovsky, 200015):
[2]
where P is the relative percentage and ε is the permittivity of the different materials (εi = 3.19 (ice), εw = 86 (water), and εa = 1 (air)). The permittivity of debris (d) is taken as 8.5 because at Skalafellsjökull the debris is mostly composed of basalt, whose constituents are pyroxene (Martinez and Byrnes, 2001;16 Olhoeft, 198917).
Using these values we can estimate radar-wave velocity of dry till or bedrock to be 0.101m ns-1 and saturated till (>20% water) to be 0.08m ns-1, which is similar to that found for till by other researchers (Murray et al., 199718).
We suggest that the till comprises a series of till ‘rafts’. Using the radar-wave velocities calculated above, the reflections have a mean separation of 3.5m for dry till, or 2.7m for saturated till.
Preliminary findings
The radar-wave velocity (0.174m ns-1) was similar to that found in 2008 (0.177m ns-1) (Hart and Martinez, 200919). Both these results are high, as the normal value for temperate ice is 0.16m ns-1 (Davis and Annan, 198920). This indicates a high proportion of voids within the glacier.
The presence of subglacial till rafts was also recorded at the site in 2008, where features of similar size and scale were observed in the foreland (Hart and Martinez, 200919). Since the GPR lines were taken in a similar location it is possible to measure the displacement of the till rafts over a three year period.
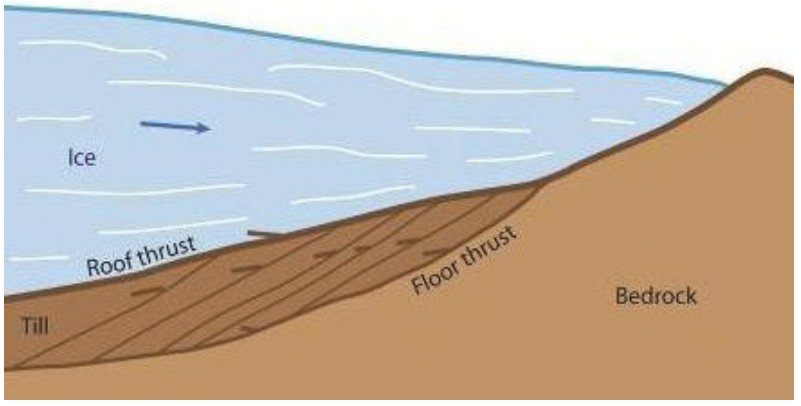
This deformation style is typical of a duplex structure, with the glacier representing the roof thrust and the bedrock surface the floor thrust (Figure 6). The rafts within the duplex (horses) must occur along zones of weakness, as a result of lubrication. In this style of deformation, each thrust gets younger towards the foreland (“in sequence thrusting”), and each raft represents a thrust sheet.
There have been almost no studies of the rate of active subglacial thrusting beneath modern glaciers, although such features are commonly recorded from Quaternary sites (Hart, 1990;21 van der Wateren, 199522). Truffer et al. (2000)23 reported shear at depth beneath Black Rapids glacier, Woodward et al. (2003)24 has described subglacial compressive thrust features from Kongsvegen, Svalbard, and Benediktsson et al. (2008)25 calculated the formation of a recent surge push moraine in 5 days.
The Seismic survey
Survey Procedure
Six geophones (SAQS data recording units) were installed on the glacier surface (Figure 2). The systems were approximately 90 m apart from their nearest neighbour so that the spacing between them was approximately equivalent to the ice thickness in the deployment region. The GEF geophones were mounted on white plywood boards 0.5 m square which were dug down into the ice approximately 0.3 m and placed level and covered with ice chips. They ran at a 1000 Hz sampling rate and were re-levelled and re-aligned with true north each day as required. Dr Victoria Lane of SEIS-UK kindly initially trained the team for field use of the equipment.
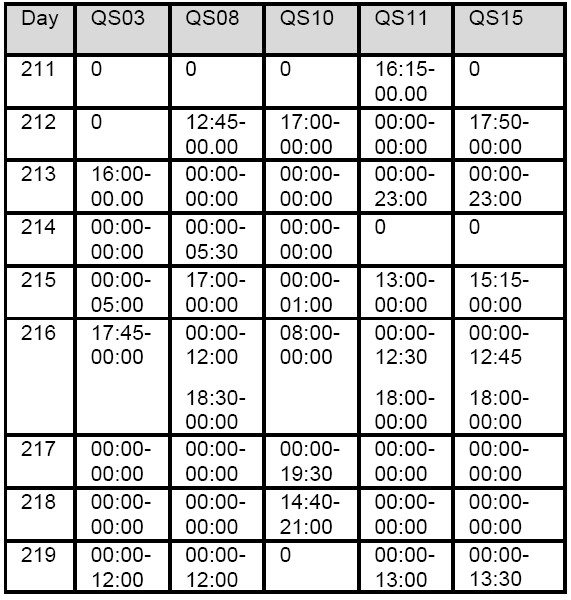
Six stations were set up but the firewire disk of station A1SS (QS13) failed to download on return from the field and SEIS UK were not able to retrieve the data. The other 5 stations were recording for variable amounts of time due to power availability and the need to cease recording during geophone re-levelling and whilst the hot water drill was operating (Table 2). Overall, the recording occurred during 76% of the 8 days available for the pilot study. Presence of other seismic noise, such as wind, rain and running water may have made some of the analysis (outlined below) more difficult.
The different seismic stations of the array require slightly different band pass filtering frequencies, STA (short term average rms) and LTA (long term average rms) values and threshold ratio (STA of data/LTA of data) values to automatically pick out the P waves due to variations in sensors and environmental noise. Generally around 10 and 100 band pass filter frequencies, threshold ratio around 10.0 and STA and LTA of 0.005 and 0.1 seconds respectively picks out the P wave reasonably well in the stations for the example event. The P wave pick times are generally located part way through the P wave up kick but lower thresholds and adjustments in the LTA/STA create more false P wave picks.
Table 3 shows the P and S wave arrival times at each station for one example basal event. The whole event duration is less than second. P wave period around 0.02 seconds (approximately 50 Hz frequency). The difference in arrival times of P waves between seismic stations for the example event varies between 0.002 and 0.019 seconds. The difference in arrival times of P waves and S waves at the various seismic stations can be used to determine the location and depth of the event.
Interpretation to date
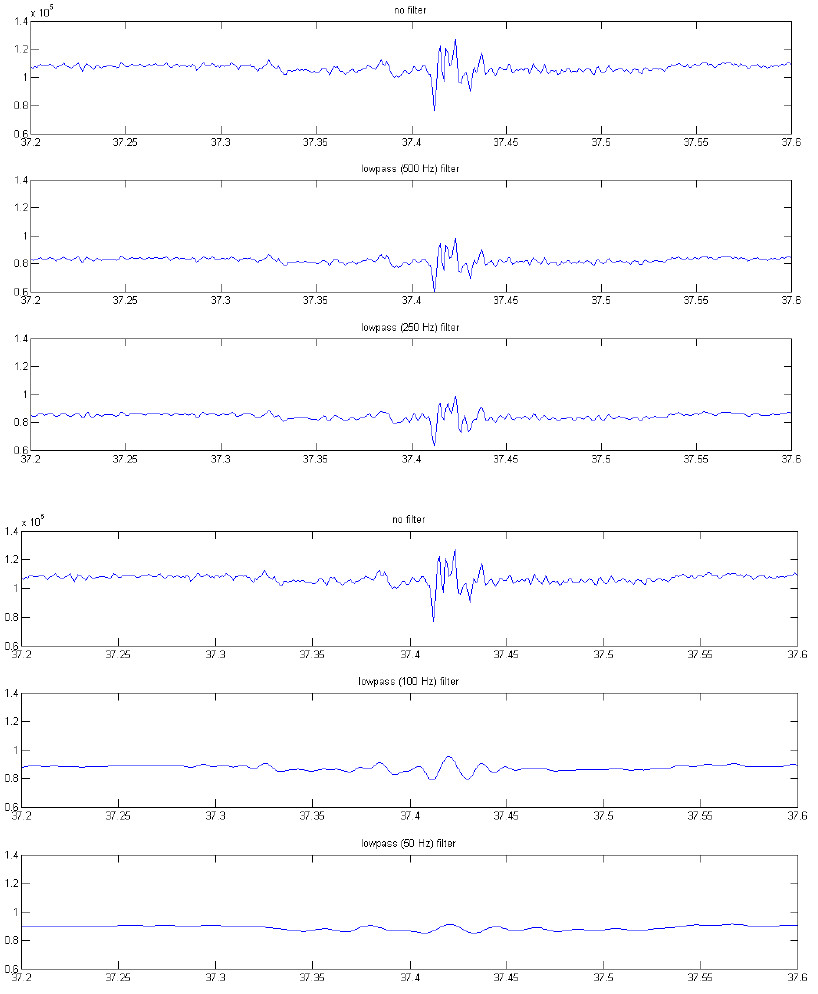
Filtering - One aim of the pilot study was so integrate the data to enable the production of custom made Glacsweb borehole geophones for installation in 2012 to last all winter. These will be based on the technique of Walter et al (2008)26, in that triggering of recording will only occur above a certain threshold. A study was made of the filtering of the signal, as storage capacity in such a system is limited. Figure 7 shows the impact of low pass filtering at different frequencies (500, 250, 100 and 50 Hz) along with the unfiltered signal of the Z component of QS15. The 500 and 250 Hz low pass filters still show the event fairly well, but in the 100 and 50 Hz low pass filtered data the event is pretty much lost.
Given our initial analysis the threshold ra-tio of 10, LTA of 0.8 seconds, STA of 0.08 seconds, number of components triggered value of between 4 and 10 (i.e. one three component geophone cannot initiate recording), a total record time of 2 seconds and pre-trigger record time of 0.5 seconds (as used by Walter et al. 200826) was determined for the Glacsweb geophones. For lower sampling frequencies, the thresholds will also need to be set lower.
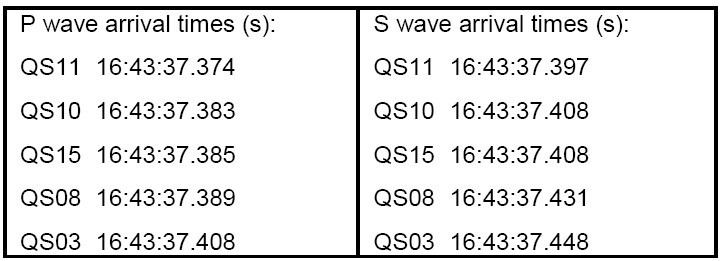
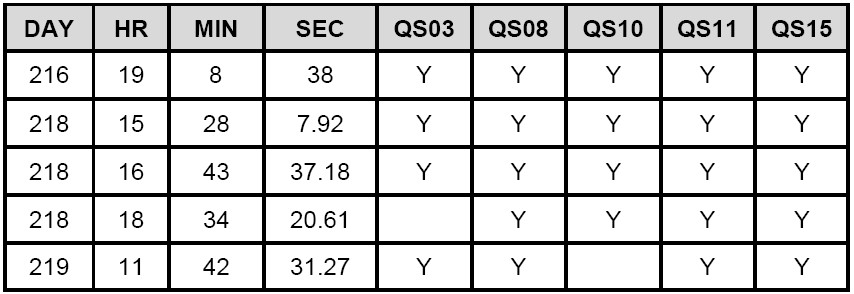
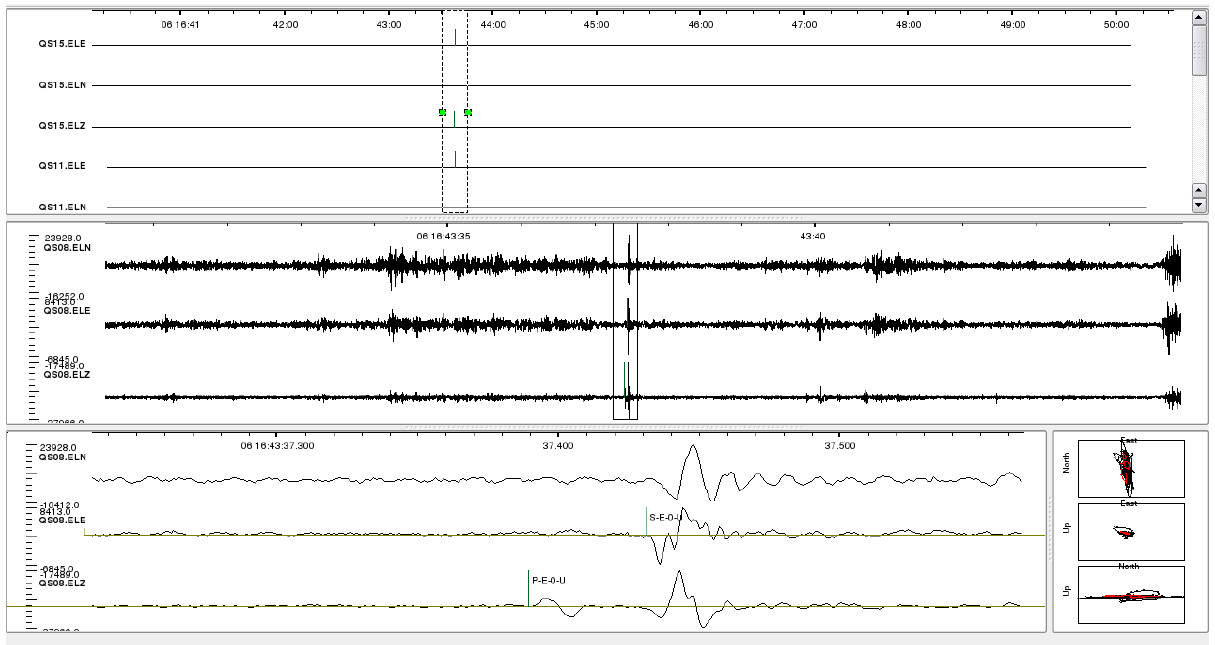
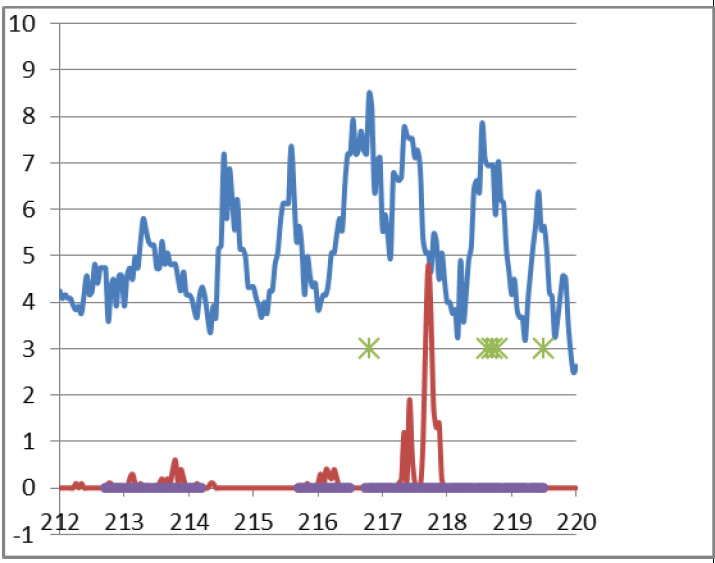
Basal events - A study was also made of the presence of basal seismic events. After analysis it was suggested there were at least 5 basal events that occurred on at least 4 stations (Table 4). These occurred within the virtually continuous recording period from 17.00 hr day 215 to 12.00 hr day 219. Figure 8 shows an example of the event 16:43:37
Although 5 events are visible across the array, their location cannot be reliably found, even manually, using the SDX software. This is because it is difficult to reliably identify P and S waves (as well as the surface wave), since they are very close together. The synthetic P and S phase arrival times produced in the running of the SDX software location routine do not match up well with the expected phase arrival time locations. So although the exact location of the seismic events cannot be determined, we know they occurred and within the order of 0-250 m depth, which is similar to the depth recorded from the GPR survey (0-200m).
Preliminary Findings
Figure 9 shows the air temperature, rainfall, recording time and seismic events during the fieldwork period. It appears that the seismic events occur during days of relatively high temperature (and low rainfall), over 8°C, and very soon after peaks in temperature (9mins – 3hrs 28mins). These events do not seem to be related to high rainfall events (unless the noise of the rain disturbed the signal). If these events represent stick-slip events then they show that the water melted from the glacier surface travels quickly to the base of the glacier where it lubricates the bed allowing it to rapidly slide.
Conclusion
The GPR showed a similar pattern to 2008, with a high radar velocity through ice (suggesting a high level of pore spaces in the glacier), and a series of subglacial till thrust sheets. It was shown these rafts had moved approximately 3m per year, and so these are a rare example of active subglacial shearing at depth. The pilot seismic study provided some useful data for the development of borehole based geophones for use in future years (with limited power due to the need to over winter), and the establishment of at least 5 basal seismic even. It is not known whether these events occurred at the base of the glacier or at the base of the till rafts, however these events occurred almost immediately after high temperatures events indicating that water could pass rapidly from the glacier surface to the bed.
Acknowledgements
The authors would like to thank the Glacsweb Iceland 2011 team for help with data analysis and collection (Dr Victoria Lane, Charles Pethica, Hannah Meehan, Philip Basford, Jeff Gough and Dr Alfred Gong). Thanks also go Bob Smith in the Cartographic Unit for figure preparation. This research was funded by Leverhulme.
References
-
Alley, R.B., Clark, P.U., Huybrechts, P. and Joughin, I. (2005) Ice-sheet and sea-level change. Science 310, 456 460. ↩
-
Vaughan, D. G. and Arthern, R. (2007). Why is it so hard to predict the future of ice sheets. Science, 315, 1508 1510 ↩
-
Bahr, D. B. and Rundle, J. B. (1996). Stick-slip statistical mechanics at the bed of a glacier. Geop. Res. Let. 2, 2073-2076. ↩
-
Fischer, U. H. and Clarke, G. K. C. (2001). Review of subglacial hydro-mechanical coupling: Trapridge Glacier, Yukon Territory, Canada. Quaternary International, 86, 29-44. ↩
-
Tsai, V.C. and Ekstrom, G. (2007). Analysis of glacial earthquakes. J. Geophys. Res. 112, F03014. ↩
-
Wiens, D.A., Anandakrishnan, S., Winberry, J.P. and King, M.A. (2008). Simultaneous teleseismic and geodetic observations of the stick-slip motion of an Antarctic ice stream. Nature, 453 (7196), 770-774, doi:10.1038/nature06990 ↩
-
Weaver, C. S. and Malone, S. D. (1979). Seismic evidence for discrete glacier motion at the rock-ice interface, Journal of Glaciology, 23(89), 171-183. ↩
-
Anandakrishnan, S. and Bentley, C. R. (1993). Micro-earthquakes beneath Ice Streams Band C, West Antarctica: observations and implications. Journal of Glaciology, 31 (133), 455-462. ↩
-
Métaxian, J-P., Araujo, S., Mora. M. and Lesage, P. (2003). Seismicity related to the glacier of Cotopaxi Volcano, Ecuador. Geophysical Research Letters, 30 (1483), doi:10.1029/2002GL016773 ↩
-
Jóhannesson, H. and Sæmundsson, K. (1998). Geological Map of Iceland, 1:500 000: Bedrock Geology, Icelandic Institute of Natural History. ↩
-
Sigurðsson, O. (1998). Glacier variations in Iceland 1930-1995. Jökull, 45, 3-25. ↩
-
Barrett, B. E., Murray, T., Clark, R. and Matsuoka, K. (2008). Distribution and character of water in a surge-type glacier revealed by multifrequency and multipolarization ground-penetrating radar. J. Geophys. Res., 113, F04011, doi:10.1029/2007JF000972. ↩
-
Looyenga, H. (1965), Dielectric constant of heterogeneous mixtures. Physica, 31 (3), 401-406. ↩
-
Macheret, Y.Y., Moskalevsky, M.Y. and Vasilenko, E. V. (1993). Velocity of radio waves in glaciers as an indicator of their hydrothermal state, structure and regime. Journal of Glaciology, 39, 373 384. ↩
-
Macheret, Y. Y. and A. F. Glazovsky (2000), Estimation of absolute water content in Spitsbergen glaciers from radar sounding data. Polar Research, 19, 205-216. ↩
-
Martinez, A. and Byrnes, A.P.(2001). Modeling Dielectric-constant values of Geologic Materials: An Aid to Ground-Penetrating Radar Data Collection and Interpretation. Current Research in Earth Sciences, Bulletin 247, part 1. ↩
-
Olhoeft, G. R. (1989), Electrical properties of rocks. In, Physical Properties of Rocks and Minerals, Y. S. Touloukian, W. R. Judd, and R. F. Roy (eds.), New York, New York, Hemisphere Publishing Corporation, 257 329. ↩
-
Murray, T., Gooch D.and Stuart, G.W. (1997). Structures within the surge-front at Bakaninbreen, Svalbard using ground penetrating radar, Annals of Glaciology, 24, 122-129. ↩
-
Hart, J. K. and Martinez, K. (2009). A GPR investigation of Skalafellsjökull, Iceland. NERC GEF report, 6pp. ↩ ↩2
-
Davis, J.L. and Annan, A.P. (1989). Ground penetrating radar for high resolution mapping of soil and rock stratigraphy. Geophysical Prospecting, 37, 531-551. ↩
-
Hart, J. K. (1990). Proglacial Glaciotectonic Deformation and the origin of the Cromer Ridge push moraine complex, North Norfolk, UK. Boreas, 19, 165-180. ↩
-
Van der Wateren, F. M. (1995). Structural Geology and Sedimentology of Push Moraines. Mededelingen Rijks Geologische Dienst., 54, 1-168. ↩
-
Truffer, M., Harrison, W.D. and Echelmeyer, K. A. (2000). Glacier motion dominated by processes deep in underlying till. Journal of Glaciology 46 (153), 213 221. ↩
-
Woodward, J., Murray, T., Clark, R. A. and Stuart, G. W. (2003). Glacier surge mechanisms inferred from ground-penetrating radar: Kongsvegen, Svalbard. Journal of Glaciology, 49, 473-480. ↩
-
Benediktsson, I.O., Möller, P., Ingólfsson, ., van der Meer, J. J. M., Kjærd, K. H., Krüger, J. (2008). Instantaneous end moraine and sediment wedge formation during the 1890 glacier surge of Brúarjökull. QSR 27, 209 234. ↩
-
Walter, F., Deichmann, N. and Funk, M. (2008). Basal icequakes during changing subglacial water pressures beneath Gornergletscher, Switzerland. Journal of Glaciology, 54 (186), 511-521. ↩ ↩2
Conference presentations
Hart, J. K. Edwards, L. Martinez K., Basford P. (2011). Basal and stick-slip motion at Skalafellsjökull measured with the Glacsweb wireless subglacial probe. Abstract C13A-0726 presented at 2011 Fall Meeting, AGU, San Francisco, Calif., 5-9 Dec.
Hart, J.K., Clayton, A., Edwards, L., and Martinez, K. (2011).An investigation of active subglacial thrust glaciotectonics and stick-slip motion from Skalafellsjökull, Iceland. Cryospheric Geophysics meeting, Geological Society, London, Feb 2012
