Scientific Report 928
This report is also available as a PDF document .
Abstract
Dual frequency GPS and gravity measurements were performed during two survey campaigns in southern Bolivia in 2010 using GNSS equipment provided by the NERC GEF facility in Edinburgh. The survey area is located around Uturuncu volcano, in Southern Bolivia. The aims of the campaigns were to determine the local gravity anomaly. In addition, a joint GPS/microgravity network was installed for repeat measurements in the future. These dynamic data will be used to constrain the evolution of mass and density changes beneath Uturuncu. The GEF loans supplement research in the area as part of the NERC standard grant NE/G01843X/1. Both campaigns proved successful in achieving the aim of the surveys and uncertainties in the post‐processing of the data were lower than expected. The local gravity anomaly map shows several local minima, related to Quaternary stratovolcanoes, and no clear correlation to the large Neogene ignimbrite systems. Our first interpretations point to the presence of partial melt beneath the most recently active volcanoes.
Introduction
Almost two decades of ground uplift centred on Uturuncu volcano, in southern Bolivia, have been identified in the past using InSAR techniques [Pritchard and Simmons 2002] 1. The 70 km‐wide footprint of the identified deformation anomaly constrains the source of this deformation at 15 to 20 km depth in the middle crust; in a region that other regional geophysical data indicate is the top of a thick region of hot partially molten rock known as the Altiplano‐Puna Magma Body (APMB) [Schilling et al., 2006 2 and references therein]. The objective of NERC standard grant NE/G01843X/1, which GEF loans 910 and 928 supplement, is to document the dynamics and the characteristics of the intrusion. This requires knowledge of the sub‐surface architecture and regional structures to understand the spatio‐temporal evolution of the system. The approach followed during the first two of several future geodetic campaigns was to perform combined GPS and gravity surveys.
Geologic setting (including field survey site location map)
Uturuncu is a large stratovolcano in Southern Bolivia that towers at 6008 m asl above the Altiplano (around 4100 m). It is part of the Altiplano‐Puna Volcanic Province (APVC), a region of high volcanism dominated by large Neogene ignimbrites that were erupted during a so‐called “flare‐up” period [Salisbury et al., 2010] 3, which sits on top of the aforementioned APMB. Uturuncu is part of the post‐flair‐up activity and it last erupted 270 ka ago [Sparks et al., 2003] 4. Products from Uturuncu are mostly dacitic domes and lavas with andesitic enclaves. Studies in the area have focussed on a more regional scale and, at present, little is known about the magma storage and plumbing systems. Yet, InSAR data suggests that magma may be accumulating beneath Uturuncu.

Survey setup
Static survey
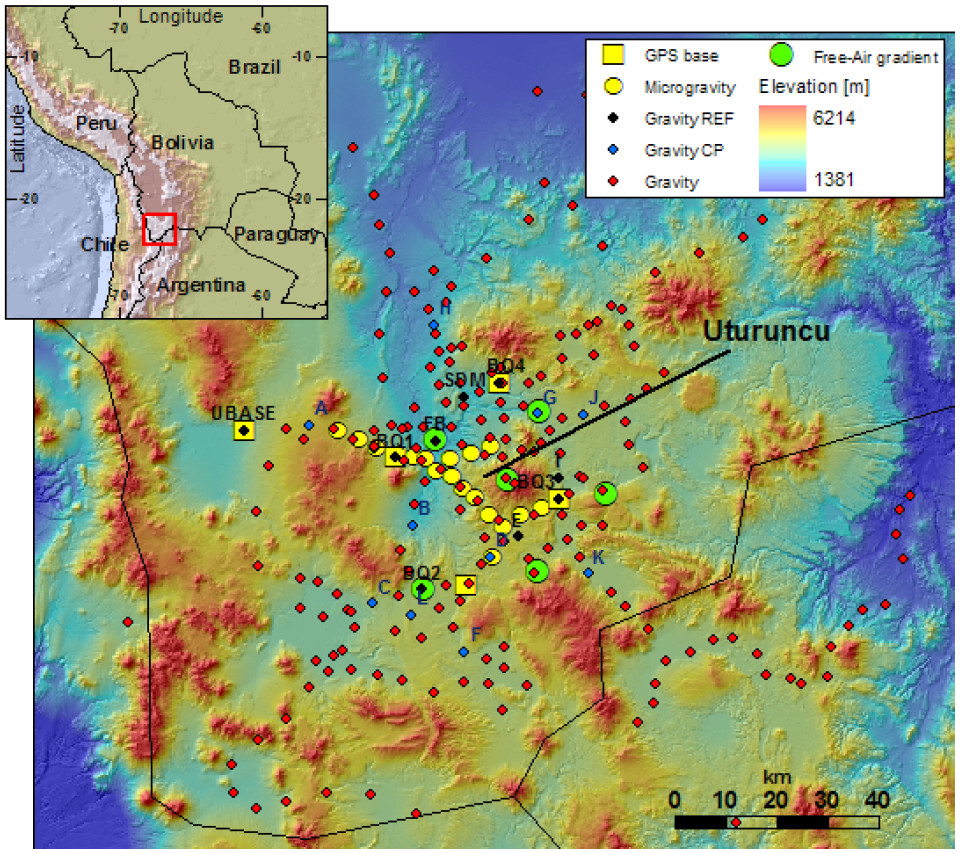
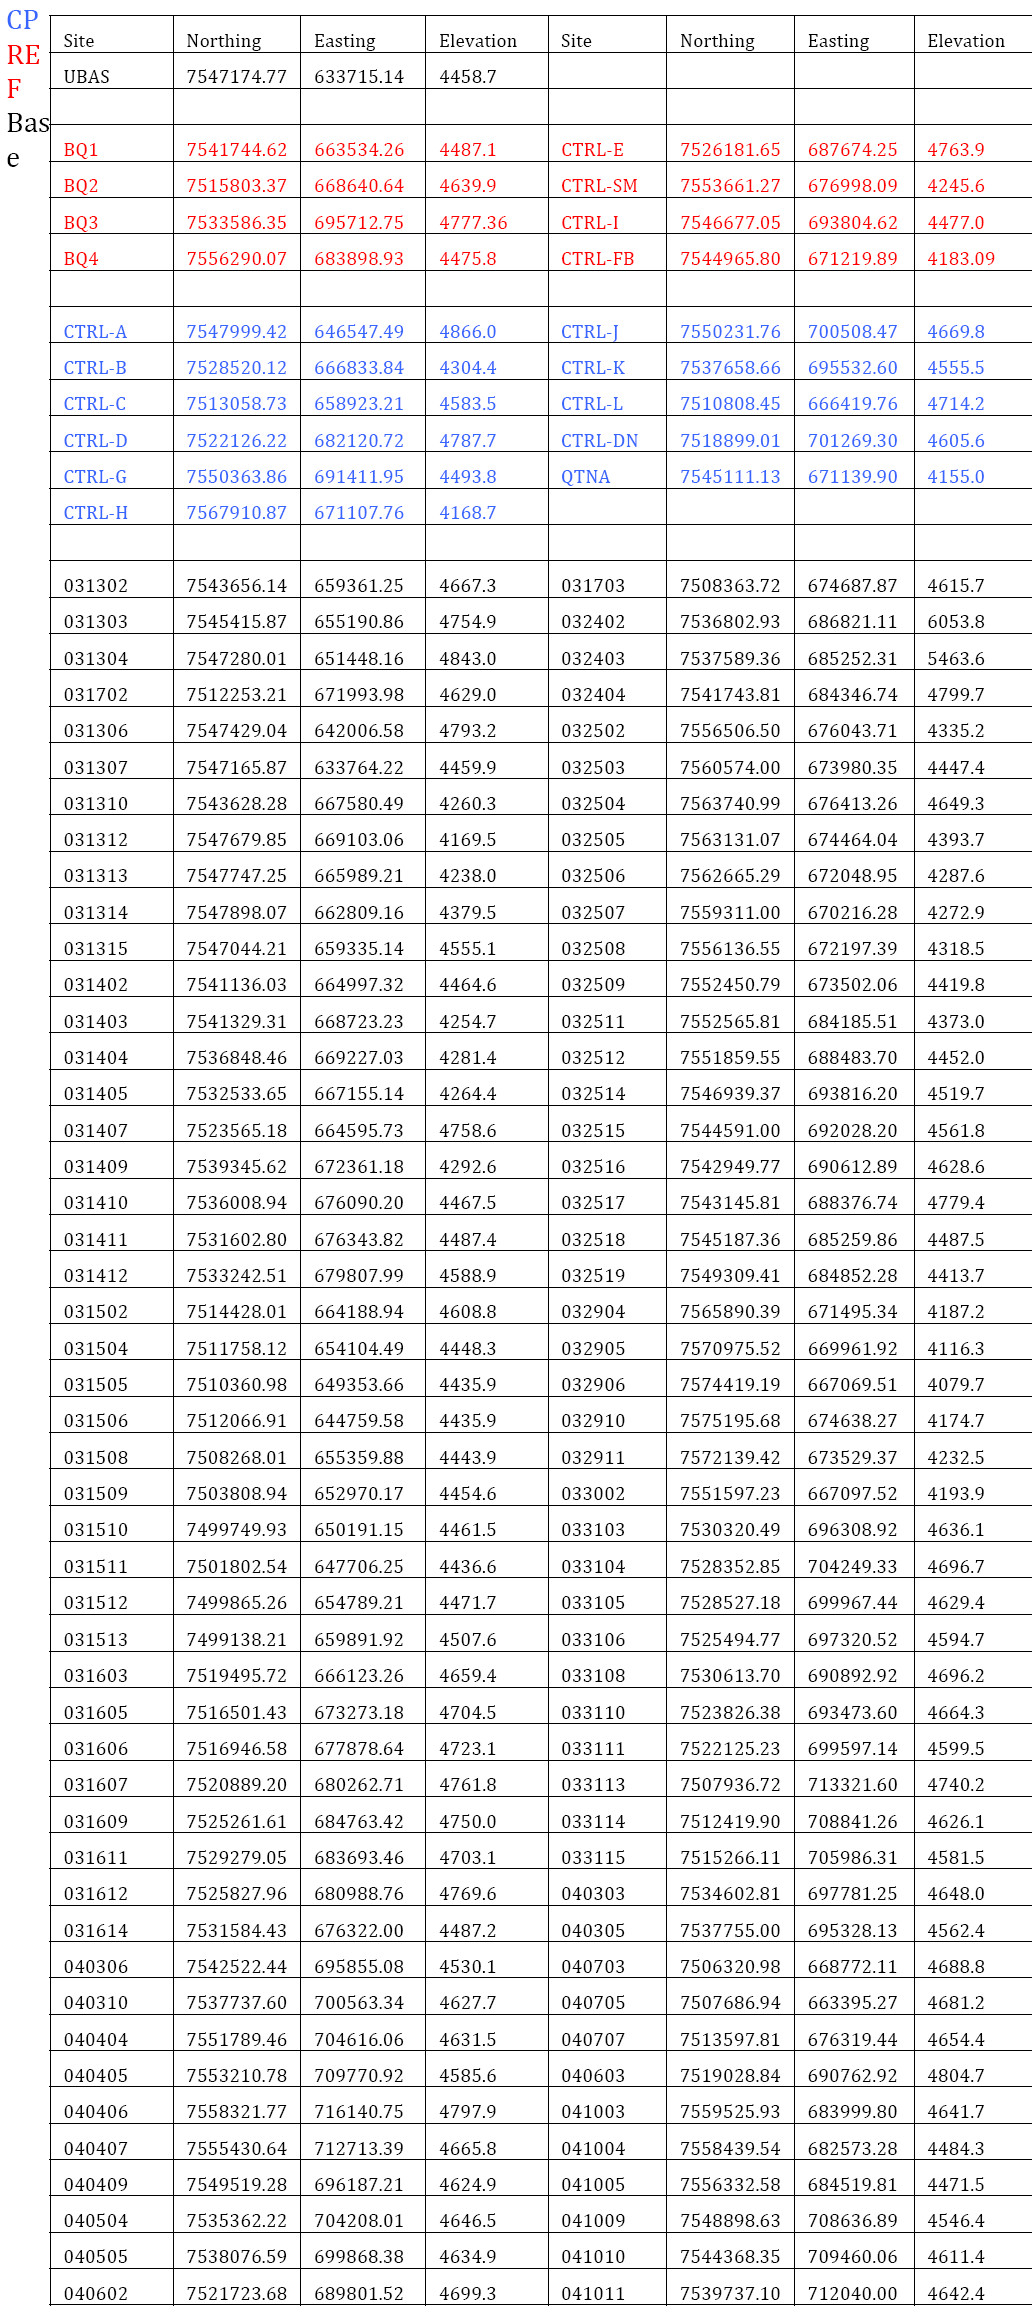
The new local gravity anomaly survey covers an area of 5000 km2 in the South Lípez region in Southern Bolivia (Figure 1). The new survey comprised the co‐location of LEICA 1200 dual frequency GPS and SCINTREX CG5 Autograv spring gravimeter at 141 new locations with average spacing of ~5 km at elevations between 4000 and 6000 m (Figure 1). Benchmark location choice took into account: survey areal coverage, minimal near‐field terrain effect and good accessibility (for short measurement loop times). In the absence of absolute gravity benchmarks, gravity data are relative to an arbitrary gravity reference (UBAS) located about 35 km W of Uturuncu. Elevation data is obtained through static differential GPS. Gravity data is obtained through loops that start and finish at one of the eight reference (REF) or nine control points (CP), installed to counter a decrease in data precision as a function of distance from UBAS. This is particularly important for the gravity survey, as the quality of the data deteriorates with increasing length of survey loops in the rough terrain of the Altiplano. The CP and REF were linked to UBAS at the end of the survey. Monumentation for the REF, where repeated measurements were required, were built using 40 cm‐long masts, which we installed by drilling and concreting into bedrock to mount the GPS antennas. The gravimeter was located precisely at the same position at the REF to minimize positioning errors. At each benchmark gravity data recorded at 6 Hz were averaged over two 60‐second periods and GPS readings were set at 3 second epochs for measurement times of approximately 1‐minute per kilometre of baseline. Additionally, seven local vertical gravity gradients or free‐air gradients (VGG) were determined at six different locations, where gravity was repeatedly measured at two different elevations over the same point using a vertically extendable tripod.
Dynamic (time‐lapse) microgravity
Microgravity measurements obtain a significantly higher precision, to those of the static gravity survey, through precise repeat measurements and loops from the base to any given benchmark (between 3 and 9 times for each campaign). Moreover, measurement uncertainties are minimised by averaging 6 Hz gravity data over five 60‐second periods. GPS monuments are built following the UNAVCO single‐mast guidelines: a 20 cm‐long pin is epoxied to a rock outcrop and a 50 cm‐long mast with a rotation adaptor, where the GPS antenna is set, is screwed to the pin. The antenna is therefore always at the same height and has the same orientation. Similarly, the gravimeter is always set on the same position and elevation. GPS data is improved by using a more complex external reference frame comprising three cGPS and three NERC‐GEF GPS set to record continuously during the length of the campaign. GPS data is further enhanced by recording simultaneously at the bases and the rovers for a minimum of 18 hours overnight. Repeat measurements at certain stations provided us with repeatability errors for the measurements.
Ocean loading and diurnal pressure variation effects were studied through continuous gravity observation, performed by an automated Burris gravity meter (B‐28) in 2010 over a 7‐day period at Quetena Chico village (22.192°S, 67.34°W), near the centroid of the survey. The time series revealed a ±3 µGal and ±2 µGal uncertainty for ocean loading over semidiurnal frequencies and for pressure admittance over diurnal frequencies, respectively. In order to minimise their effect, most loops were kept to less than six hours and a white noise constant of 1 µGal was introduced to the data set.
Data quality
De‐tided gravity data for each rover within each loop has an error that is a compound of: measurement uncertainty (at the base and at the rover) and loop closure (difference in repeat measurement at the base, which results from unaccounted drift and possible tares during the loop). Measurement uncertainty ranged, at one sigma, between 0 and ±3 µGal per station whereas loop closure varied greatly depending on the length of the loop and the roughness of the terrain. When linking REF and CP, and in the time‐lapse survey these were minimised by reoccupying the benchmarks during different loops. The weighted average and standard deviation of the repeat baselines were propagated to UBAS.
In the static survey, relative to UBAS, gravity uncertainty at one sigma ranges ±2 to ±92 µGal with an average of ±41 µGal. Repeat measurements at nine CP were always within the uncertainty of the data. Further quality control was introduced by performing repeat REF links forming loops: for all cases, the difference in loop closure was smaller than the uncertainty. The absolute position of BQ1 was calculated as the weighted average of 8‐ hour RINEX solutions from NASA‐JPL’s Automatic Precise Positioning Service (APPS). The calculated standard deviation is ±0.5 cm. Relative to it GPS positions are postprocessed using Leica Geo Office, with precise ephemeris and with single solutions for all baselines, when applicable. At one sigma, 85% of measurements had an uncertainty <±2.5, 13.2% were between ±2.5 and ±5 cm, with the remainder 1.7% having an uncertainty >±5 cm. GPS repeatability was tested by re‐measuring seven control points. Maximum differences in any component were less than the associated uncertainties.
Errors in determining the local vertical gravity or free‐air gradient (VGG) arise mostly from measurement uncertainty, most significantly from measuring atop a 1 m mast held by a bipod. Still, overall uncertainties for the free‐air gradient measurements, at one sigma, were <±10 µGal/m.
The uncertainty of microgravity benchmarks, at one sigma, propagated to UBAS, were <±6 µGal for the baseline survey, which was later improved to <±3 µGal for the first campaign, by increasing the number of loops to a given benchmark. GPS data was processed using GAMIT‐GLOBK where position repeatability was < 0.6 cm and a velocity field was obtained. Moreover, control measurements show a repeatability of 0.8 cm.
Processing and modelling
The theoretical Earth model by Wahr, Dehant and Defraigne [1999] 5 is used to de‐tide all gravity data. Standard methodologies in gravimetric data reduction for the effect of terrain, benchmark elevation and latitude were employed for static gravity data. Topographic effects are corrected for using an automated algorithm based on dense circular zones (34 zones from 1 m to 60 km radius, 864 compartments in total), similar to Hammer zones, around the individual benchmarks [Hammer, 1939] 6. SRTM data was used for up to 20 km away from survey benchmarks, and a ten‐time‐subsampled terrain model was used for the far field. Terrain density is among the most critical parameters for gravimetric data reduction. Material between the elevation range of the survey (3600 – 6000 m a.s.l.) are mostly Neogene and Quaternary volcanics with a volumetrically very inferior Ordovician low‐grade metamorphic unit [Kussmaul et al., 1977] 7. Measurements on selected samples from different outcrops suggest a density value of 2.4 g/cm3 is appropriate and hence is used here for terrain and Bouguer slab corrections (this generates no significant correlation between topography and calculated local anomaly). A linear correlation between VGG and terrain correction suggest that, in the absence of topography, the VGG for this area differs lees than 3% from the theoretical value of ‐308 µGal m‐1, which is the value used in the reduction. Finally, latitude is corrected for using the standard gravity formula [Moritz, 1980] 8. Sixty additional regional gravity data points are introduced from other surveys [Götze et al., 1996] 9 to improve the aperture of the network when calculating a regional gravity trend.
Preliminary findings
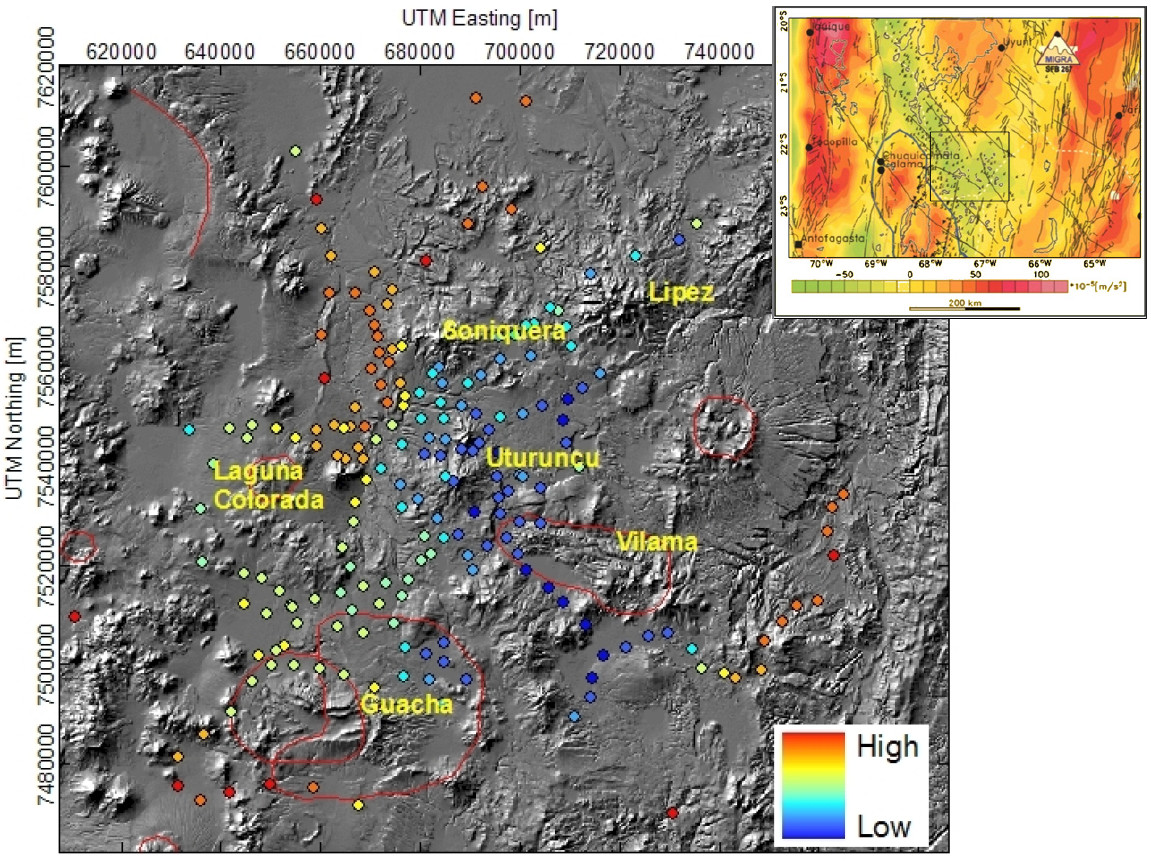
The calculated local gravity anomaly shows that Uturuncu and other neighbouring volcanoes are centred over a local bowl‐shaped area of relative low gravity with no apparent relation to the main Neogene volcanic systems (Figure 2). The local gravity minimum is seen on the benchmarks south east of Utuurncu between the Vilama and Guacha caldera systems. It is unclear whether this anomaly refers to either caldera or to the massif located between them. Other strong negative anomalies are seen beneath the eastern flank of Uturuncu volcano and below the eastern limit of the Las Lagunillas ignimbrite plateau, which extends to the location of the Soniquera and Lipez Range Quaternary volcanoes. West of Laguna Colorada shield another negative anomaly is detected. The presence of the APMB suggest the negative anomaly may be caused by the presence of partial melt, as has been suggested by Schilling et al. [2006] 2.

The strongest positive anomalies are observed on the periphery of the survey, bounding the negative anomaly. A positive signal within the central part of the survey is observed northwest of Uturuncu. To the south this anomaly becomes a north‐south oriented ridge that coincides with several outcrops of Ordovician rocks.
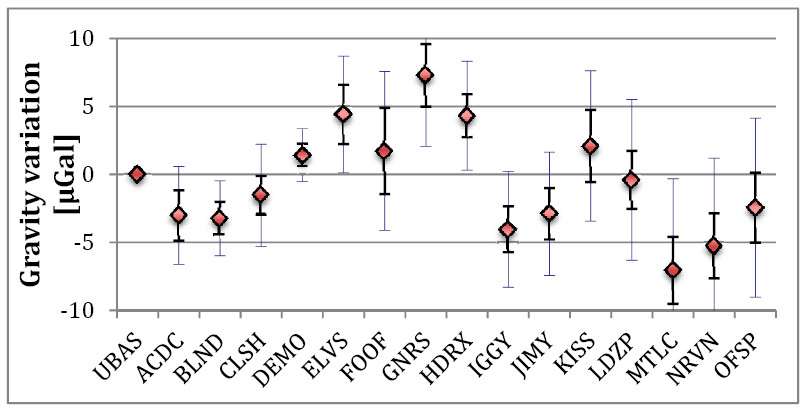
GPS measurements for the time‐lapse surveys show consistent values with no significant ground deformation between the two campaigns. Microgravity measurements (shown in Figure 3) show a possible trend that becomes significant only when the standard error is used, and disappears for confidence intervals greater than 1σ.

Conclusions and recommendations
The gravity surveys provide first important insights on the subsurface structure and volcanic plumbing systems, and place some constraints on possible pluton growth beneath Uturuncu. The spatio‐temporal variations of geophysical observables will provide further constraints. Questions remain as to the nature of the observed ground uplift in the past by InSAR studies. The surveys reported herein could have not been carried out without the equipment from NERC GEF Loans 910 & 928. The equipment used was optimal for the purpose of these surveys and will continue to be for future campaigns. Moreover, the quality of the data obtained exceeded expectations. Ideally a higher resolution DEM should be used for terrain corrections, but such data set does not yet exist. Several manuscripts are being drafted at the time of this writing to report the results from the static gravity surveys.
Resulting Publications and Communications
del Potro, R., Gottsmann, J., et al. Gravity signature of an active intrusion in the central Andes. Geophysical Research Abstracts Vol. 12, EGU2010‐11220, 2010 EGU General Assembly.
del Potro, R., Gottsmann, J., et al. Gravity anomaly of a deep active intrusion beneath Uturuncu volcano in the central Andes. G23C‐0849, 2010 Fall Meeting, AGU.
del Potro, R., Gottsmann, J., et al. Deep structure beneath Uturuncu volcano in the central Andes: Insights from new density anomaly models. EGU2011‐8541, 2011 EGU General Assembly.
del Potro, R., Gottsmann, J., et al. 3D Density anomaly distribution in southern Bolivia. XXV IUGG General Assembly. Accepted.
We currently have three manuscripts in preparation that will be submitted for publication in 2011.
References
-
Pritchard, M.E., and M. Simons. (2002), A satellite geodetic survey of large‐scale deformation of volcanic centres in the central Andes, Nature, 418, 167‐171 ↩
-
Schilling, F. R., et al. (2006), Partial Melting in the Central Andean Crust: a Review of Geophysical, Petrophysical, and Petrologic Evidence. In: O Oncken G Chong G Franz P Giese H‐J Goetze VA Ramos MR Strecker P Wigger ed(s). The Andes, Active Subduction Orogeny. Berlin, Springer ↩ ↩2
-
Salisbury, M.J., et al. (2010), 40Ar/39Ar chronostratigraphy of Altiplano‐Puna volcanic complex ignimbrites reveals the development of a major magmatic province. Geological Society of America Bulletin, doi:10.1130/B30280.1 ↩
-
Sparks, R. S. J., et al. (2008), Uturuncu volcano, Bolivia: Volcanic unrest due to mid‐crustal magma intrusion. American Journal of Science, 308, 727‐769. ↩
-
Dehant, V., et al. (1999), Tides for a convective Earth, Journal of Geophysical Research‐Solid Earth, 104(B1), 1035‐1058. ↩
-
Hammer, S. (1939), Terrain corrections for gravimeter stations, Geophysics, 4, 184‐194. ↩
-
Kussmaul, S., et al. (1977), Volcanism and structure of southwestern Bolivia, Journal of Volcanology and Geothermal Research, 2(1), 73‐&. ↩
-
Moritz, H. (1980), Geodetic reference system 1980. Journal of Geodesy, Vol 54 (3), 395‐405 ↩
-
Götze, H. J., et al. (1996), Group updates gravity database for central Andes, EOS Trans. AGU, 77(19), 181. ↩
Appendix

