Scientific Report 926
This report is also available as a PDF document .
Abstract
To investigate the subsurface characteristics and processes of glacial moraine dams, electrical resistivity tomography (ERT) was integrated with electrical self-potential (SP) to investigate the structure of, and hydrological processes within, a moraine-dam complex at the Miage glacier, Italy. Differential GPS (dGPS) was used to provide a 3-D location for each of the survey points and to create a digital elevation model (DEM) to aid the interpretation of the SP signal measured at the ground surface. ERT data revealed a continuous free surface within the complex; the morphology reflects the topography of the moraine complex akin to unconfined groundwater aquifers. SP data were corrected for spatial changes in the thickness of the upper unsaturated layer using principles of electrography. The residual streamingpotential map is consistent with Darcian flow of lake waters through the moraine complex. These electrical signatures are consistent with those generated by water seepage through earth dams in various non-glacial settings.
Background
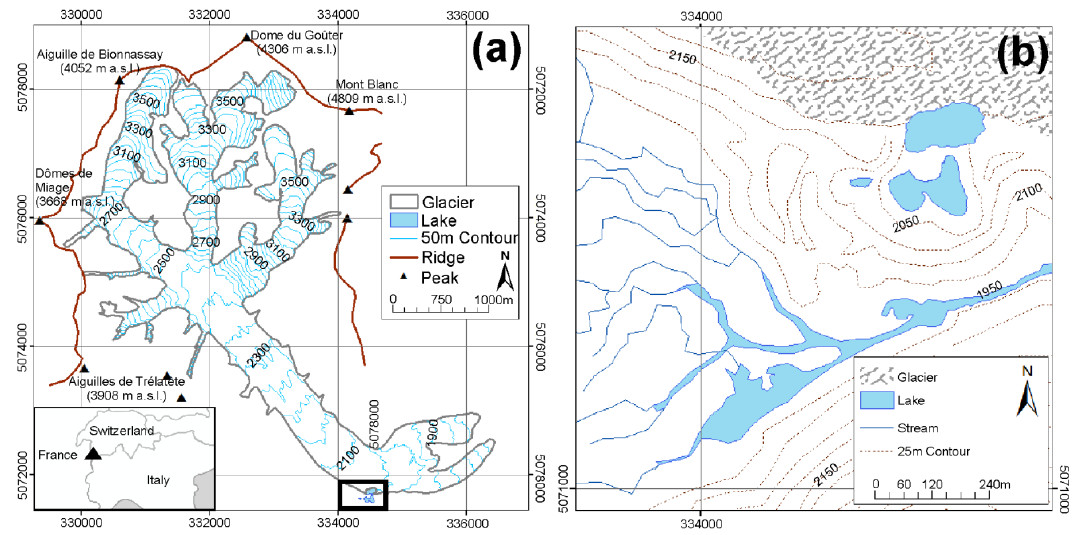
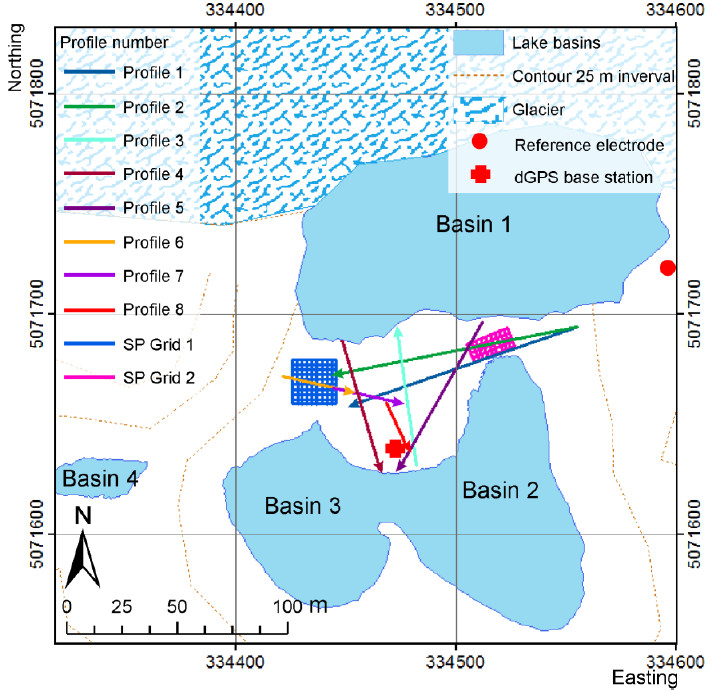
The work reported here formed part of a NERC-funded PhD project, focusing on the formation and evolution of potentially hazardous moraine dammed lakes. During periods of climatic warming, downwasting debris-covered glaciers experience a series of dynamical changes which all encourage retention of glacial meltwater, and the formation morainedammed lakes. Such lakes can drain catastrophically if the moraine dam is breached, but current understanding of the longer term stability of moraine dams is limited. To better understand the subsurface characteristic and processes of a moraine dam a combination of ERT and SP surveys were carried out over the central moraine complex of the Miage glacial lake, Italy (Fig. 1). The Miage glacial lake has been characterised by a series of drainage and re-filling episodes since the mid-18th century (Diolaiuti et al., 20051), at least 15 events were identified between 1930 and 1990 (Deline et al., 20042). The most recent of the drainage events occurred in September 2004 when 80% of the lake volume was lost in less than 72 hours. Prior to the drainage in 2004 all four lake basins were connected, forming a single lake, since 2005 lake levels have re-stabilised at a lower level. A central moraine complex now separates the ice contact basin 1 from basins 2 and 3 (Fig. 2). At the time of investigation, basins 1, 2 and 3 were all predominantly glacier-fed, via glacial meltwater and ice calving input into basin 1. Initial visual inspection of the lakes revealed the visible suspended-sediment concentration of lake-basin 1 to be markedly higher than that in basins 2-3 (Fig. 2). The lack of aerial inflow into basins 2-3, implied that inflow occurred via seepage through the central moraine. Basin 4 appeared to be hydraulically isolated from the glacial system and supplied solely by precipitation (Massetti et al., 20093).
The fieldwork involving the DGPS equipment had two main objectives:
- To provide point elevations to be used in the construction of a digital elevation model (DEM) of the Miage lake central moraine complex.
- To record the 3-D position of all ERT and SP survey point locations.
Survey Procedure
All DGPS data was collected using the NERC GEF Leica GX1230 dGPS system with a fixed base station and rover. All ERT and SP survey point locations collected in static mode and the point elevations for DEM construction collected in kinematic mode, with points taken at 2 m intervals (Fig. 3). Post processing employed the Leica Geo Office software, and was relative to a base station located in a fixed position (45.778N 6.87E) on the central moraine complex (location Fig. 3). For every point a standard deviation was recorded for each of the location parameters (x, y, z). The standard deviation of each point in the static surveys was observed in real-time and the point re-measured if any of the three values were above the prescribed 5% threshold of error. The same procedure was applied to the kinematic surveys after data collection, with points above the error threshold removed.

Data Quality
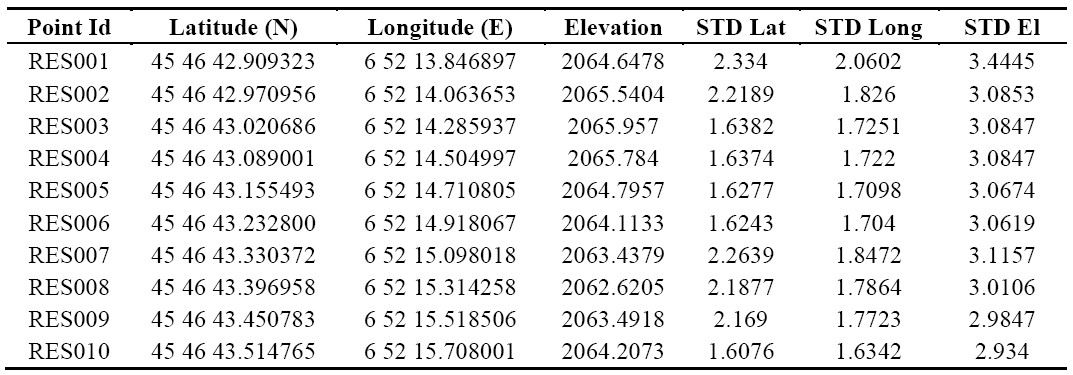
The Leica system has an accuracy of ±1 cm in the horizontal (x, y) and ±2 cm in the vertical (z) (Leica Geosystems). The site has significant topography on all side which does reduce the GPS field of view, but care was taken to ensure good satellite connection, with a minimum of 8 satellites. The base station was located at a high point towards the centre of the site, but all data were post processed to avoid any problems relating to loss of base station-rover connection in real time mode. Adverse weather conditions can also impact upon satellite connection, and data collection was avoided during poor weather conditions. A sample of points collected is shown in Table 1. The site has significant topography on all side which does reduce the GPS field of view, but care was taken to ensure good satellite connection. Accuracy of the survey location points and the data collected for DEM construction is good, similar to the accuracy of the system. Greater uncertainty exists in the accuracy of the lake area mapping. Steep, unstable ground in the vicinity of the lake shores of basins 1 and 2-3 prevented consistent measurement at the perimeter, reducing data accuracy to approximately ±0.5 m. All the data points were collected in latitude and longitude but were converted to WGS84 UTM Zone 32N in ARCGIS 9.10.
Processing and modeling
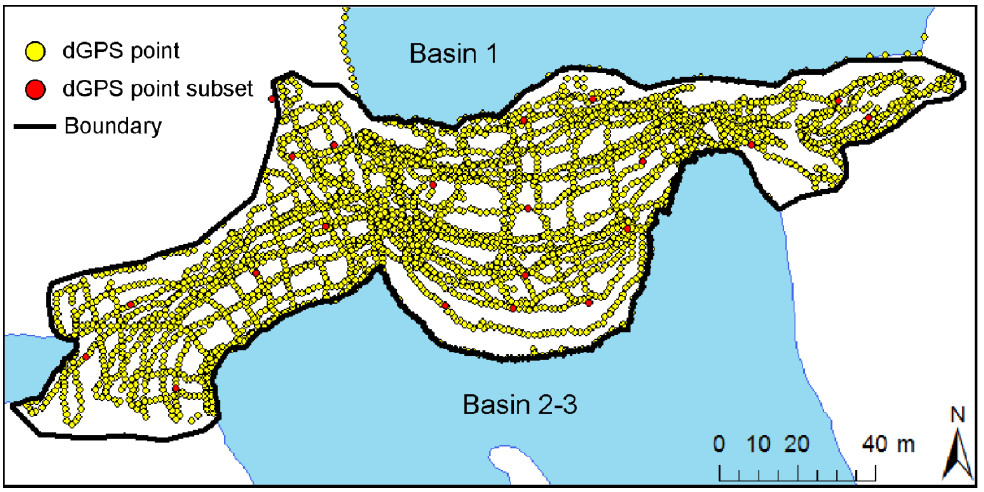
The dGPS data collected in kinematic mode over the central moraine complex (Fig. 4) was interpolated using the topo to raster technique (ARCGIS 10), to a DEM of 2 m resolution. A subset of the dGPS points was held back from the interpolation to allow assessment of the accuracy of the final DEM (Fig. 4). A number of different interpolation techniques were tested but the topo to raster approach was found to perform best. When compared with the subset of points (mean error = 0.49 m with a standard deviation of 0.19), the interpolated DEM has an overall data uncertainty of approximately ±0.5 m.
Primary findings
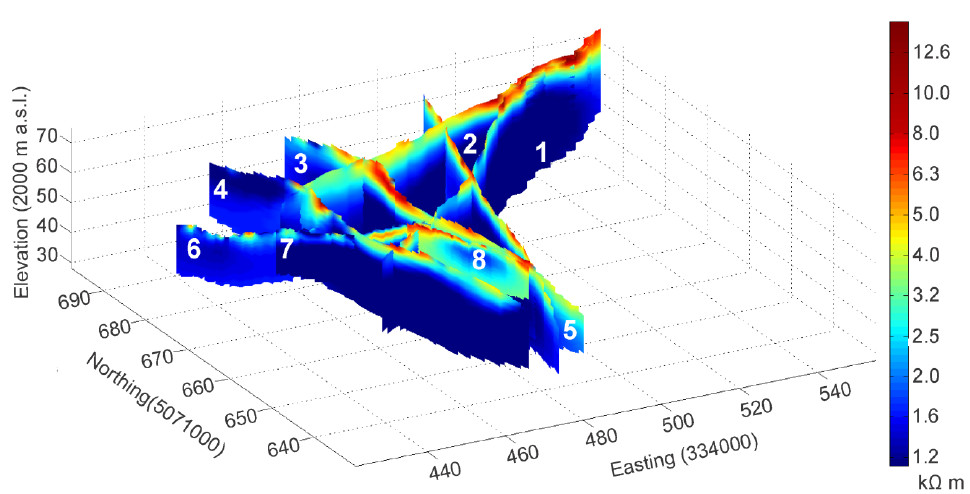
The 3-D position of each ERT survey point location was used to provide topography information for the resistivity inversions. This significantly improved the accuracy and interpretation of the final resistivity profiles (Fig. 5). The inverted ERT data are spatially consistent throughout the study area and are characterised by a higher-resistivity layer (» 4 k Ω m) overlying a layer of markedly lower resistivity (< 1 k Ω m) (Fig. 5). These values are entirely consistent with those expected for unsaturated and saturated morainic material (Reynolds, 20114, p291). The undulating interface between the unsaturated and saturated layers is spatially continuous across the entire moraine complex. The undulations of this interface mimic the ground-surface relief, but are generally smoother and less pronounced (Fig. 5). As such they are consistent with the free surface of an unconfined groundwater aquifer that tracks the surface topography as a result of capillary forces (Fitts, 20025). Work by Massetti et al. (2009) and the difference in sediment concentrations shown in Fig. 2, infer the presence of an efficient hydraulic link through the moraine complex. This allows the downstream basins 2-3 to respond rapidly to any glacier-melt and ice calving derived recharge of the upstream basin 1 (Figs. 2; 3). The saturated layer within the moraine complex connecting these basins is likely subject to discharge akin to a groundwater aquifer. Areas of buried ice were not detected in the central moraine complex, suggesting that the presence of any glacial ice in the past (Deline, et al., 20042; Masetti et al., 20093) has now melted beyond the maximum depth of the ERT profiles (~ 40 m).
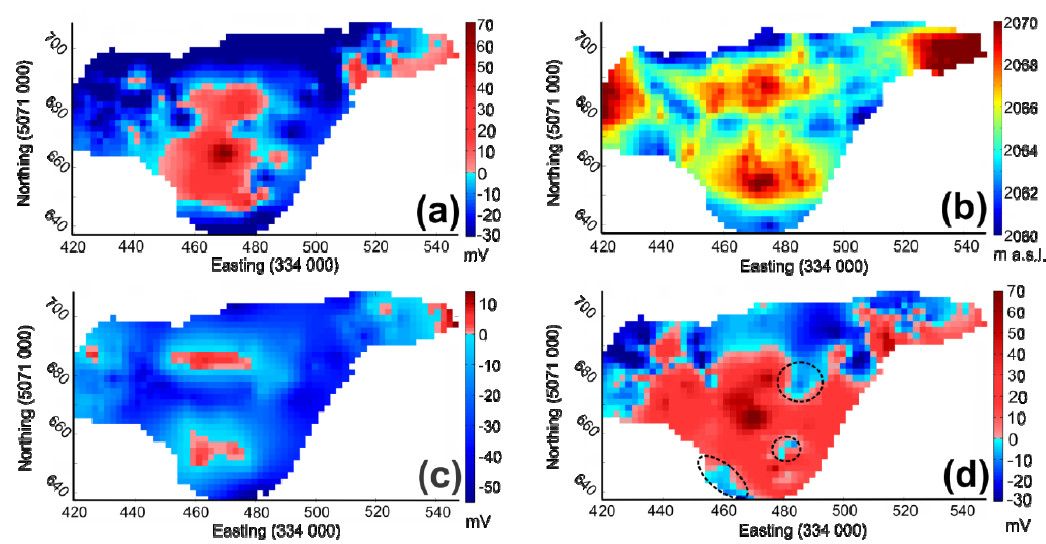
The DEM of the central moraine complex (Fig. 6b) was used to calculate the SP signal due to topography (Fig. 6c) and remove it from the drift correct SP data measured at the surface (Fig. 6a). The topographic effect was introduced by the variable thicknesses of the unsaturated layer across the survey area, and calculated using the theory of electrography (Revil et al., 20036). The residual streaming-potential map (Fig. 6d) reflects bulk subsurface water seepage from the ice-proximal basin 1 to the ice-distal basins 2-3 (Fig. 2). In terms of streaming potential magnitude and upstream-downstream polarity change (from < - 30 mV to » + 70 mV) this is consistent with water seepage through earth dams in various non-glacial settings (Bolève et al., 20097). The inferred pattern of residual streaming potential change is spatially non-uniform, with an absence of a graduated pattern of high positive to high negative values (in the direction of basins 2-3) along the length of the moraine. Some regions of negative polarity appear closer to basin 2, relative to the surrounding areas of positive polarity (Fig. 6d). This non-uniformity may indicate spatial variability in subsurface waterflow patterns, which could intuitively be expected given the complex geometrical arrangement of the central moraine complex (Figs. 3; 6b). Unfortunately areal coverage of the data is too sparse to allow reliable conclusions to be drawn without over-interpretation of the map.
Conclusions and recommendations
The ERT and SP surveys carried out at the Miage glacial lake successfully imaged the subsurface of the central moraine complex which currently separates basin 1 from basins 2-3. ERT results illustrate a two layer structure of unsaturated moraine overlaying saturated moraine, with the interface identified as the water table (Fig. 5). The water table reflects the surface topography and resembles the free surface of an unconfined groundwater aquifer. The topographically corrected SP data illustrate a significant hydraulic potential across the moraine, with bulk subsurface water seepage from basin 1 to basins 2-3. Monitoring of the different lake levels in each basin over the period of study also illustrates flow from basin 1 to basins 2-3. The efficient seepage detected through the moraine, can provide valuable insight into processes occurring at fully formed moraine-dammed glacial lakes. In locations where the moraine dam is narrow and ice degradation occurs, efficient seepage, similar to that detected here, is likely to develop.
Publications
Poster presentation
Thompson, S.S., Kulessa, B. and Luckman, A. (2011) Geoelectrical methods for imaging moraine subsurface hydrology, IGS British Branch Meeting, Cambridge
Journal article
Thompson, S.S., Kulessa, B. and Luckman, A. (2012), Integrated electrical resistivity tomography (ERT) and self-potential (SP) techniques for assessing hydrological processes within glacial lake moraine dams, Journal of Glaciology, 58 (211), 1-10.
References
-
Diolaiuti, G., Kirkbride, M.P., Smiraglia, C., Benn, D.I., D’Agata, C. and Nicholson, L. (2005), Calving processes and lake evolution at Miage glacier, Mont Blanc, Italian Alps, Annals of Glaciology 40, 207-214. ↩
-
Deline, P., Diolaiuti, G., Kirkbride, M.P., Mortara, G., Pavan, M., Smiraglia, C. and Tamburini, A. (2004), Drainage of ice-contact Miage Lake (Mont Blanc Massif, Italy) in September 2004, Geografia Fisica e Dimanica Quaternaria 27, 113-119. ↩ ↩2
-
Masetti, M., Diolaiuti, G., D’Agata, C. and Smiraglia, C. (2009), Hydrological characterization of an ice-contact lake: Miage Lake (Monte Bianco, Italy), Water Resources Management 24(8), 1677-1696. ↩ ↩2
-
Reynolds, J.M. (2011), An Introduction to Applied and Environmental Geophysics, Wiley-Blackwell. ↩
-
Fitts, C.R. (2002) Groundwater science, Academic Press, London. ↩
-
Revil, A., Naudet, V., Nouzaret, J. and Pessel, M. (2003), Principles of electrography applied to self-potential electrokinetic sources and hydrogeological applications, Water Resources Research 39(5), 10.1029/2001WR000916. ↩
-
Bolève, A., Revil, A., Janod, F., Mattiuzzo, J.L. and Fry, J.-J. (2009), Preferential fluid flow pathways in embankment dams imaged by self-potential tomography, Near Surface Geophysics 7(5-6), 447-467. ↩
