Scientific Report 918
This report is also available as a PDF document .
Abstract
We conducted a passive seismological experiment that was designed to constrain variations in crustal structure beneath the Faroe Islands (Faroe Islands Passive Seismic Experiment). After collecting approximately 15 months’ of continuous (100 Hz) data using Güralp CMG-3ESPD seismometers at 12 sites that span the Faroe Islands landmass, we applied the receiver function method to global teleseismic earthquakes that were recorded by the FIPSE array in order to examine P-S-wave conversions that arise from major acoustic impedance discontinuities in the subsurface. The data quality recorded by the FIPSE array is relatively poor, due to the microseismic noise from waves and wind, and data recovery was 86 % across the entire FIPSE network. Receiver functions calculated from teleseismic earthquakes have been analysed and preliminary results show that a crustal thickness of 29±4 km and average crustal VP/VS of 1.76±0.09 occurs beneath the Faroe Islands crust. The properties of the crust and the character of the Moho appear to vary from north to south, with Suduroy and Sandoy exhibiting a different upper crustal structure than the remainder of the Faroe Islands. We also find evidence for a gradational, high-velocity lower crustal layer with VP/VS > 1.80.
Background
The project objective is to image variations in crustal layer thickness and velocity beneath the Faroe Islands using passive seismological data. The receiver function technique will be used to focus on: i) the uppermost ~10 km to investigate and interpret basement thickness variations and add constraints to basalt thicknesses; sub‐basalt sediments; and ii) imaging the Moho discontinuity to provide three-dimensional variations in crustal thickness and bulk velocity, together with the identification and classification of high-velocity lower crustal layers.
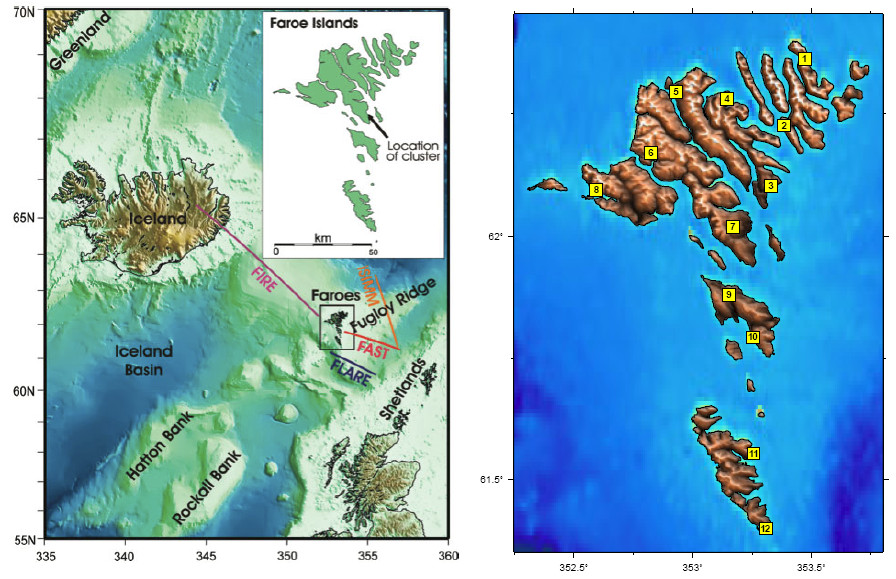
The crustal structure of the continental block on which the Faroe Islands (Fig. 1) sits is poorly understood, mainly due to the presence of thick Tertiary basalt sequences at the surface that hinder controlled-source seismic imaging methods (e.g. Maresh et al., 20061). The region is of interest as offshore hydrocarbon prospects within the Faroese sector of the Faroe-Shetland Basin are expected to occur both in layered basalt flows (including hyaloclastites) and in sediments between the base of basaltic sequences and the top of Precambrian crystalline basement. The onshore thickness of the basalts, the presence of sediments and the depth and lateral variation of the basement discontinuity, however, are largely unconstrained.
Variations in Faroese crustal thickness and composition are also not well constrained. These characteristics have implications for models of uplift and subsidence of the region, particularly as a high‐velocity lower crustal layer has been interpreted as igneous intrusions emplaced at the time of continental break-up (e.g. White, et al., 19873; Richardson et al., 19994; White, et al., 20085). A knowledge of the crustal structure and distribution of material intruded into the lower crust beneath the Faroe Islands would increase the ability to understand the paleogeographic development around the time of continental break-‐up, as well as for the present day, adding knowledge about the role that magmatism played at this stage of break-up.
Survey Procedure
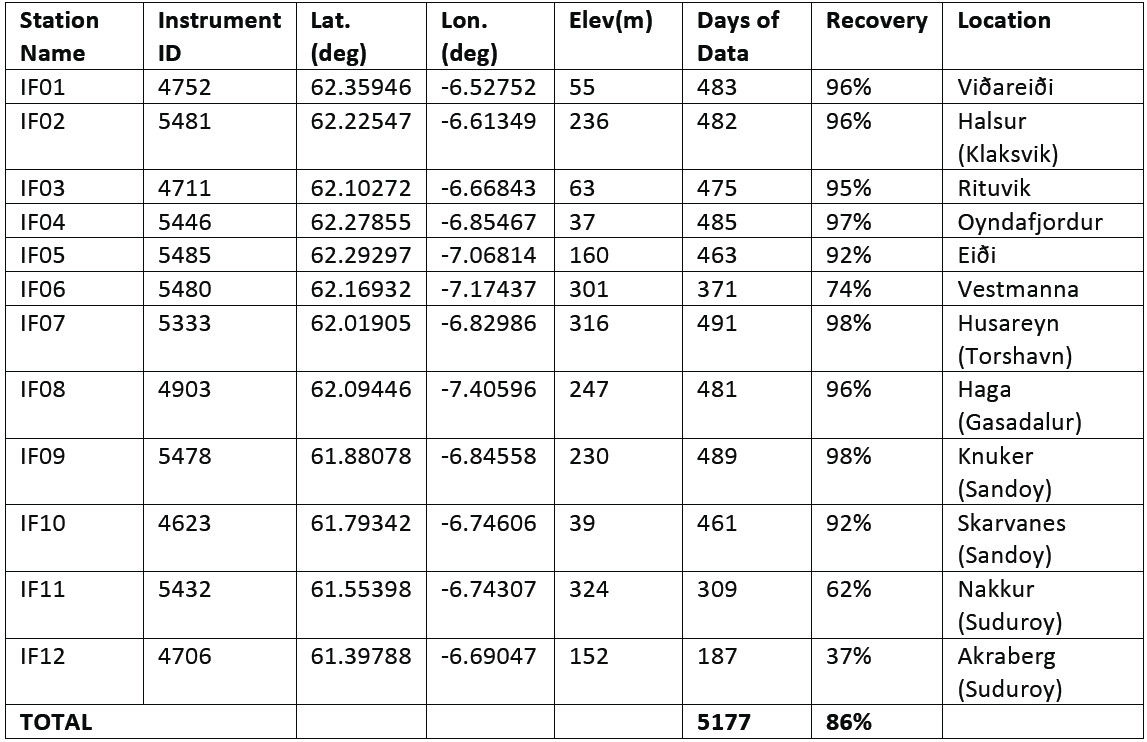
Approximately 16 months’ of continuous seismological data were collected at 12 sites that span the majority of the Faroe Islands (Fig. 1 and Table 1). A substantial fieldwork program was required to install and maintain these seismological stations, brief details of which follow:
Site Allocation and Permission (29th April – 10th May 2011)
Dr. David Cornwell visited the Faroe Islands (accompanied by Magni Jøkladal) and met with Thomas Varming and Uni Petersen at Jarðfeingi (Faroese Geological Survey) before travelling over all of the major islands to find 12 sites for the seismometer stations. Site choice criteria were: 1. South facing with a clear sky view; 2. Bedrock at 50-100cm depth from the surface; 3. As far as possible from sources of seismic noise (e.g. roads, rivers, windmills, quarries, livestock; heavy industry; coast; masts); 4. Near a potential mains power source; 5. Positioned equidistant from neighbouring stations; 5. Guaranteed vehicular access during summer and winter. At each potential site the landowner was telephoned or met in person and the nature of the deployment was explained before permission was sought. All of the Faroese landowners were happy to give permission for seismometers to reside on their land.
Deployment (13th – 30th June 2011)
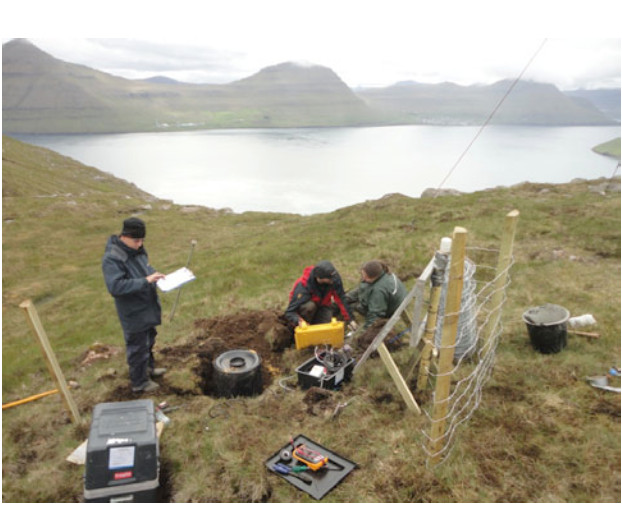
Dr. David Cornwell, Prof. Richard England and Dr. David Hawthorn from SEIS-UK (the UK instrument loan facility at the University of Leicester) travelled to the Faroe Islands and were accompanied by Rannvá Arge for instrument deployment (Fig. 2). Six of the instruments had already been shipped from the UK by SEIS‐UK at the start of the deployment trip, along with all of the sundry materials for station construction (e.g. fence posts, fence wire, digging and other tools, sand, tubing, wooden posts, cement, tape, etc.). All materials were shipped from the UK due to the high cost associated with obtaining them direct from the Faroe Islands. The remaining six instruments arrived on June 20th and deployment was completed on June 29th.
1st Service/Data Download (10th – 20th October 2011)
Dr. David Cornwell, Dr. David Hawthorn and Rannvá Arge visited all sites and downloaded all data recorded since deployment from the CMG‐3ESPD internal 8/16Gb hard drives.
Service Notes: Solar panel blown off – IF11; Breakout box changed – IF11; Sheep had been inside fence – IF12; Breakout box serial cap left off – IF02; New communications
2nd Service/Data Download (3rd – 14th February 2012)
Dr. David Cornwell and Rannvá Arge visited all sites and downloaded all data recorded since previous service from the CMG-3ESPD internal 8/16Gb hard drives.
Service Notes: Batteries changed – IF05, IF06, IF08; Instrument DOA – IF06, IF08; Solar panel blown off – IF07, IF12; Fencing posts blown down – IF11; Changed GPS – IF12.
3rd Service Trip/Data Download (21st – 28th June 2012)
Dr. David Cornwell and Rannvá Arge visited all sites and downloaded all data recorded since previous service from the CMG-3ESPD internal 8/16Gb hard drives.
Instrument Withdrawal/Decommission (15th – 28th October 2012)
Dr. David Cornwell and Rannvá Arge visited all sites and download all data recorded since previous service from the CMG-3ESPD internal 8/16Gb hard drives. Each site was decommissioned and SEIS-UK equipment was shipped back to Leicester.
Data Recovery and Quality
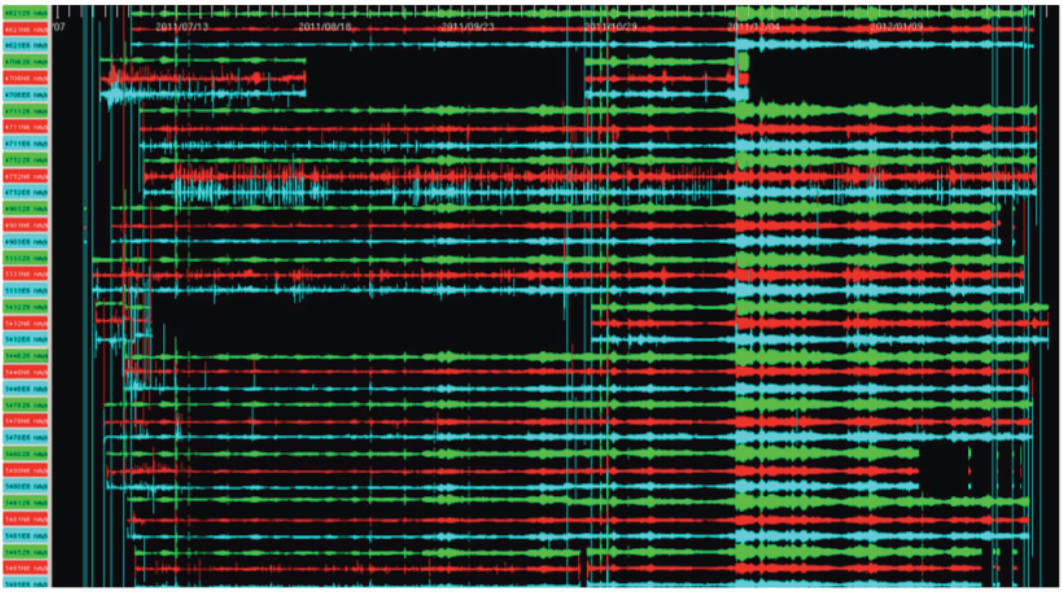
Data recovery was calculated at 86 % for the FIPSE array (Table 1). A total of 5177 station days of continuous data were collected from 12 seismological stations and approximately 850 station days’ data were lost due to equipment failures, caused mainly by the effects of high winds and waterlogging after heavy rain (Fig. 3).
Interpretation to Date
Receiver function analysis is a common technique that uses distant earthquakes to determine the crustal structure beneath the recording seismometer. Vertical discontinuities in acoustic impedance beneath the seismometer station cause earthquake P-waves to convert to S-waves and receiver function processing removes the source-side effects of the earthquake, leaving the direct P-wave followed by converted energy and multiply-reverberated energy (e.g. Langston, 19796; Ammon, 19917).
Receiver functions (RFs) were calculated for the ~15 months (17th June 2011 to 16th October 2012) of seismological data collected. An overview of the receiver function processing steps is as follows:
- Download GCF data from ESPD seismometer.
- Convert to MiniSEED format and populate header information.
- Search for earthquakes above magnitude 5.5 and in the distance range 30 to 100°.
- Extract east-west, north-south and up/down waveforms in SAC format from continuous MiniSEED data 30 seconds before and 180 seconds after the theoretical (IASP91) arrival time of the first P-wave from each earthquake.
- Remove instrument response in SAC using published poles and zeros values.
- [Test bandpass and polarisation filters for signal:noise improvement and P-arrival identification.]
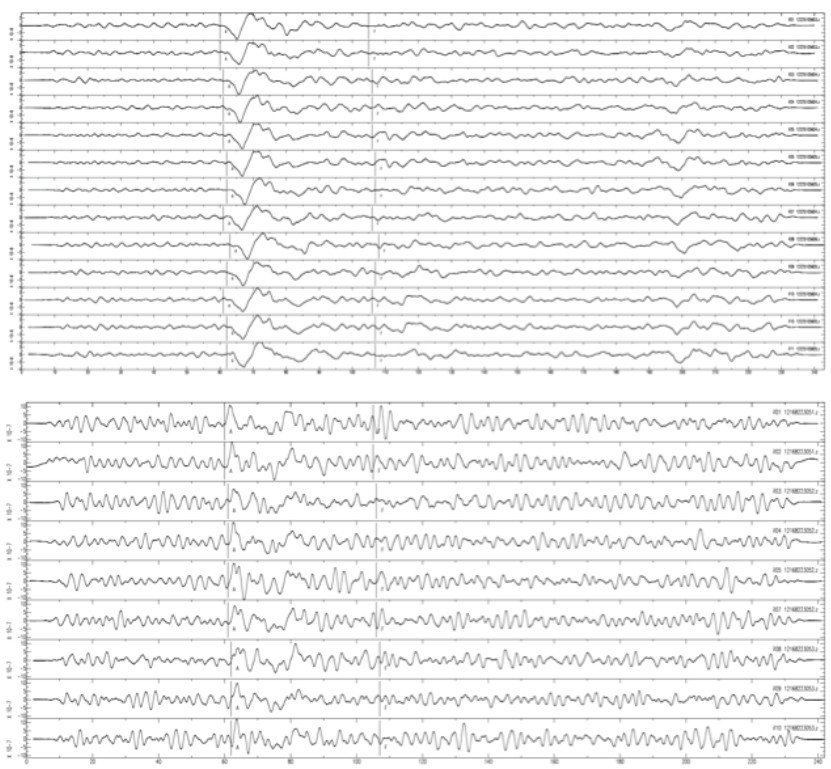
- Select events with a clear/impulsive P‐arrival above the background noise (with and without a gentle bandpass filter of 0.03‐5 Hz) (Fig. 4).
- Calculate RFs using the Extended-Time Multi‐Taper Receiver Function (ETMTRF) method (Helffrich, 20068) for a range of maximum frequencies (0.5-2.5 Hz) using a 60 second time window after the P-arrival (window lengths between 30 and 90 seconds tested).
- High‐pass (corner frequency 0.1 Hz) filter all RFs to remove long‐wavelength noise.
- Visually inspect all RFs and select those with a P‐arrival on/near to zero time and without high noise on both radial and tangential components (selection criteria according to Cornwell et al., 20109).
- Correct each RF for source-station distance move-out using the IASP91 Earth velocity model (Kennett & Engdahl, 199110).
- Create un-weighted RF stacks for: i) all array data; ii) individual stations.
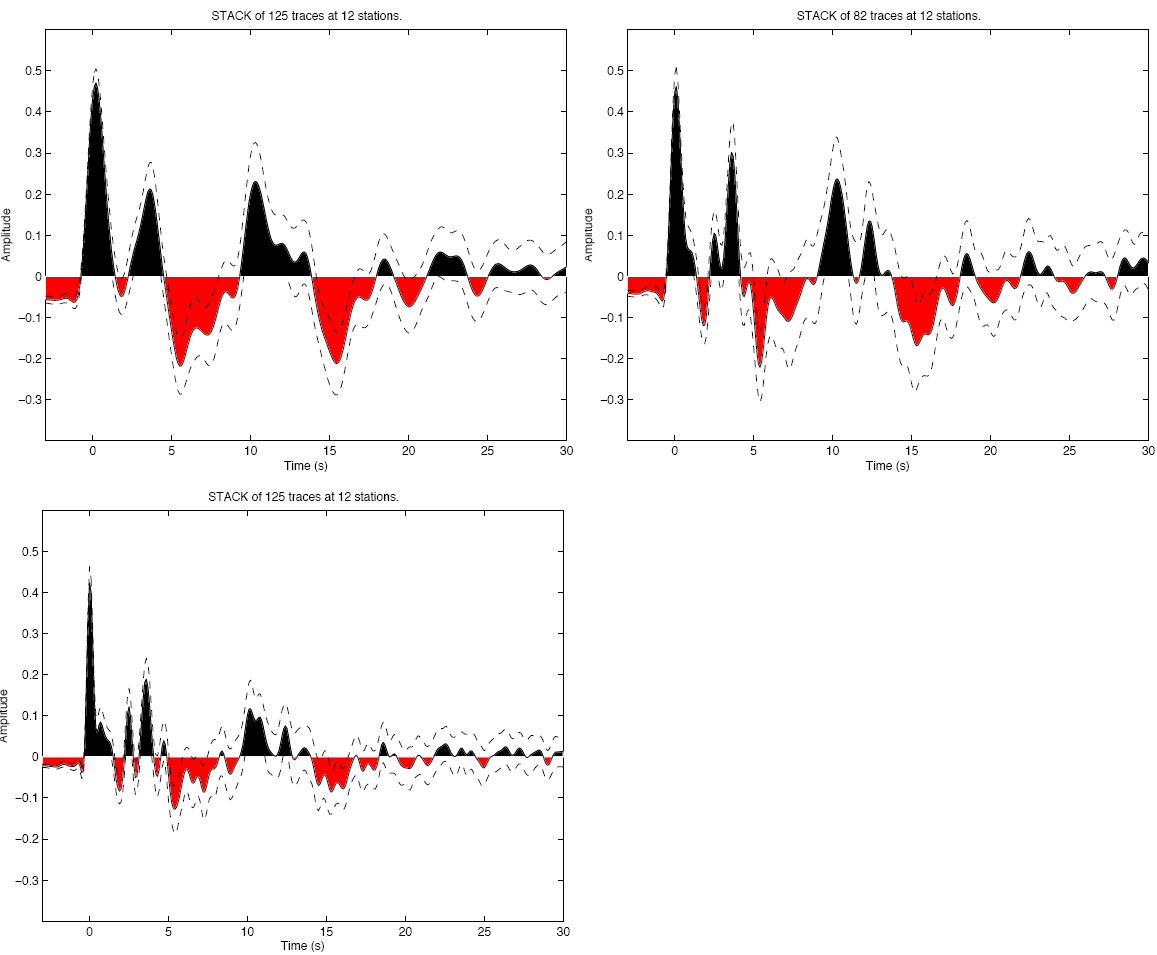
The visual receiver function quality control yielded a subset of the total 4072 receiver functions that were calculated from 393 events of 125 receiver functions ranked “acceptable” or “good” (e.g. Cornwell, 200811). A second subset of “acceptable” RFs was chosen using an automatic selection based upon RF amplitude characteristics (Hetényi, 200712) that yielded a total of 82 RFs.
Preliminary Findings
Individual receiver functions (RFs) were calculated with three different maximum frequencies (1.0, 1.5 and 2.5 Hz) and selected following the procedure in the preceding section from all twelve stations (IF01-IF12) were corrected for move-‐out to a ray parameter of 0.06 s/km (~65° epicentral distance) assuming an IASP91 velocity model (Kennett & Engdahl, 199110) and then stacked together (Fig. 5) with a view to constructing a whole‐Faroe Islands crustal model before examining inter-station variations. This was a necessity because the high noise environment limited station stacks to typically contain less than 20 ‘acceptable’ and of those less than 10 ‘good’ RFs.
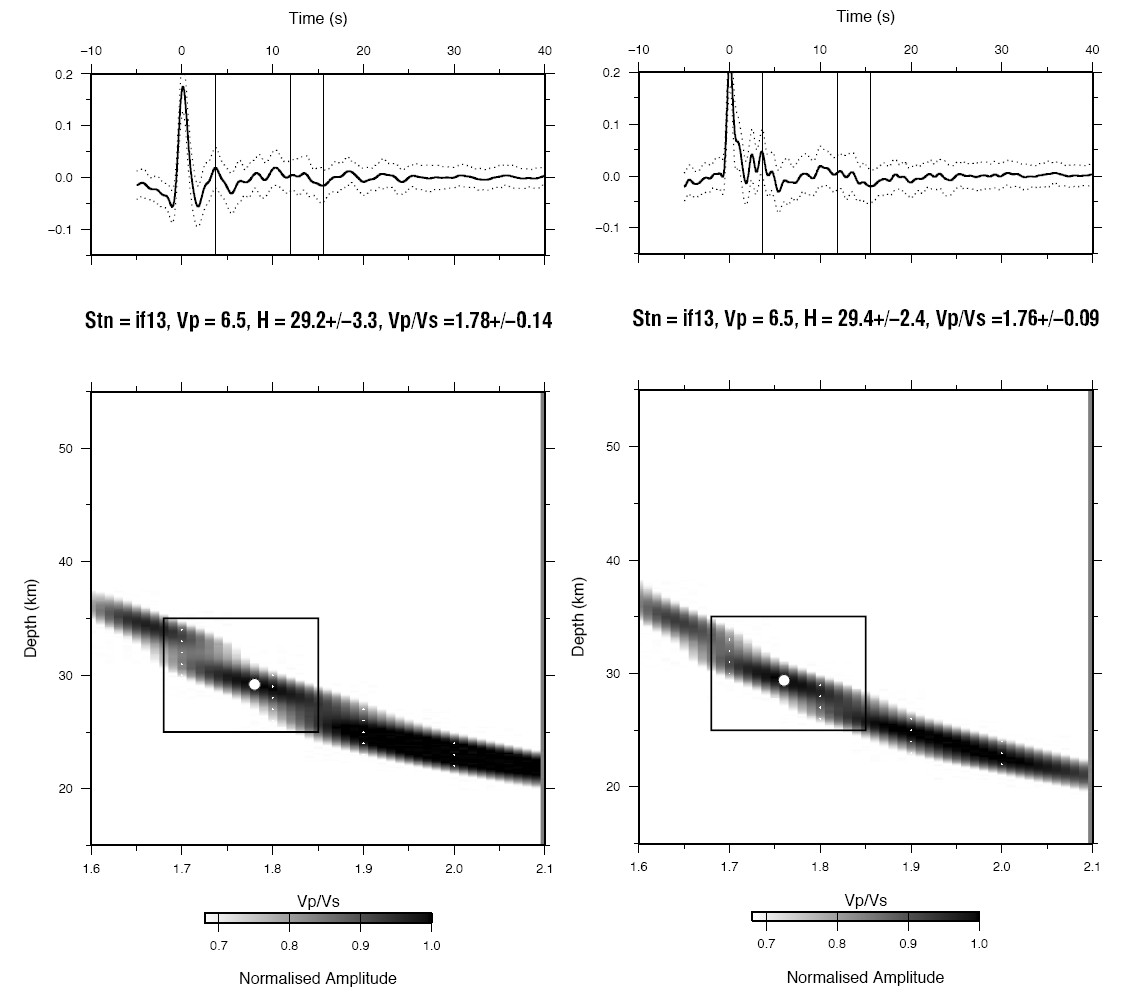
The H‐κ stacking method (Zhu & Kanamori, 200013) was applied to stacks of the calculated receiver function to produce estimates of crustal thickness (H) and average crustal VP/VS (κ). This technique stacks the amplitude of each RF at the predicted arrival times of Ps, PpPs and PpSs+PsPs phases for multiple values of H and VP/VS in a grid search to find a maximum stacked amplitude, which should correspond to the crustal thickness and VP/VS sampled by the stacked RFs. An average P‐wave velocity for the crust of 6.5 km/s was applied to all stacking calculations, close to the average crustal VP values from previous crustal velocity models of the Faroe Islands (Fig. 6).
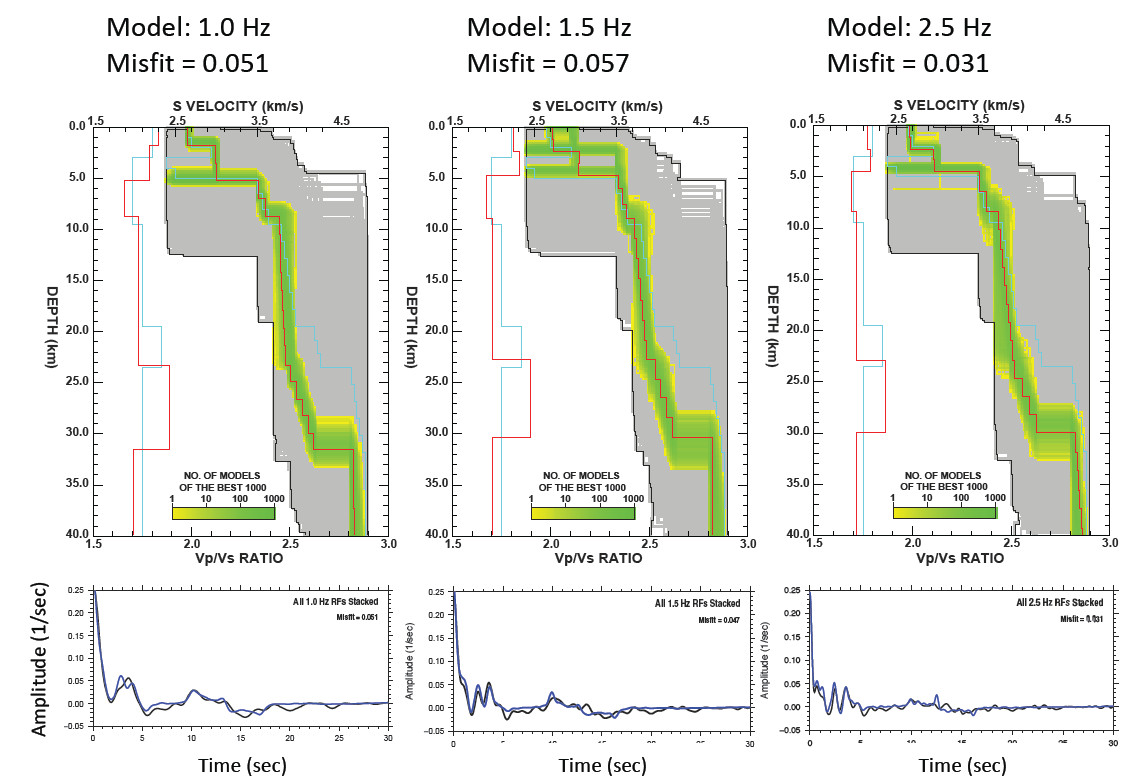
We have also performed inversions of receiver functions to find S‐wave velocity structure for each RF stack by attempting to find a global minimum in a multi-‐dimensional parameter space which represents the model that gives the best fit between the synthetic receiver function generated from that model and the real data receiver function (Sambridge 1999a14, b15) (http://rses.anu.edu.au/~malcolm/na/na.html). This neighbourhood algorithm (NA) package has previously been successfully applied to receiver function studies (e.g. Frederiksen et al., 200316; Reading and Kennett, 200317; Bannister et al., 200718).
By way of example, we show the results of NA inversion on stacks of all the FIPSE receiver functions (Fig. 7) to explore the possible Earth velocity models that could represent the ‘average’ or ‘1D’ Faroe Islands crustal structure.
Conclusions and Recommendations
To date, we have analysed the FIPSE network data using receiver function modelling and inversion and the first publication will be submitting within the next few months. Following this, the FIPSE data will be analysed using ambient noise, S‐wave splitting, body wave tomography and S‐to-P-wave receiver function techniques to gain a fuller understanding of the crust and mantle structure (i.e. constraining upper crustal velocity, mantle anisotropy, lithosphere velocity anomalies and lithosphere‐asthenosphere boundary) beneath the Faroe Islands and we anticipate 2 or 3 more publications to result from these studies. We also have been in discussion with researchers from Cambridge University to perform a combined analysis of their Iceland seismological data with the FIPSE network data.
In terms of recommendations:
- In order to avoid excessive shipping charges, it would be useful to know as soon as possible if the requested number of instruments were not ready for shipping. The project incurred ~£1000 extra costs to air‐freight the 6 delayed instruments to the Faroe Islands.
- We sought to record the highest quality data by placing each instrument directly onto bedrock, however, due to the high natural noise environment this ensured that the data collected had the full bandwidth of the noise! The solitary station not on bedrock had significantly higher signal-to-noise characteristics.
- The “diving bell” method works quite well to suppress the water levels beneath the upturned bin, but if the tube is filled with sand and gets wet then it can expand and caused rising/tilting of the sensor. Check which sand is best to use. The Faroes is particularly wet and water levels reached ¾ way up the upturned bin and caused corrosion of the connectors atop the sensor.
- In regions of high winds, always place the solar panel resting on the ground, as 3 solar panels blew off their mountings (the aluminium frame bends to allow the bolts to become free) but were ‘caught’ by the surrounding fence.
- All consumable goods and tools are very expensive in the Faroe Islands (e.g. a digging bar costs ~£150) so best to ship all station equipment from the UK.
- Acquiring data at both 100 and 1 sps was useful to QC the data in the field (especially finding gaps using the 1 sps data).
Publications
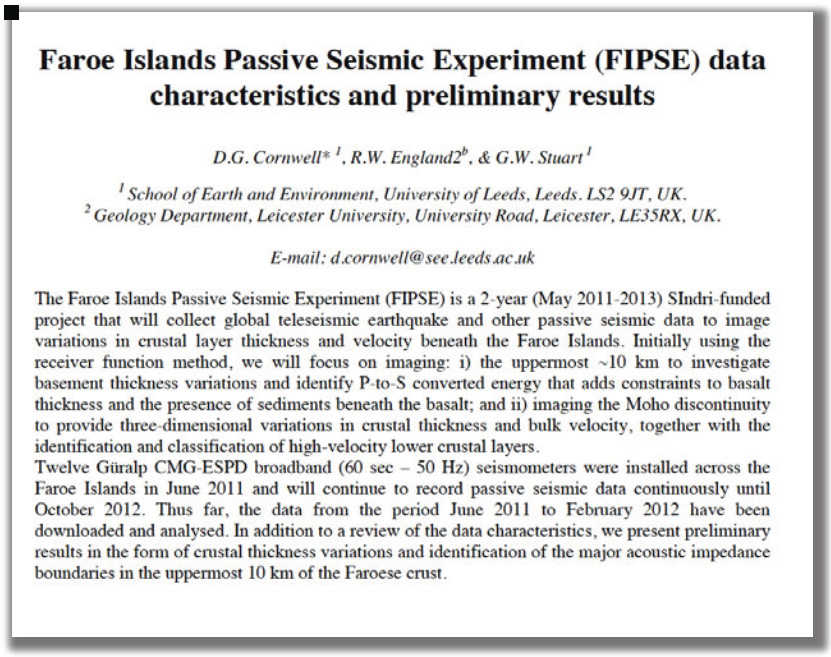
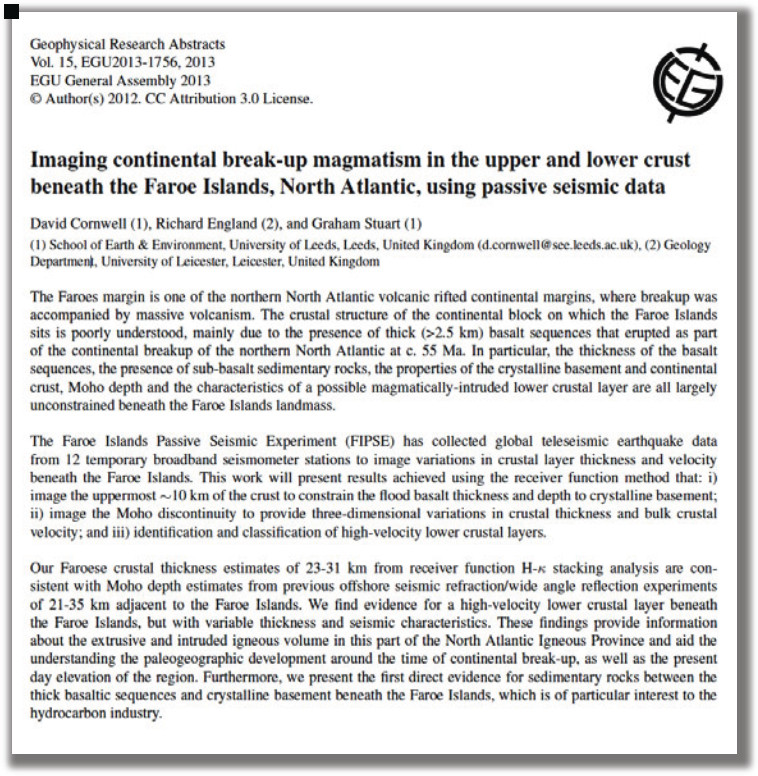
The results from the FIPSE project have been presented at two international conferences: Faroe Islands Exploration Conferernce in May 2012 (Poster) and EGU in April 2013 (Talk). The abstracts and details for these presentations are below. A paper entitled “Resolving crustal structure variations beneath the Faroe Islands using receiver function modelling and inversion” is currently in draft format and will be finished an submitted to Geophysical Journal International during the next few months.
Data Archive
The full dataset is currently held on a password-protected SEIS-UK server at the University of Leicester, UK. It is in MiniSEED format and will be uploaded to the public IRIS server (as agreed in the original proposal) on 31st October 2016 (i.e. 5 years after the seismological data collection finished).
References
-
Maresh, J., R. S. White, R. W. Hobbs, and J. R. Smallwood, 2006. Seismic attenuation of Atlantic margin basalts: Observations and modeling, Geophysics, 71(1), B211‐B221. ↩
-
Harland, K.E. and White, R.S. and Soosalu, H., 2009. Crustal structure beneath the Faroe Islands from teleseismic receiver functions, Geophys. J. Int., 177(1), 115-124. ↩
-
White, R. S., Spence, G. D., Fowler, S. R., Mckenzie, D. P., Westbrook, G. K. & Bowen, A. N., 1987. Magmatism at rifted continental margins. Nature, 330, 439–444. ↩
-
Richardson, K. R., White, R. S., England, R. W., and Fruehn, J., 1999. Crustal structure east of the Faroe Islands: mapping sub-basalt sediments using wide‐angle seismic data. Petroleum Geoscience, 5(2), 161–172. ↩
-
White, R.S., Smith, L.K., Roberts, A.W., Christie, P.A.F., Kusznir, N.J. & iSIMM Team, 2008. Lower-crustal intrusion on the North Atlantic continental margin. Nature, 452(7186) 460–464. ↩
-
Langston, C. A., 1979. Structure under Mount Rainier, Washington, inferred from teleseismic body waves, J. Geophys. Res., 84, 4749‐4762. ↩
-
Ammon, C. J., 1991.The isolation of receiver effects from teleseismic P waveforms, Bull. Seism. Soc. Am., 81, 2504‐2510. ↩
-
Helffrich, G., 2006. Extended-time multi-taper frequency domain cross-correlation receiver function estimation, Bull. Seismo. Soc. Am., 96, 344-347. 12 ↩
-
Cornwell, D.G., Maguire, P.K.H., England, R.W. and Stuart, G.W., 2010. Imaging detailed crustal structure and magmatic intrusion across the Ethiopian Rift using a dense linear broadband array, Geochem. Geophys. Geosyst., doi:10.1029/2009GC002637. ↩
-
Kennett, B. L. N. and Engdahl, E. R., 1991. Traveltimes for global earthquake location and phase identification. Geophys. J. Int. 105 (2), 429‐465. ↩ ↩2
-
Cornwell, D. G. (2008), Magma-‐assisted continental rift margins: The Ethiopian rift, Ph.D. thesis, Univ. of Leicester, Leicester, U.K. ↩
-
Hetényi, G., 2007. Evolution of deformation of the Himalayan prism: from imaging to modelling, Evolution of deformation of the Himalayan prism: from imaging to modelling, Ph.D. thesis, Université Paris-Sud XI, France. ↩
-
Zhu, L. and Kanamori, H., 2000. Moho depth variation in southern California from teleseismic receiver functions, J. Geophys. Res., 105, 2969-2980. ↩
-
Sambridge, M., 1999. Geophysical inversion with a neighbourhood algorithm - I. Searching a parameter space. Geophys. J. Int., 138, 479-494. ↩
-
Sambridge, M., 1999. Geophysical inversion with a neighbourhood algorithm - II. Appraising the ensemble. Geophys. J. Int., 138, 727-746. ↩
-
Frederiksen, A.W., Folsom, H., and Zandt G., 2003. Neighbourhood inversion of teleseismic Ps conversions for anisotropy and layer dip, Geophysical Journal International 155 , 200-212 ↩
-
Reading A.M. & Kennett B.L.N., 2003. Lithospheric structure of the Pilbara Craton, Capricorn Orogen and northern Yilgarn craton , Western Australia, from teleseismic receiver functions, Aust J. Earth Sci., 50, 439‐445. ↩
-
Bannister, S., M. Reyners, G. Stuart, and M. K. Savage, 2007. Imaging the Hikurangi subduction zone, New Zealand, using teleseismic receiver functions: Crustal fluids above the forearc mantle wedge, Geophys. J. Int., 169, 602–616, doi:10.1111/j.1365-246X.2007.03345.x. ↩
-
Raum, T., Mjelde, R., Berge, A. M., Paulsen, J. T., Digranes, P., Shimamura, H., Shiobara, H., Kodaira, S., Larsen, V. B., Fredsted, R., Harrison, D. J., and Johnson, M., 2005. Sub‐basalt structures east of the Faroe Islands revealed from wide-angle seismic and gravity data. Petroleum Geoscience, 11(4), 291–308. ↩
