
Scientific Report 1153
This report is also available as a PDF document .
Abstract
A passive seismology data collection experiment was conducted over 4.5 months in the central Azores, Portugal, in 2022. Starting on the 19th March 2022 on Sao Jorge Island, the region’s seismicity levels rose extraordinarily from only 5 events recorded during 01/01-18/03, to >29,000 M=2-3.3 events recorded until beginning of April. The objective of the loan of 10 SEIS-UK seismic stations equipped with Pegasus data loggers and Trillium Compact sensors was to monitor the ongoing seismicity on Sao Jorge Island. The deployment and data collection after 4.5 months (June - November 2022) were successful and all instruments yielded high quality data. A preliminary analysis of the seismicity shows >9000 tightly-clustered local seismic events beneath Sao Jorge Island.
Background
From March 19th, 2022, Sao Jorge Island experienced a dramatic increase in seismicity levels from only five events recorded between 01/01/2022 and 18/03/2022 to >29,000 M=2-3.3 events recorded until the beginning of April. Based on preliminary event locations by Portuguese agencies and deformation captured by InSAR, a dyke intrusion beneath the island’s main volcanic fissure zone, which has hosted three eruptions over the last 450 years, was inferred. Current earthquake locations are subjected to substantial uncertain orthogonal to the uniquely elongated island because of the geometric limitations of the existing onshore networks. Moreover, low-magnitude events are poorly recorded (or not at all) on adjacent islands, preventing us from locating events relative to known faults and volcanic centres (this is being overcome using data from ocean bottom seismometers). The limited data coverage and quality of existing networks (mostly composed of aged short-period seismometers) have hindered the construction of detailed 3-D seismic tomography images of the region, with only 1-D velocity models being available for the Sao Jorge area based on land data.
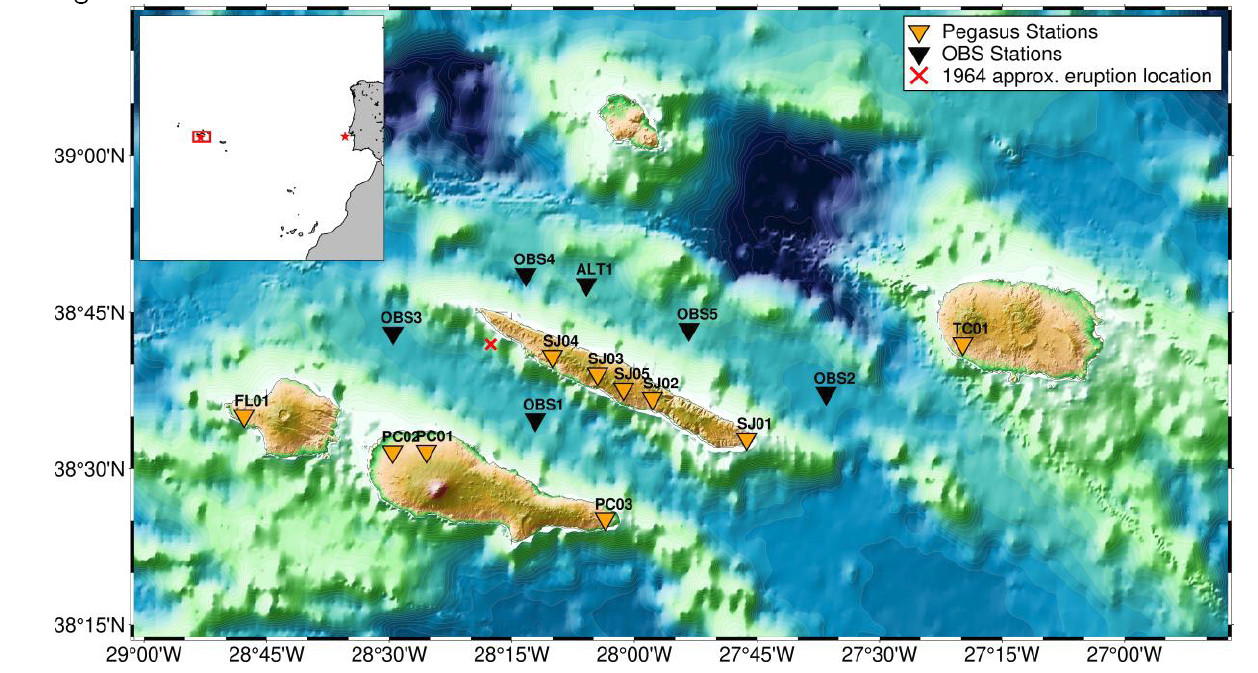
A previous seismic crisis on Sao Jorge in 1964 lasted for nearly a year and was followed by a possible deep submarine eruption (Fig. 1 red “x”), but there was no seismic network established then. Sao Jorge lies within a trans-tensional diffuse plate boundary, which extends over 150 km southwest of the Terceira Rift. Crucially, it contains narrow volcanic fissure systems coinciding with oblique -slip movement, as demonstrated by the presence of laterally-sheared volcanic cones. It is unclear if dyke intrusion in such environments, in general, should be guided by tectonic fracturing or if other mechanisms such as gravitational stresses are involved, as most dyke intrusion research has been carried out on simple orthogonal active rifts such as those in Iceland and East Africa. Further, it is unclear how the balance of these stresses controls the ascent path of magma to the surface to produce an eruption. Thus, the highresolution seismological data obtained from Sao Jorge should be important for advancing our understanding of the governing magmatic and tectonic processes in volcanic rifts, and their possible interplay.
Moreover, the data from the array will uniquely allow the construction of the first 3-D tomography images of the volcanic system, thus bringing key insights into the structure and plumbing network of tall and narrow fissure-fed volcanic systems such as Sao Jorge. It will also bring new constraints on the mechanics of dyke intrusions and their kinematic evolution in general.
Survey procedure
This experiment was the first use of SEIS-UK’s recently acquired instruments exclusively dedicated for urgency grants. All stations comprised the new recorder type Pegasus and Trillium Compact seismometers. We chose locations that were within ~200 meters of quieter, secondary roads so that they could be reached by car.
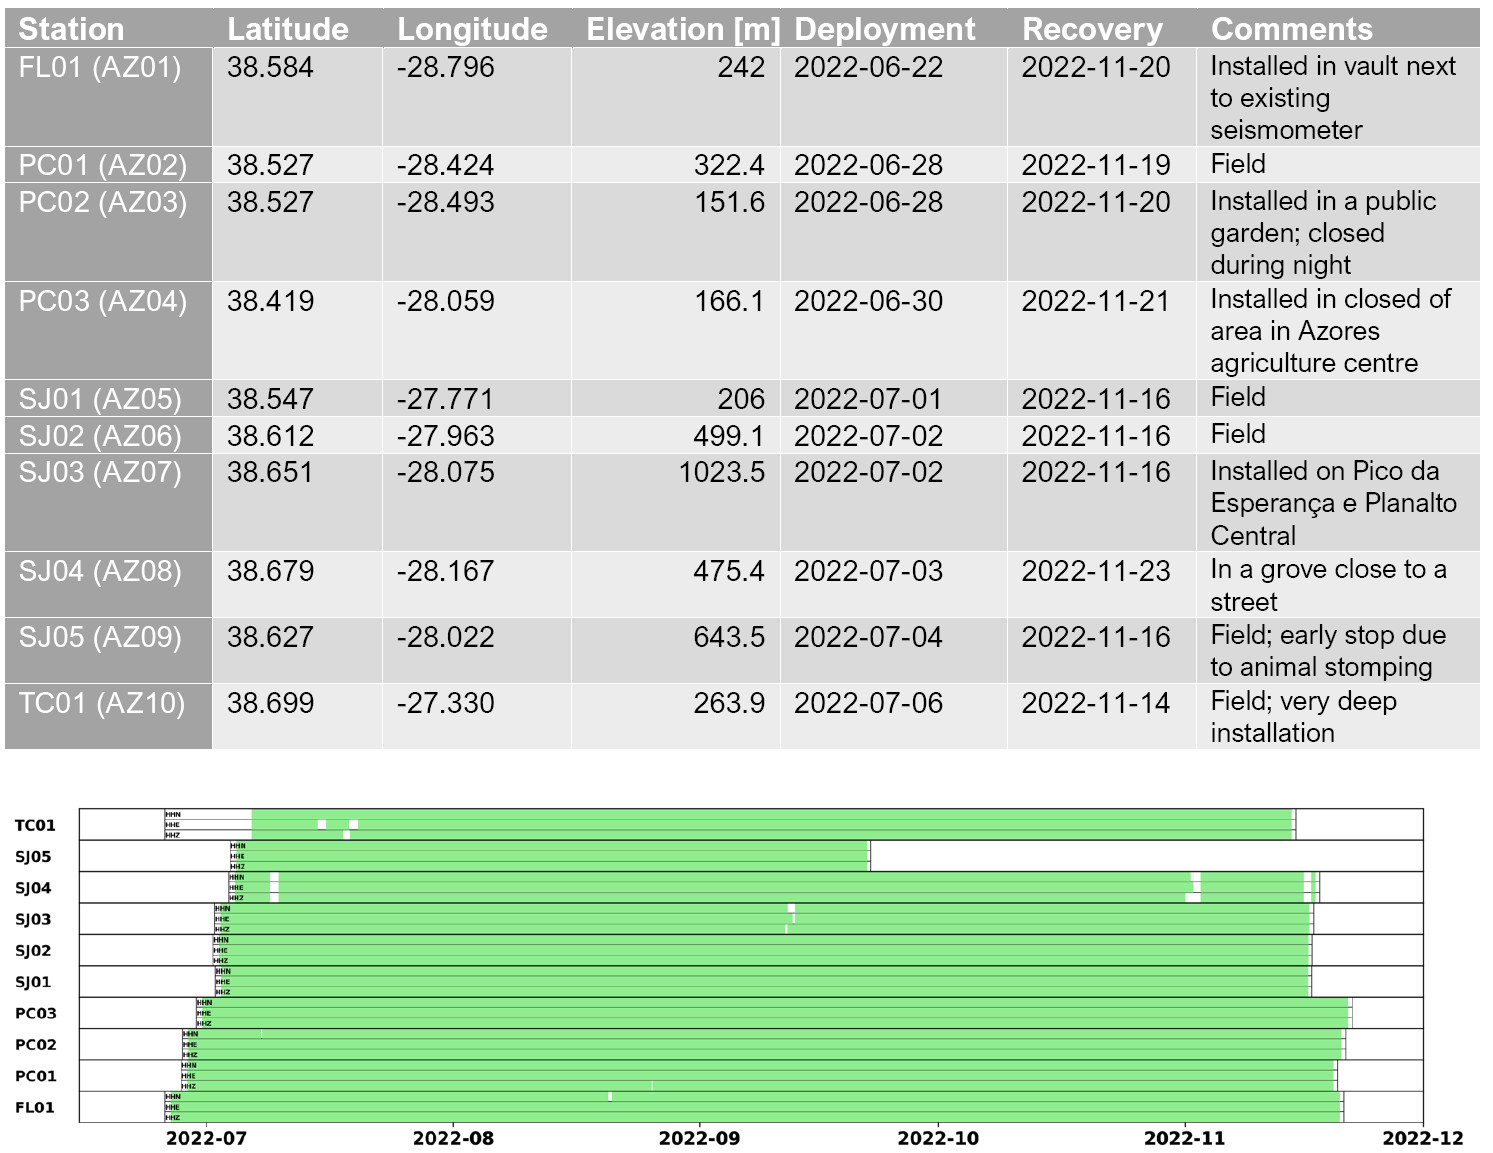
The stations were chosen to minimise environmental and anthropogenic noise and to ensure that they were secure. In one case, the instrument was sheltered in a vault (FL01) next to an already existing short-period seismometer by CIVISA. Five stations (PC01, SJ01, SJ02, SJ05, TC01) were installed in fields where animals (mostly cows) are free to roam. The remaining four stations were installed close to man-made infrastructures (e.g. public parks or ranger stations). In all cases, local authorities (e.g. civil protection officers, park guards, etc.) were alerted and involved in the deployment and recovery activities. They helped us raise awareness about the instruments’ safety with local communities.
To ensure the safety of the sites, most stations were surrounded by a fence, fashioned out of wooden poles and chicken wire. In the case of SJ05, the protection was unfortunately not enough. A cow broke through the fence and trampled on the box containing the recorder, regulator and battery, prematurely interrupting the recording. However, only the regulator and plastic box suffered slight damage. The setup and installation of the 10 Seis-UK stations took place between 2022-06-22 and 2022-07-06 (see Table 1) and were distributed across four islands (Fig. 1). The sampling rate on all stations was set to 200 sps for high-fidelity recording of microseismicity.
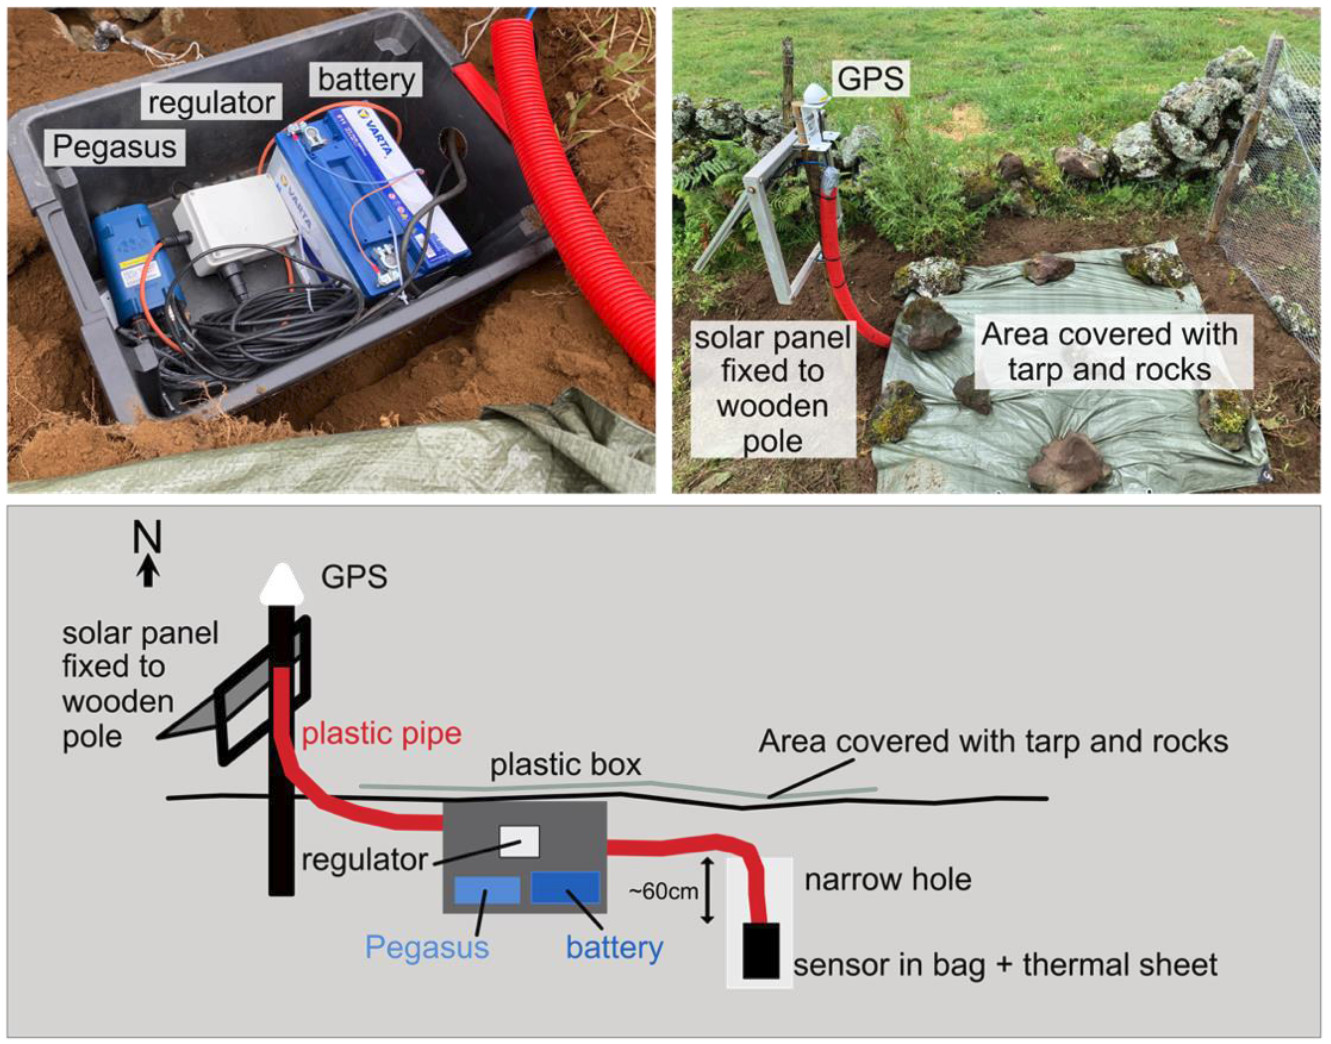
Each box with recorder, regulator, and battery was usually buried less than a meter deep. The sensor depth varied depending on soil property. The sensors were installed some distance (1-2 meters) from the solar panel and other instruments (Pegasus recorder and battery) to reduce noise (Fig. 2). On Sao Jorge Island, an employee of the municipal office provided an auger to dig cylindrical holes so that the sensor could be deposited very easily, reducing the time and effort of digging the second hole. On Terceira Island, a small digger was used to excavate a deep hole for the seismometer, installing it at 1.5 m depth.
The sensor would be usually placed inside the hole with foil loosely wrapped around it (for protection against temperature variations, dirt and moisture), on top of some sand, and then levelled and aligned.
Note the foil would have some small holes at the bottom to prevent water from accumulating in the foil and drowning the Trillium Compact. After levelling and adjusting orientation, the foil would be taped up around the cable which connects the sensor to the regulator. The levelling would then be once more checked on the Pegasus mobile application and further adjustments by moving the seismometer on the sand were made. The resulting alignment had an error margin of around ±5 degrees. We plan to re orient the horizontal components using the recorded data. Finally, the hole was back-filled and the area was covered with a tarp and fixed with rocks (Fig. 2).
The installation of the stations was straightforward, though the biggest concern was to find, buy and/or borrow equipment for the installation. The Azores Islands, though remote, have hardware stores for buying all the additional equipment needed for the installation (e.g. car batteries, plastic boxes, plastic pipe, wooden stakes, chicken wire, etc.). We purchased car batteries locally with higher specs than strictly needed (12V; 74Ah) so that they could power the system independently of the solar panel. This is because the sun exposure in the Azores can be limited, particularly in the winter due to cloud cover. In similar locations like Iceland, higher specs car batteries (yet still affordable) have provided power for whole deployments.
Shovels, pikes and hammers were borrowed from various institutes or municipal offices. The key to the successful deployment was to have a native speaker who knows the area and scientific community. Through that person, we were able to find secure locations for the stations and get all the logistical provisions for the deployment.
Though unavoidable, a lot of plastic waste was generated during each installation. Also, not all auxiliary gear could be handed down to the local institutes (e.g. wooden stakes and chicken wire). Most tarps, plastic boxes and tubes were unusable after dissembling the station. The foil wrapping, one-use cable ties and the duct tape holding were all disposed of as local refuse. In our opinion, future researchers should consider what to do with the supplementary equipment and waste after the project is finished. A future improvement might be the use of more sustainable (e.g., recycled or compostable material) for short deployments.
Data quality
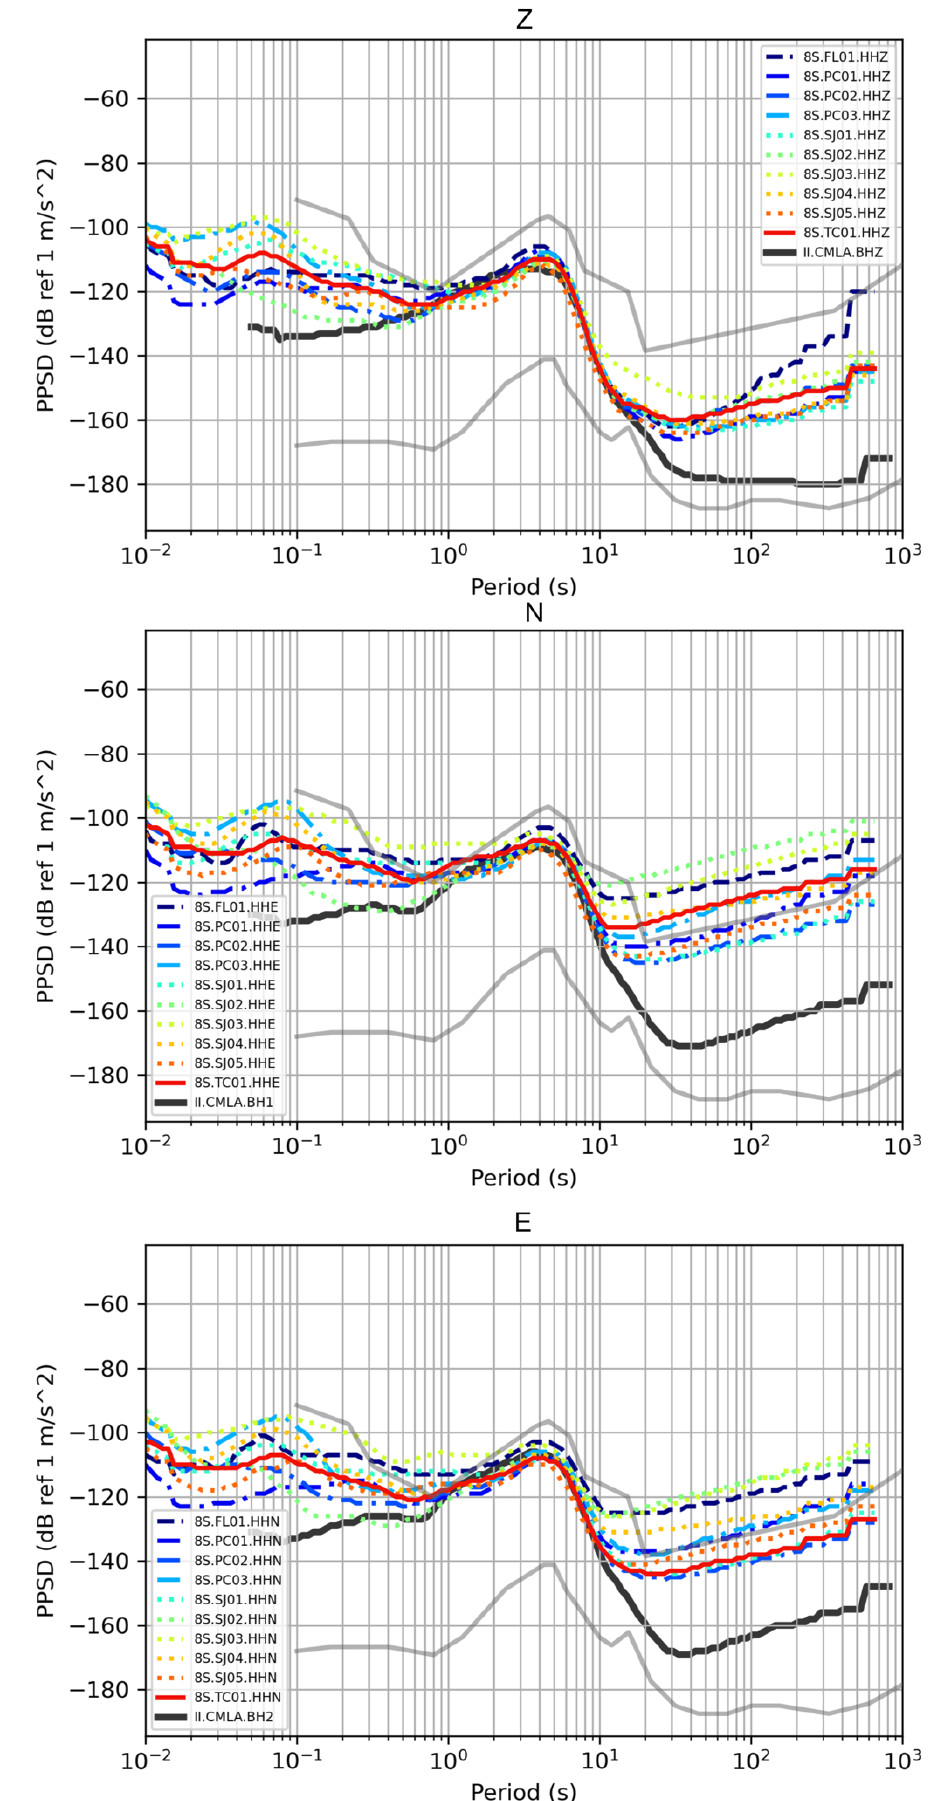
All stations performed very well with data recovery rates of ~99% (Tab. 1) and high-quality recordings, with the exception of SJ05, due to the cow incident mentioned above. The individual probabilistic power spectral density (PPSD) figures (Fig. A5-8) give insight into the overall noise levels of the stations. Some stations have short gaps in their recordings (see Field Deployment Data or PPSDs). SJ03 was installed on top of a tourist footpath (leading towards Pico da Esperança summit) and therefore shows higher noise levels throughout all periods and channels. It is also possible that the stations located closest to the seismic swarm (SJ03, SJ04), may have slightly elevated noise levels at 2-20 Hz due to the high rate of seismicity.
As evidenced by Fig. 3, we observe that the median of the vertical components in the period range 10 - 100 seconds falls within the boundaries of the New High Noise Model (NHNM) and New Low Noise Model (NLNM) (Peterson, 19933). Between 1 - 10 seconds the noise increases and for periods < 1s the noise level stays high but does not surpass the NHNM line. Generally, the PPSDs are more similar to those of OBS stations than typical land stations. Figure 3 compares the temporary stations to CMLA (a CIVISA permanent island station; black solid line). CMLA shows considerably lower noise levels than the temporary installment on the horizontal components. This is to be expected due to the island’s exposure to waves and wind.
Another way to examine the quality of the stations is by looking at a box-whisker plot (Fig. A4), which shows the data station and period-disaggregated. For instance, PC01 seems to be one of the quietest stations.
Processing
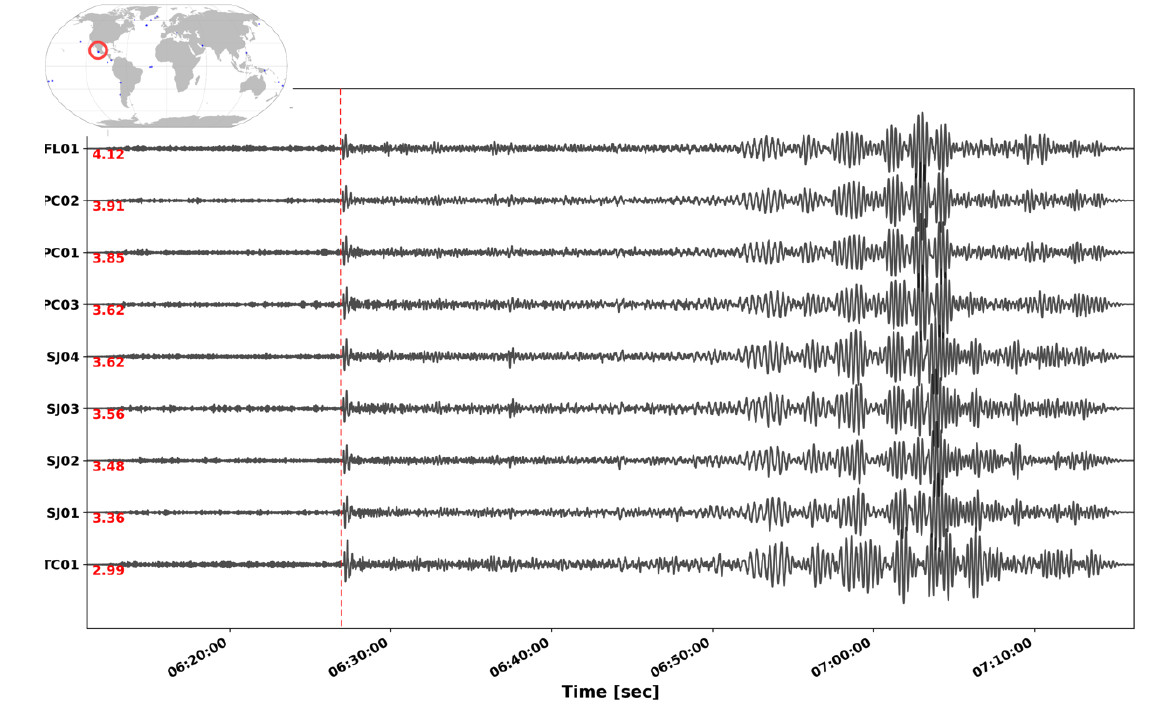
During the period of the deployment, 33 teleseismic events (identified from the GCMT catalogue) occurred with a magnitude larger than M6. Fig. 4 shows an example recording of an event which occurred in Michoacan, Mexico (2022-09-22T06:16:09) with M=6.8. The onset of the first arrival is clearly visible on the broad-band filtered seismograms. Additionally, numerous low-magnitude events occurred during the deployment which are still being analysed. An example of such an event occurred on 2022-10-04T20:41:26 in Sao Jorge with M=2.1 and was localized by CIVISA. This event was clearly recorded on seven out of nine stations (Fig. A3).
Preliminary Interpretation
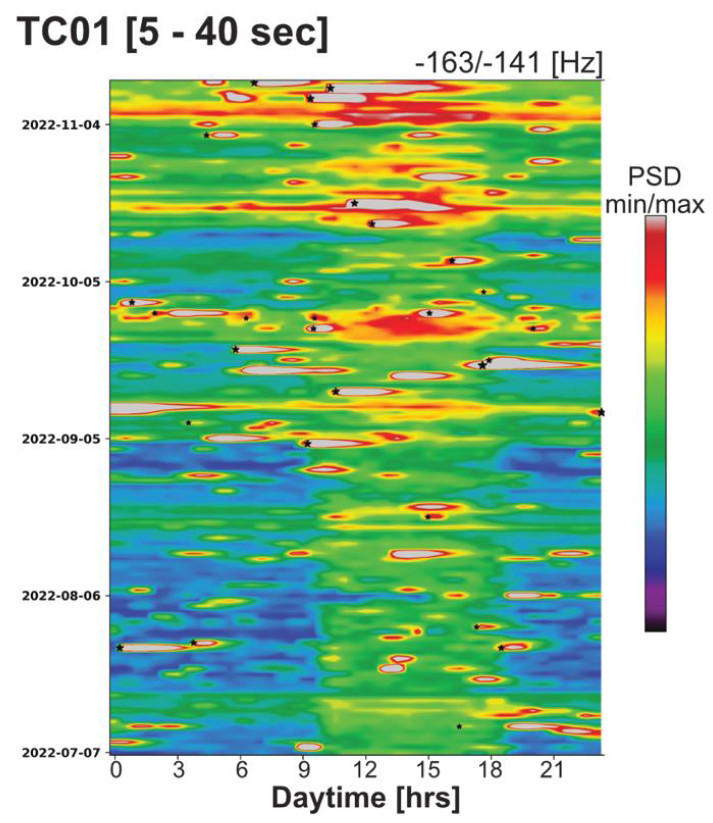
Fig. 5 shows daytime plots throughout the deployment, extracted from the PPSD for station TC01 (vertical component; see Figures A5-8 in the appendix for all other stations). TC01 shows increased noise from 9 a.m. to 6 p.m. on the vertical component, which was the only station installed 1.5 meters deep. The station was also located around 100 meters from a busy road, which might explain the increased noise on the vertical component during the daytime period. On almost all stations an increase in (anthropogenic?) noise during the daytime comes up either on the vertical and/or the horizontal components. Noteworthy is the increase in noise towards the winter months. Usually from the end of September, the noise increases on all the stations and channels.
The desired signals are observable despite the various noise types present in the recording. Teleseismic events and local events are abundant in the records. The daytime plots show events as grey streaks and almost all of them correspond to the 33 teleseismic events known from the GCMT catalogue. On the other hand, the other grey streaks correlate to local events, e.g. the local M2.4 event previously described.
Analysis of local seismicity is ongoing. Arrival times have been determined using the EQTransformer attenative deep-learning model (Mousavi et al., 20204), which were then associated into events using a Bayesian Gaussian mixture model (GaMMA software; Zhu et al., 20225). Preliminary findings show roughly 9000 well-localised events. Fig. 6 shows an overview of the preliminary located local earthquakes. The cross sections A-A’ and B-B’ show a near-simultaneous deepening and shallowing time-progression of seismicity, with two particularly clear dipping bands of between 5 and 10 km depth. In map view, many of these earthquakes line up with the Pico de Carvao Fault Zone mapped at the surface (Madeira and Brum da Silveira, 20036).
Conclusions and recommendations
Between deployment in May 2022 and recovery in November 2022, the 10 seismic stations from the emergency pool of SEISUK produced high quality data with noise levels largely falling within existing noise level models (NHNM and NLNM). The quality of the data is high, with most noise levels within existing noise level models (NHNM and NLNM). Many teleseismic and local earthquakes were recorded. Preliminary findings from local seismicity show a temporal progression of events beneath the island. Relative relocation of clustering seismicity is ongoing, and local earthquakes will form the basis for a new tomographic model beneath the Azores Islands, while teleseismic events will help to constrain the large-scale crustal structure of the region.
SEIS-UK provided exceptional support throughout the whole process. This ranged from the training day for the new Pegasus stations to being continually available to answer questions during the deployment and recovery period.
Our recommendations for future deployments and installations in the Azores and other similar remote island settings are:
- Avoid unnecessary plastic waste by using reusable or compostable materials throughout the deployments.
- Fencing all the stations is essential but, as in our experience, not always sufficient. Digging deeper holes for the instruments or using sturdier boxes should be considered.
- Involving local authorities for support (borrowed equipment; resell or donate auxiliary equipment after experiment) and communication with the communities (e.g. scientific outreach) is crucial.
- Using more powerful batteries in areas with intermittent and significant cloud cover is helpful to
ensure the power supply remains sufficient.
- These batteries can then be resold or donated to the local institutes.
- For this emergency grant it took significant time to install the instruments arising from:
- Customs difficulties because of Brexit
- Delayed schedule
From this experience, we suggest that an expedited process of shipping scientific equipment ought ideally be developed/agreed on with the UK government and NERC.
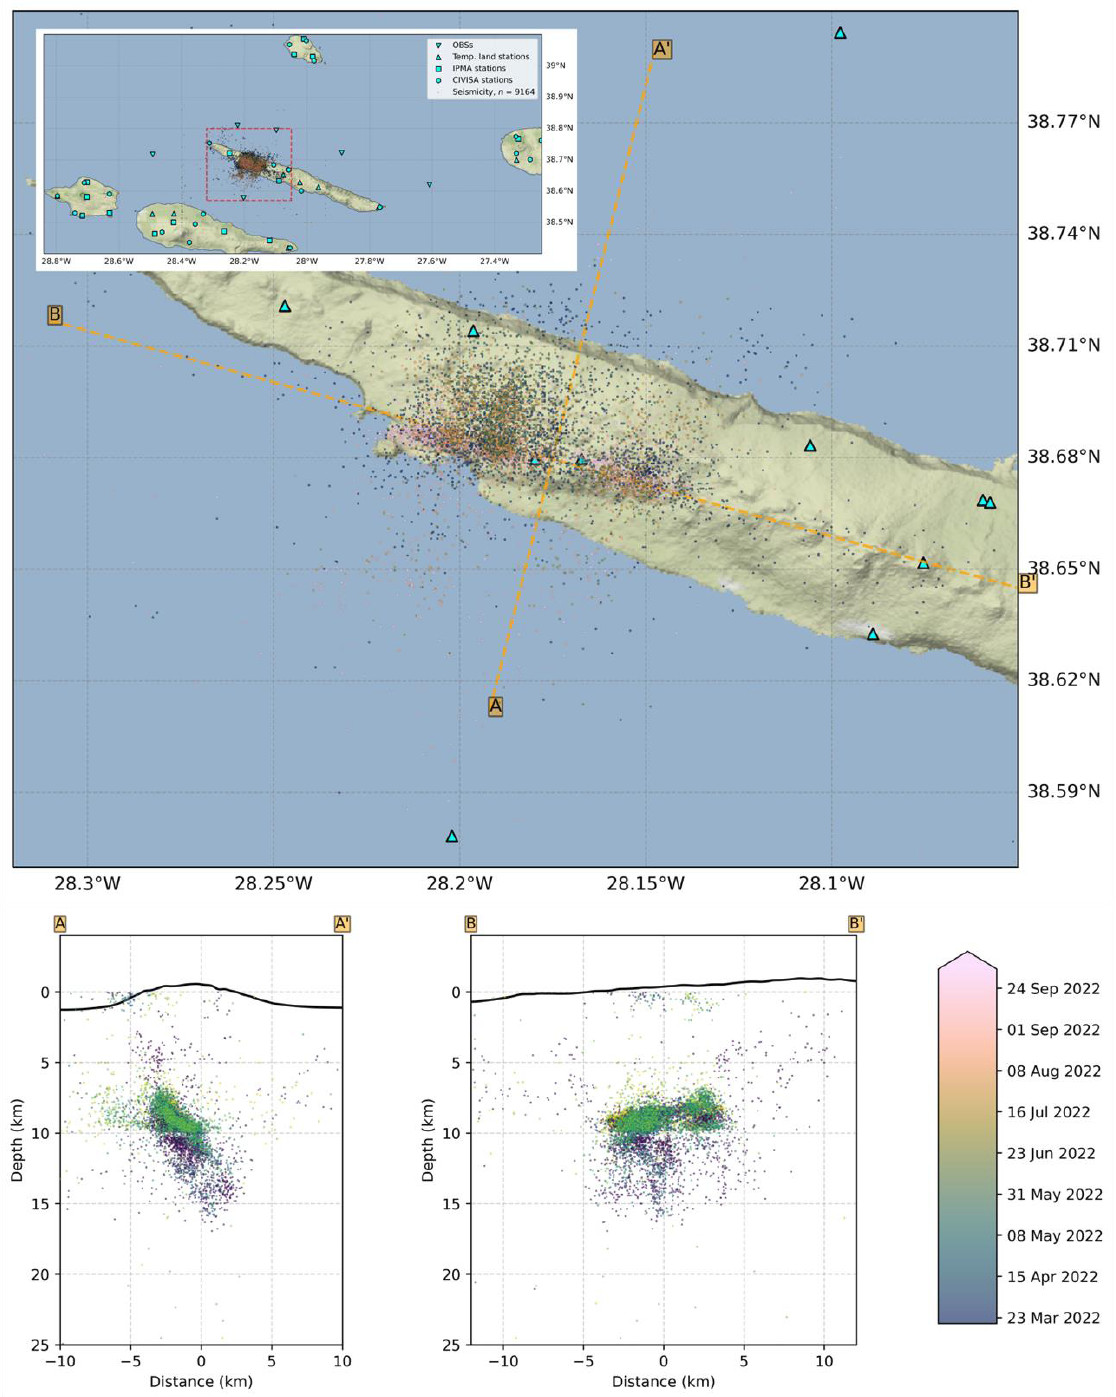
Table of instrument deployment details including locations
Location of the archived data
IRIS: https://ds.iris.edu/mda/8S_2022/ Estimated Release Date of the Data: 2026-01-01 Network Code: 8S Network Name: Azores Network Network Dates: 2022-01-01 - 2022-12-31
IRIS: https://ds.iris.edu/mda/4U_2022/ Estimated Release Date of the Data: 2026-01-01 Network Code: 4U Network Name: Azores Network Network Dates: 2022-01-01 - 2023-12-31
Publications (including conference presentations)
S. Hicks et. al. Growing an ocean island: high-precision seismicity evolution during the 2022 Sao Jorge, Azores seismic crisis. AGU abstract. https://agu.confex.com/agu/fm23/prelim.cgi/Paper/1359943
References
-
Ferreira, A. M. G., Ramalho, R. D. S. & Mitchell, N. Azores Network. 81000 MB International Federation of Digital Seismograph Networks https://doi.org/10.7914/FGP0-C809 (2026a). ↩
-
Ferreira, A. M. G., Mitchell, N., Ramalho, R. D. S., Hicks, S. & Tsekhmistrenko, M. Sao Jorge OBS Network. 115000 MB International Federation of Digital Seismograph Networks https://doi.org/10.7914/D5W4-V395 (2026b). ↩
-
Peterson, J. Observation and modeling of seismic background noise. Seismological Research Letters vol. 79 (1993). ↩
-
Mousavi, S.M., Ellsworth, W.L., Zhu, W. et al. Earthquake transformer–an attentive deeplearning model for simultaneous earthquake detection and phase picking. Nat Commun 11, 3952 (2020). https://doi.org/10.1038/s41467-020-17591-w ↩
-
Zhu, W., McBrearty, I. W., Mousavi, S. M., Ellsworth, W. L., & Beroza, G. C. (2022). Earthquake phase association using a Bayesian Gaussian Mixture Model. Journal of Geophysical Research: Solid Earth, 127, e2021JB023249. https://doi.org/10.1029/2021JB023249 ↩
-
Madeira, J., and Brum da Silveira, A. Active tectonics and first paleoseismological results in Faial, Picoand S. Jorge islands (Azores, Portugal). Annals of geophysics (2003). ↩
Appendix
For the full appendix, please see the PDF version of this report .