Scientific Report 1148
This report is also available as a PDF document .
Abstract
In August 2022, a pilot ground-penetrating radar (GPR) study was conducted within the “Roman York beneath the streets” project. Because the Roman deposits are buried deeply (> 1.5 m), an important objective was to select the antenna frequency resulting in a large enough depth penetration, while still maintaining the necessary horizontal resolution. The test area was located in the northwestern part of the Roman legionary fortress, and the aim was more specifically to detect traces of Roman barracks, buried below the foundations of the medieval archbishop’s palace. A Sensors & Software pulseEKKO PRO GPR system with a shielded 250 MHz antenna and unshielded 100 and 200 MHz antennas were loaned from the NERC Geophysical Equipment Facility (GEF), and tested along with other GPR instruments and antenna frequencies. Whereas wave attenuation prevented the detection of Roman structures with a 500 MHz antenna and lateral resolution proved insufficient when using the 100 MHz antennas, tests with antenna frequencies between 200-300 MHz allowed the identification of a barrack at a depth of 1.52 m, and of the foundations of the archbishop’s palace down to a depth of ~2.5 m. Above-ground objects surrounding the survey area complicated the interpretation of the data acquired with the unshielded antennas, so that the shielded pulseEKKO PRO 250 MHz was selected as the preferred instrument for the complete GPR survey of the open areas within the Roman York project.
Background
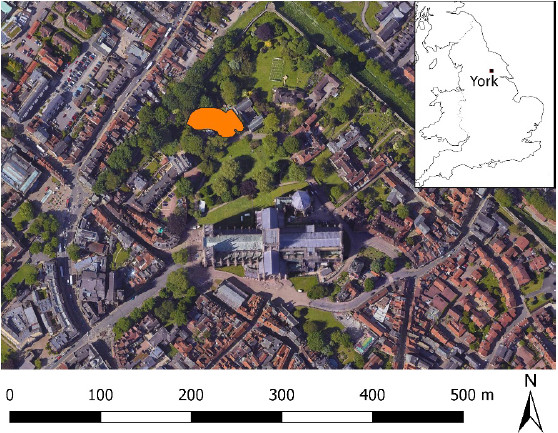
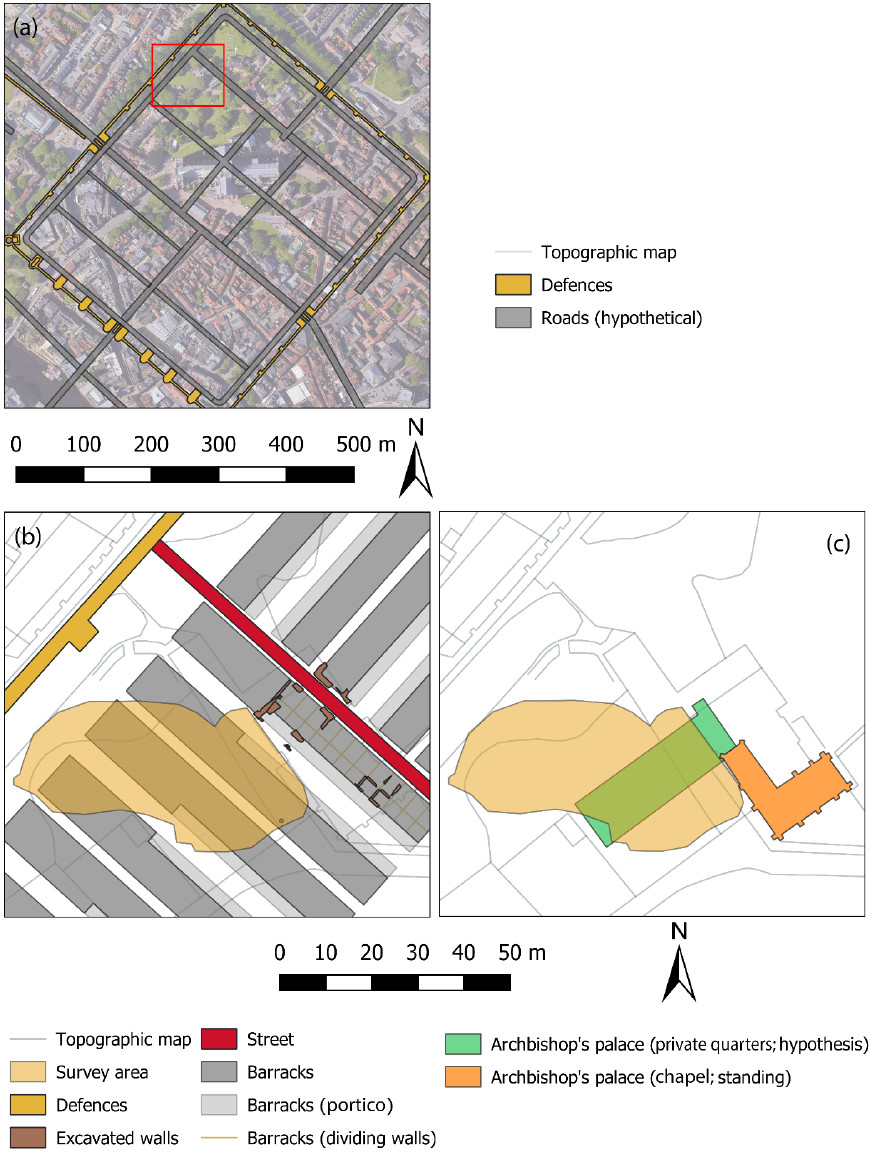
When investigating the character and development of archaeological sites, non-intrusive survey (e.g. geophysical prospection) can deliver extensive information. Especially in modern urban contexts, evidence from excavations is often fragmentary, as is exemplified by the city of York. Our knowledge of Eboracum (Roman York) remains limited despite many centuries of research. Clearer understanding is essential for characterizing the legionary fortress and the civilian settlement which developed around it, for comprehending York’s role in the Roman world, and its transformation into a new centre of power in the post-Roman period. The investigation of Roman York is the aim of the AHRC project `Roman York beneath the streets’, directed by Prof Martin Millett (University of Cambridge) and Dr John Creighton (University of Reading). This project combines evidence from past excavations and museum archives with the results of new ground-penetrating radar (GPR) surveys. The GPR work at York includes the survey of present-day streets and two open areas within the city: one immediately to the north of the Minster (Dean’s Park), and another to the southwest of the Minster (the gardens around the Yorkshire Museum). The investigated areas have been occupied continuously since the Roman period, and excavations and coring have shown that some of the Roman deposits are at depths of three metres or more. As a consequence, the contribution of GPR to the understanding of Roman York strongly depends on its penetration depth. Hence it was considered useful to conduct a pilot study to compare different antenna frequencies and assess wave attenuation, while also taking into account the desired vertical and horizontal resolution. This test took place in August 2022 in the Residence Garden near the York Minster Library, just north of the Dean’s Park (SE 60260 52320; Figure 1), in collaboration with Ghent University (Belgium). This area is situated in the northwestern part of the legionary fortress (Figure 2a), where in 1997 excavations for a new wing of the Minster Library located a street and parts of a stone building to the southwest of it (Figure 2b), which are probably part of a barrack belonging to the period between AD 120 and 375 1. The postulated layout of other barracks is also shown in Figure 2b. From the late 12th until the 16th century, the area was occupied by the archbishop’s palace (Perring, 2010). Of its north range, the chapel is still standing (now the Minster Library) and in the excavations, parts of the private quarters of the archbishop were found. Its foundations were also to be expected in the GPR survey area (Figure 2c).
Survey Procedure
A Sensors & Software pulseEKKO PRO GPR system with a SmartCart, a 250 MHz shielded antenna, and 100 and 200 MHz unshielded antennas were loaned from the NERC GEF, and tested along with other instruments and antenna frequencies (Table 1). Fieldwork was carried out from 10 until 28 August 2022. In general, weather conditions were dry with temperatures around 20-25 °C. There was good contact between the antennas and the surface, which for the most part consists of short grass, whilst in the southeastern part, used as an (unmetalled) car park, there is no vegetation, and a seven-metre wide strip near the library is asphalted. The Residence Garden was surveyed as completely as possible with the 250 MHz antenna (survey area: ~2250 m²), except for the southern part (given the presence of a compound used by the Chapter of York) and the northern part near the city wall, which is characterized by a steep slope. The survey area for the survey with the 200 MHz antenna was ~1350 m², and it was ~450 m² for the 100 MHz antenna.
The 250 MHz antenna loaned from the NERC GEF was paired with another antenna of the same type, made available by Ghent University, and mounted onto a manually pulled, wooden cart, with a distance of 0.5 m between the antennas (Figure 3a). The optimal line distance for a 250 MHz antenna is smaller than 0.5 m: for a full resolution 3-D GPR survey, the theoretical requirement is a transect spacing not larger than one-quarter of the wavelength λ of the centre frequency of the antenna (see e.g. Grasmueck et al., 20052). Here λ/4 equals ~0.1 m assuming a velocity of 0.1 m/ns. Therefore, it was decided to cover the survey area twice, so that the transect spacing was reduced to 0.25 m. In the area with the most interesting archaeological structures, a third pass was made so that the line distance was further reduced to ~0.15 m. The lines were in the east-west direction, at an angle of ~45° with the presumed direction of most archaeological structures, to distinguish possible noise stripes in the direction of the survey lines from linear archaeological traces, and facilitate the suppression of this noise during processing. The same line distance was used for the survey with the 200 MHz antenna, while for the 100 MHz antenna, a line spacing of ~0.5 m was applied. For both the 100 and 200 MHz antennas, the SmartCart was employed. When mounting the antennas onto the SmartCart, we observed that they were elevated ~0.05 m above the flat surface. Raising the antennas off the ground can cause a degradation in horizontal resolution and a decrease in reflection amplitude, even if antenna height is small 3. To lower the antennas, we put small wooden cubes (Figure 3b, No. 1) as connecting pieces between the cart and the frame to which the antennas are attached (No. 2). The prospection was carried out zig-zag (from west to east and from east to west), in step mode using an odometer which triggered a measurement every 0.05 m. The stack was 16 for all three antennas. Table 1 shows further deployment details, also for the instruments not loaned from the NERC GEF and mentioned in this report.
No regular grid was used for data acquisition. Because the investigated area is surrounded by trees, the use of GNSS for positioning was complicated. Therefore the coordinates of the GPR measurements were measured using a robotic total station Leica TS15 P 3”, which continuously followed the prism mounted on the GPR (Figure 3). It was set up using a resection, at a point from where the mobile GPR platform could be tracked everywhere in the prospection area. For each set-up, at least four target points in more open areas were sighted, which were also measured with an RTK GNSS receiver Leica GS15. The position measurements were in the British National Grid coordinate reference system. A navigation tool was used to follow predefined transects as closely as possible.
Processing
Data were processed using algorithms written in the MATLAB programming environment. The following workflow was followed for each frequency separately. (1) The GPR and GNSS data were converted into MATLAB format (this happened using the RGPR package for the data not collected with Sensors & Software instruments; 4). (2) A dewow filter was used (for all frequencies, a time window of 20 temporal samples was used, see Table 1). (3) An algorithm was applied to align the time zero of the different profiles and correct it. (4) A uniform gain was utilized, based on the inverse average envelope of the amplitude of all traces in the dataset. (5) The data were filtered with a low-pass filter with a cut-off frequency equal to twice the centre frequency of the antenna. (6) An algorithm was used to remove horizontal linear background noise (subtraction of the average of all traces in the profile from each trace). (7) The wave velocity was estimated using migration velocity analysis applied to 230 selected profiles collected with different GPR instruments and frequencies, and using a 2-D Stolt migration algorithm, yielding a velocity decreasing with time. The estimated overall average wave velocity was 0.086 m/ns. (8) The obtained velocity function varying with time was used for the 2-D Gazdag (phase shift) migration of the GPR data. (9) For the creation of horizontal slices, the data were interpolated using a Delaunay triangulation, so that a regular grid of 0.05 m × 0.05 m was obtained. (10) To eliminate stripes from the horizontal slices, two algorithms were used: (a) one which for each horizontal slice (consisting of one temporal sample) calculates the mean of all profiles, and equalizes these average values. (b) A short window (5 m) was used in the direction of each transect. For each point in this window, the four closest measurements in cross-line direction were selected, and of the resulting series of points, the median was equalized. (11) Time-to-depth conversion took place using the obtained wave velocities. Depth slices with a thickness of 0.05 m were created. The geophysical results were converted to greyscale images, with a minimum equal to the mean minus 3 three times the standard deviation (black), and a maximum equal to the mean plus three times the standard deviation (white). All values higher than the maximum or lower than the minimum were given the maximum or minimum value, respectively.

Results and interpretation
An important objective of the test carried out in August 2022 was to determine the GPR instrument and frequency resulting in an optimal compromise between penetration depth and resolution. The first step was to verify if our pulseEKKO PRO 500 MHz antennas, which have been used for the survey of Roman sites in the UK and in the Mediterranean 5 6, offered sufficient penetration depth for the deep Roman deposits in York.
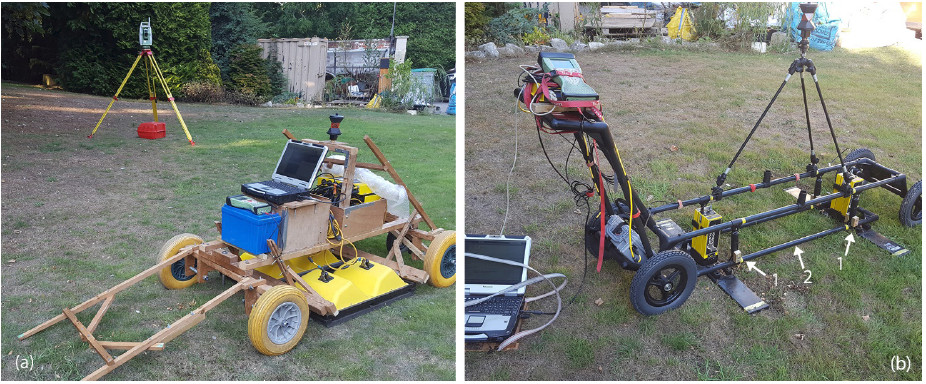
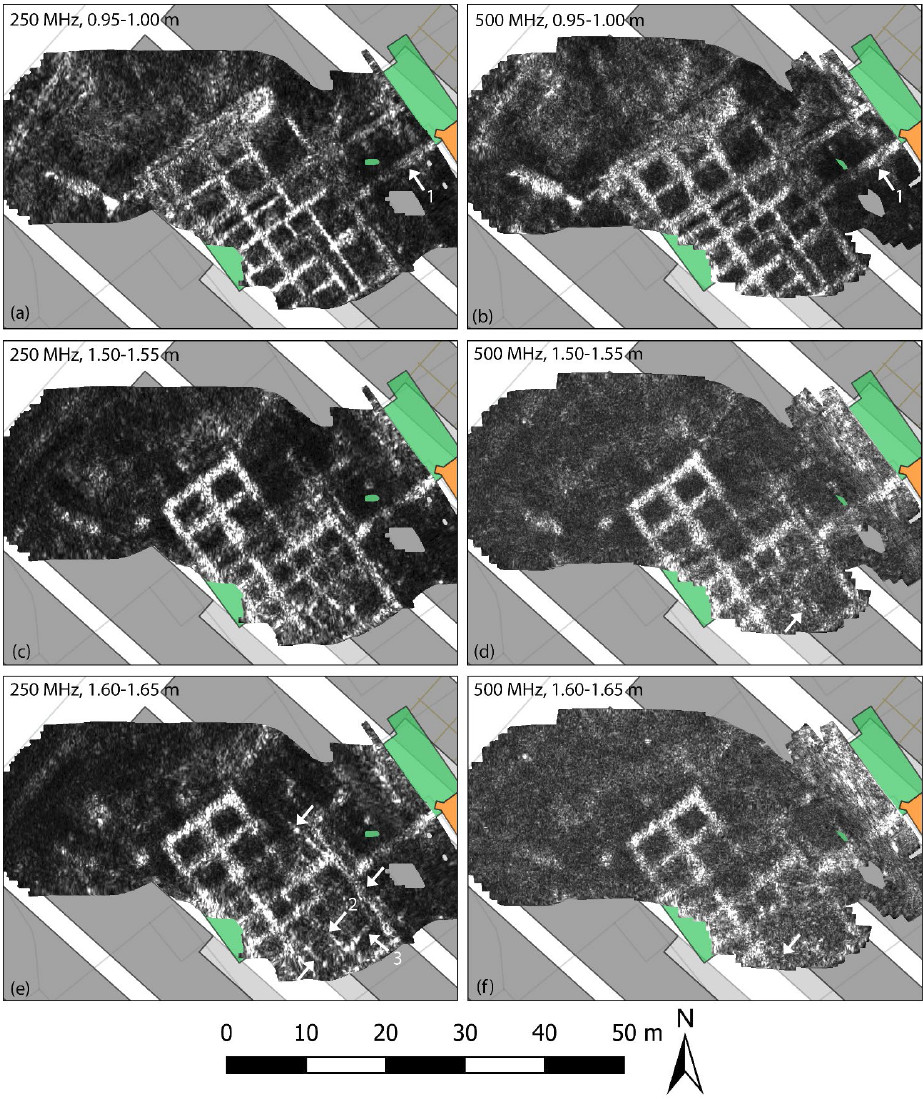
Figure 4 shows the results of the GPR surveys with the pulseEKKO PRO 250 MHz and 500 MHz antennas. At an estimated depth of 0.951.00 m (Figure 4ab), both data sets show several wall foundations running in perpendicular directions, with a thickness of up to 1 m, and encompassing an area of ~525 m². They have the same orientation as the Minster Library (formerly the chapel of the archbishop’s palace). In the 1997 excavation, structures belonging to a stone building supported by pillars were found (Figure 2c), whose shape and location suggested that they contained the archbishop’s private quarters 7. The structures visible in the GPR data can be assumed to be part of this residential wing, with wall No. 1 (Figure 4ab) corresponding to the southeastern edge of the building as it had been hypothesized until now. However, the foundations detected by GPR extend further to the northwest and southeast than had been assumed. At estimated depths of 1.50-1.55 m (Figure 4cd) and 1.60-1.65 m (Figure 4ef), both data sets show the foundations belonging to the archbishop’s palace, although in the 250 MHz data, wall structures running in a slightly different direction are visible (see the arrows in Figure 4e). These seem to be part of a building of ~10.4 m wide and with a visible length of at least 20 m. The orientation and width of this building correspond to the assumed layout of this part of the Roman fortress (Figure 2b), which shows a barrack with a portico facing to the southwest, and (wider) officer’s quarters fronting onto the defence wall 1. In the GPR data, anomaly No. 2 (Figure 4e) probably corresponds to the wall separating the ~7.8 m wide interior space of the barrack from the portico. Anomaly No. 3 presumably indicates a wall dividing two squad rooms. Compared to the hitherto assumed layout, the building visible in the GPR data is located ~1.8 m further to the northeast. From the 250 MHz GPR data, the width of the walls can be estimated to be ~0.5 m, which corresponds to what was found in the 1997 excavations (a width of two feet or 0.6 m), and what was standard practice for the construction of stone walls in legionary fortresses 1. In the 500 MHz data, a few weak anomalies may belong to this building (see the arrows in Figure 4d and 4f), but it is impossible to interpret them only on the basis of the 500 MHz data. This indicates stronger attenuation of the higher frequency GPR waves. That the foundations of the archbishop’s palace remain visible in the 500 MHz data at greater depth, can be explained by the fact that the attenuation is lower in stone than in soil: once the GPR pulse has reached the top of a buried foundation, it can propagate downward more easily, since stone is usually a less electrically conductive medium than soil.
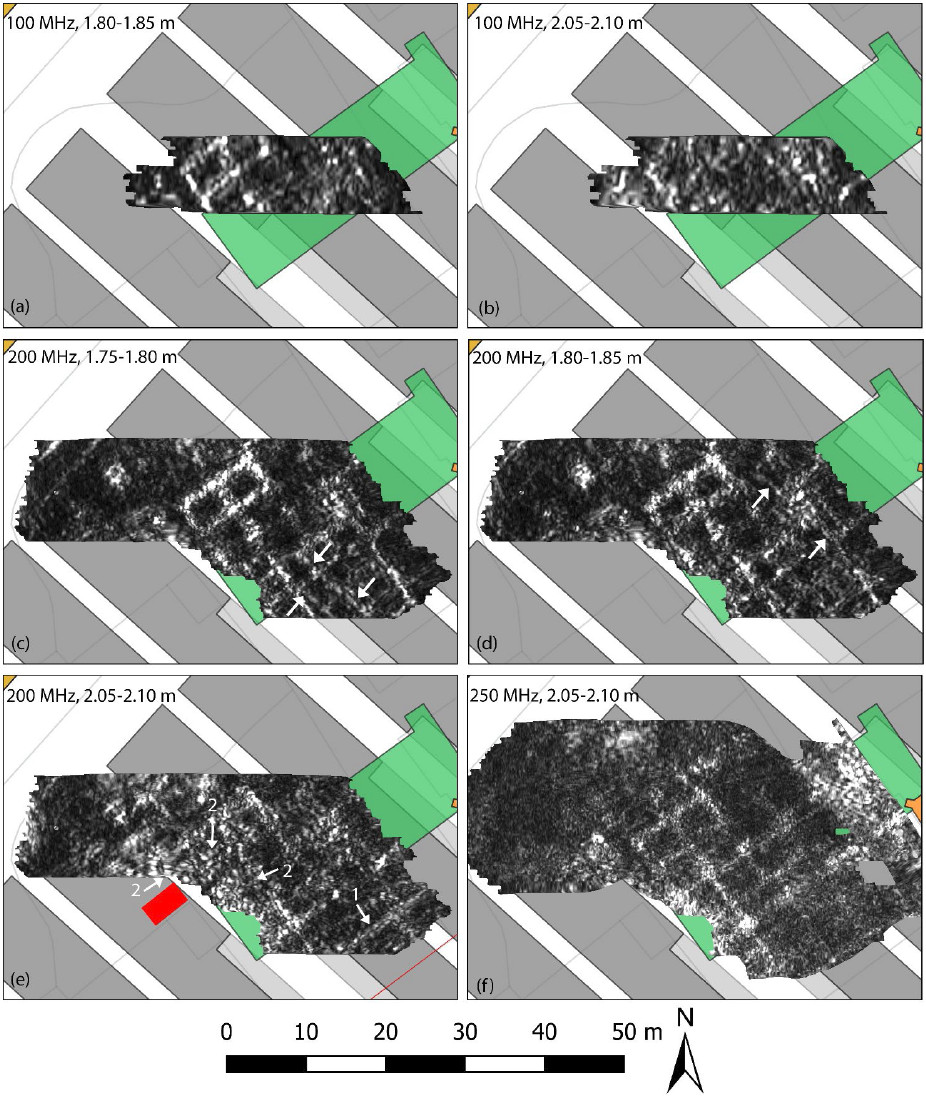
In the data collected with the pulseEKKO PRO 200 MHz antenna, the traces probably related to the Roman barrack are also visible (see the arrows in Figure 5cd), at a slightly larger depth (1.75-1.85 m) than in the 250 MHz data. In the data acquired with the pulseEKKO PRO 100 MHz antenna, no clear traces of the Roman barrack are visible (Figure 5a). These observations can be explained by comparing the approximate width of the barrack walls (0.6 m) to the theoretical horizontal resolution Δl of the employed antennas. Using Δl (see e.g. Annan, 2005 8), where d is the depth and λ is the wavelength of the antenna centre frequency, and using a wave velocity of 0.086 m/ns, the horizontal resolution of the 200 MHz antenna at a depth of 1.75 m is ~0.60 m, whereas it is ~0.85 m for the 100 MHz antenna. At levels deeper than ~2 m, in the 100 MHz data the archaeological structures (including the foundations of the archbishop’s palace) become less clear (Figure 5b), whereas in the data acquired with the 200 and 250 MHz antennas, they can be traced down to a depth of ~2.4 m. Again this may be due to insufficient horizontal resolution in the case of the 100 MHz antenna. In the excavations, it was observed that the foundations of the archbishop’s palace are ~1 m wide (GarnerLahire, 2016), whilst the theoretical horizontal resolution for the 100 MHz antenna at a depth of 2.05 m is ~0.95 m.
In an urban context, unshielded antennas can be more susceptible to external noise and to reflections from above ground 9. We assessed the effect of shielding by comparing the results of the prospection with the unshielded pulseEKKO PRO 200 MHz antenna, to those resulting from tests with the shielded pulseEKKO PRO 250 MHz antenna, and to a GSSI SIR-4000 instrument with a shielded 200 MHz antenna (not loaned from the NERC GEF).
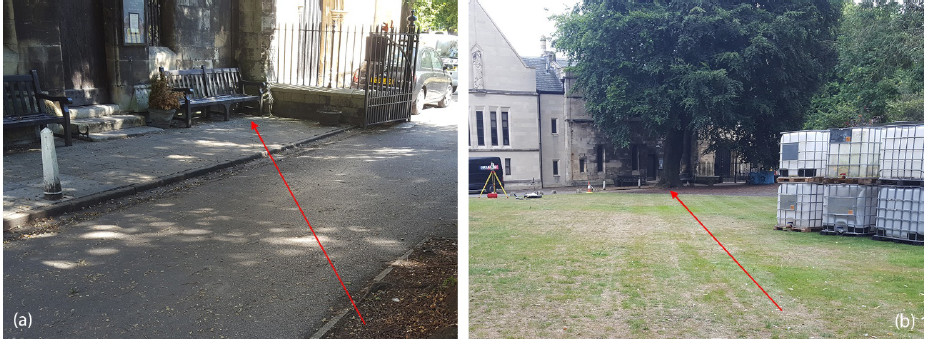
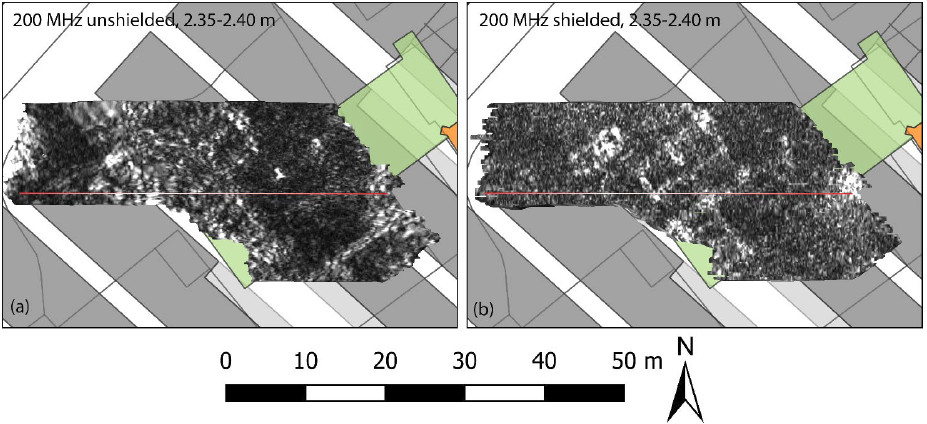
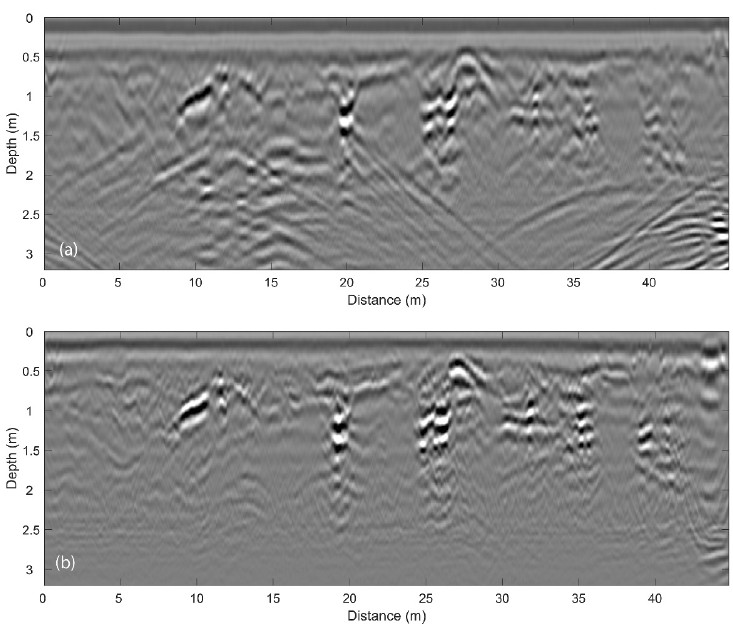
In the horizontal slice at an estimated depth of 2.05-2.10 m, several artefacts are visible in the data collected with the unshielded 200 MHz antenna (see the arrows in Figure 5e), but these are absent from the 250 MHz data set (Figure 5f). Artefact No. 1 is a reflection caused by a low wall supporting metal railings enclosing the Residence Garden. It runs at a distance of ~2 m from the southeastern limit of the prospection area (the red line in Figure 5e; Figure 6a). Artefact No.2 can be explained by the presence of water tanks reinforced with steel bars (the red rectangle in Figure 5e; Figure 6b) and masks several archaeological structures. When comparing the unshielded 200 MHz antenna with the shielded GSSI 200 MHz (Figure 7), the same difference in data quality becomes apparent. At greater depth, the amplitude of the reflections from structures in the subsurface is weaker compared to the amplitude of the above-ground reflections. Also in the vertical profiles, it can be seen that the presence of reflections originating from aboveground objects obscures the wall foundations between 10 and 25 m at depths of >1.5 m in the data collected with the unshielded 200 MHz antenna (Figure 8).
Conclusion
For the GPR survey of deeply buried archaeological remains, it is useful to perform test surveys with different antenna frequencies. This study demonstrated that even in dry and relatively low conductive soils, 400-500 MHz antennas often used for archaeological prospection may not be able to detect foundations or walls buried deeper than 1.5 m. Optimal results were obtained with frequencies between 200 and 300 MHz, which detected ~0.5 m wide wall structures belonging to a Roman barrack situated at 1.52 m depth. In a normal soil, lower frequencies (100 MHz) may lack sufficient horizontal resolution to detect structures smaller than 1 m at a depth of 2 m. When using the Sensors & Software SmartCart with the unshielded pulseEKKO PRO 100 and 200 MHz antennas on a flat surface, there is an air gap between the antennas and the surface, and ground-coupling can be improved by slightly lowering the antennas. In urban environments, above-ground reflections can complicate the interpretation of GPR data, and this is the case especially for low frequency unshielded antennas. In our results acquired with the unshielded pulseEKKO PRO 100 and 200 MHz antennas, water tanks reinforced with steel bars created an artefact with a radius of ~10 m at a depth of 2.4 m, masking an important part of the archaeological structures. The use of unshielded antennas should therefore be avoided in densely built-up areas. The pulseEKKO PRO 250 MHz antenna not only presents a good compromise between penetration depth and resolution, but is also relatively lightweight and easier to handle than the unshielded antennas, which made it the preferred instrument for the complete GPR survey of the open areas within the `Roman York beneath the streets’ project.
References
-
Garner-Lahire, J. 2016, Excavations at the Minster Library, York 1997. BAR British Series 622. ↩ ↩2 ↩3
-
Grasmueck, M., Weger, R. and Horstmeyer, H. 2005. Full resolution 3D GPR imaging. Geophysics 70: K12 K19. ↩
-
Diamanti, N. and Annan, A.P. 2017. Air-launched and ground-coupled GPR data. In: 11th European Conference on Antennas and Propagation (EUCAP), Paris, 19-24 March 2017. New York: IEEE, 1694-1698. ↩
-
Huber, E. and Hans, G. 2018. RGPR – An open-source package to process and visualize GPR data. In: 17th International Conference on Ground Penetrating Radar (GPR), Switzerland, Rapperswil, 18-21 June 2018, pp. 1-4. ↩
-
Verdonck, L. 2016. Detection of buried wall remains in ground-penetrating radar data using template matching. Archaeological Prospection 23: 25772. ↩
-
Verdonck, L., Launaro, A., Vermeulen, F. and Millett, M. 2020. Ground-penetrating radar survey at Falerii Novi: a new approach to the study of Roman cities. Antiquity 94(375): 705723. ↩
-
Perring, S.M., 2010, The Cathedral landscape of York. The minster close c. 15001642. PhD Thesis. University of York. ↩
-
Annan, A.P. 2005. Ground penetrating radar. In Butler D.K. (ed.), Near Surface Geophysics. Tulsa: Society of Exploration Geophysicists. (Investigations in Geophysics 13), 357-438. ↩
-
van der Kruk, J. and Slob, E. 2004. Reduction of reflections from above surface objects in GPR data. Journal of Applied Geophysics 55(34): 271278. ↩
Acknowledgements
We are grateful to the Chapter of York for giving us access to the survey area, and for logistical and other support. The Department of Archaeology at Ghent University, the Department of Archaeology at the University of Reading and the Faculty of Classics at the University of Cambridge are thanked for providing GPR and positioning equipment. Funding for this research was provided by the Arts and Humanities Research Council (grant ref. AH/V015338/1), the Research Foundation Flanders (FWO), the Paris Region Fellowship Programme and the European Union’s Horizon 2020 research and innovation programme (Marie SklodowskaCurie grant agreement No. 945298; postdoctoral fellowship of Lieven Verdonck).
Publications (including conference presentations)
Verdonck, L. 2022. Ground-penetrating radar surveys of Roman towns in 2022 (Italy, France and the UK) illustrating some principles of the technique. International Mediterranean Survey Workshop Fall 2022, Brussels, 2-3 December 2022.
The “Roman York beneath the streets” project is still ongoing, and several publications will be submitted in the near future, including the results described in this report.
Archiving
The data collected with the GPR equipment loaned from the NERC GEF will be an open access archive in Apollo, the institutional repository of the University of Cambridge (https://www.repository.cam.ac.uk/home), according to the conditions of the AHRC grant that was awarded for the “Roman York beneath the streets” project.
