Scientific Report 1147
This is a Reduced Scientific Report resulting from our minor loan scheme.
Summary
A wetland restoration project is being undertaken in Calstock, Cornwall, with the aims to mitigate flooding, increase biodiversity and potentially act as a carbon sink. NERC projects LOCATE and subsequently AgZERO have been supporting a sustained period of regular carbon monitoring in the Tamar Catchment, of which Calstock is located. The development of the wetland in this catchment has provided opportunity to monitor the carbon sequestration of this marshland throughout its development.
In order to supplement these carbon measurements, the loan of a differential GNSS (dGNSS) system and subsequent support from NERC GEF enabled a high resolution, high accuracy three-dimensional Digital Surface Model (DSM) to be delineated of the project area during multiple surveys.
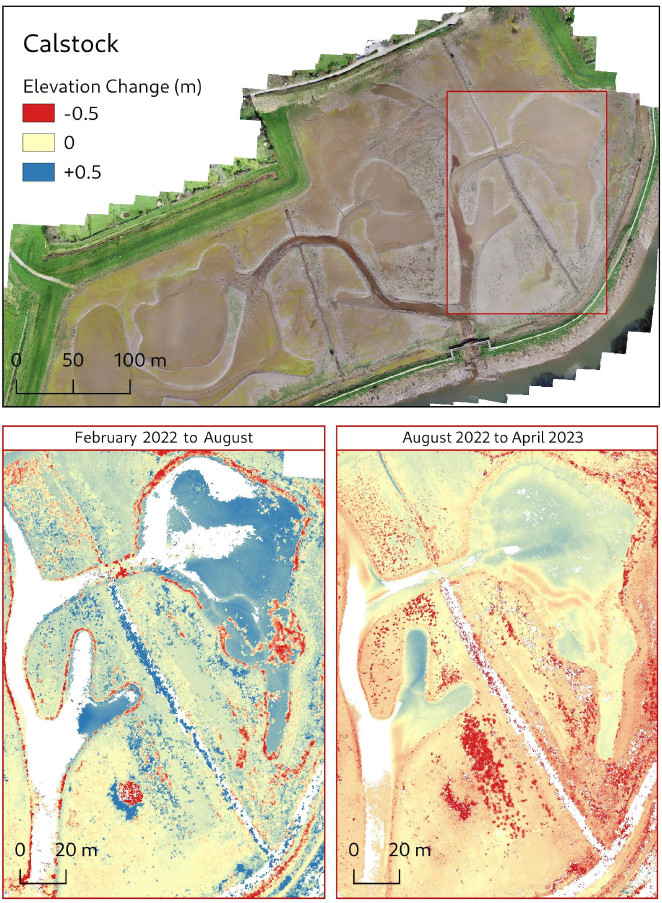
Comparison of these DSMs show regions of sediment accumulation and erosion within the wetland site. Sediment accumulation within areas exceeds 50cm.
Future work within AgZERO will compare the concentrations of carbon at low and high tides with the sediment accumulation to provide insight into the effectiveness of such wetland restoration projects for capturing carbon and provide insight into the physical and biochemical dynamics of this environment.
Background
To monitor the sediment dynamics of the restored wetland in Calstock, Cornwall (Figure 1), bi-annual UAV photographic surveys were undertaken. To date there have been three surveys; February 2022, August 2022 and April 2023.
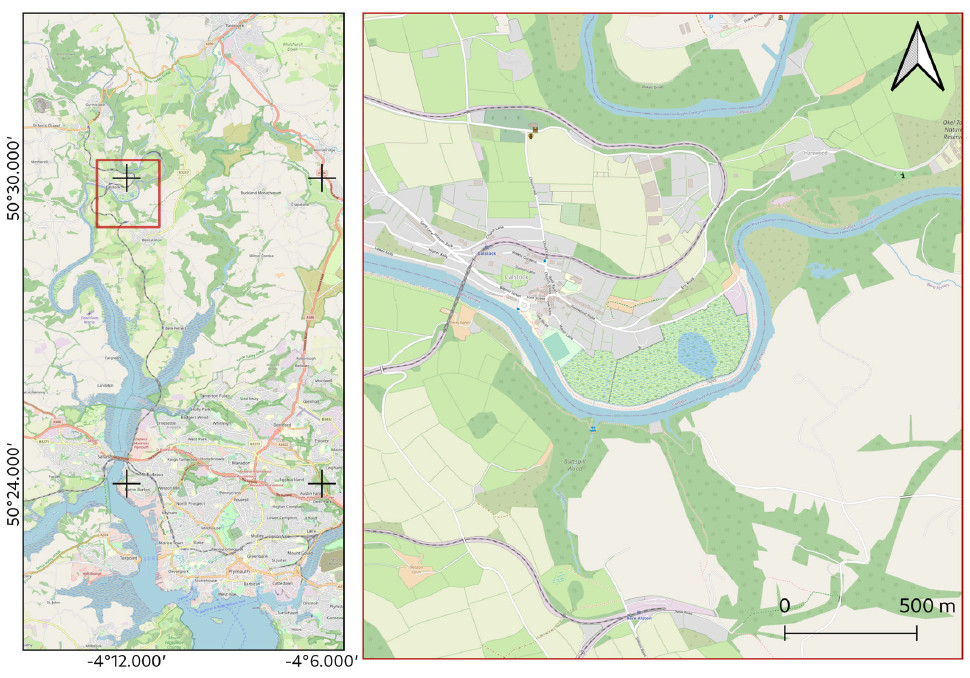
Structure-from-Motion (SfM) is a photogrammetry technique which allows the delineation of three-dimensional surfaces from overlapping photographs. By utilising UAVs photography. This is an effective method of producing a high resolution Digital Surface Model (DSM) of an area in the order of multiple hectares.
However, the products produced by SfM methods lack the accuracy required for scientific research when using consumer grade drones with no additional GNSS technologies available such as Real-Time Kinematic (RTK) positioning. This issue was overcome due to the ability to loan a NERC GEF Differential GNSS system. Instead of using the GNSS to refine the low-quality on-board UAV GNSS data, a basestation and rover were used to collect high accuracy Ground Control Points of targets across the survey site, which were later used to calibrate the DSM and quality check the reliability of the data.
Equipment received as part of the NERC GEF loans to enable this work is presented in Table A.

Survey Procedure
One GNSS receiver was deployed as a basestation with the other used as a rover. After deploying the basestation, a selection of chequered ground targets were deployed throughout the survey site. Targets were deployed to be as spread out as possible, but also represent a range of elevations.
Throughout the UAV survey, the team collected GPS readings of all targets. Due to having to precisely measure the surface of mud, NERC GEF helpfully advised to use a bipod rather than just the staff as this allowed the surveyor to minimise disrupting the mud surface. The rover was used to collected at least ten points of the marked centre of the chequered targets.
The UAV flight was configured to cover the entire survey area and take photographs with 60% sideways overlap and 80% forward overlap (as per the prerequisites for SfM processing).
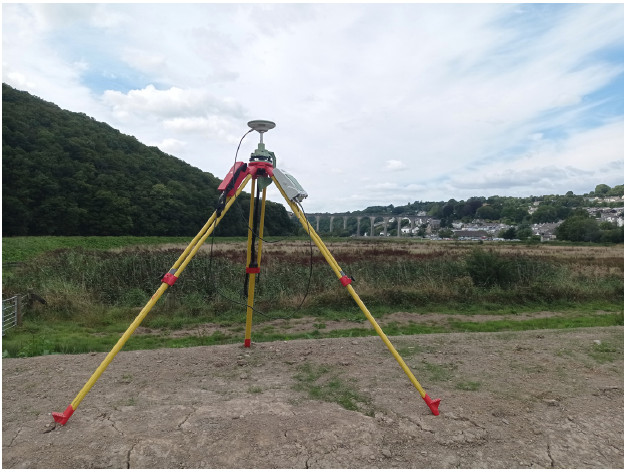
Figure 2 shows the NERC GEF GNSS basestation deployed in the field.
Data Quality
At the end of the survey, an additional four repeat measurements were taken of the first four targets to evaluate the measurement accuracy. Each point measurement was taken over 2 minutes. These steps to ensure data quality were advised by NERC GEF. Examination of the four repeat measurements showed that the deviation in measurements did not exceed 1 cm for any of these point comparisons. This error with within of what is expected to be introduced from measuring non-solid surfaces of soil and mud.
Processing and modelling
Post processing of GNSS data was undertaken using the NERC GEF laptop and Leica Infinity software provided by the loan. Additional basestation data from the `PMTH’ Ordnance Survey 12 km away was accessed and used to adjust the positions recorded of the Calstock basestation. Next, the adjusted Calstock basestation measurements were used to apply adjustments to the points collected with the rover.
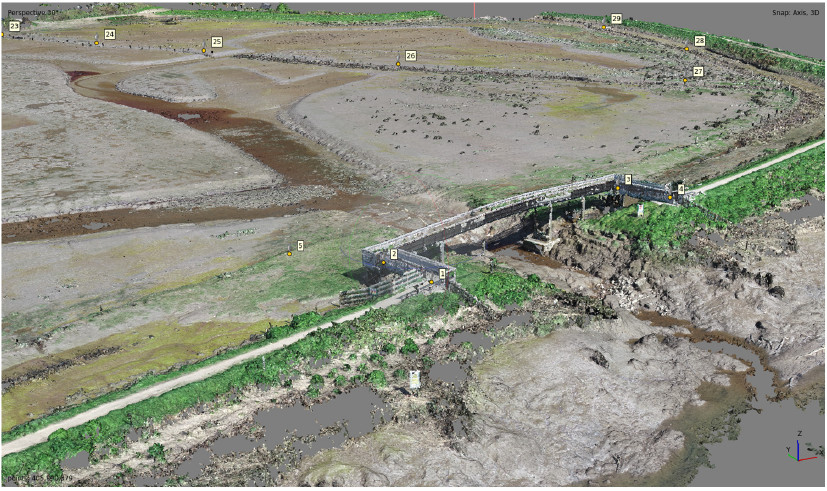
A Python program was used to extract the UAV on-board positioning (latitude and longitude) and attitude (roll, pitch and yaw) data relative to the camera from the digital photographs. The SfM processing was then undertaken using Agisoft Metashape SfM software in a multistep semi-autonomous process. Firstly, the photograph position and attitude data are imported for each photograph. Second, tie points of matching features are detected throughout all applicable photographs. Third, the post-processed dGNSS derived ground control points are imported and manually calibrated to the locations of the targets visible in relevent photographs. With those steps, Metashape produces a three-dimensional point cloud of the data (shown in Figure 3).
Subsequently, this point cloud is used to construct a DSM; a grid of surface elevation values. This DSM is used to orthorectify each image for geometric distortions and are then merged into a singular orthomosaic. A DSM and orthomosaic from data collected in August 2022 are presented in Figure 4.
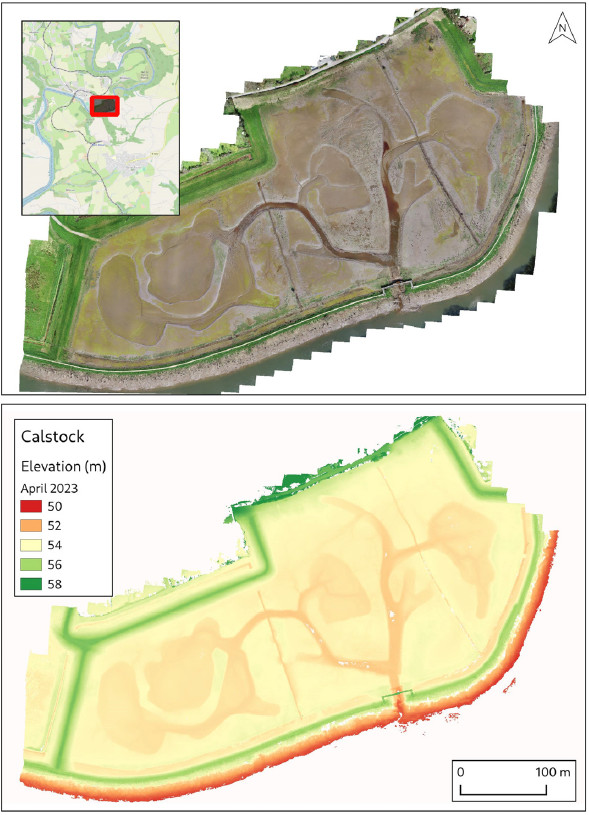
The resulting orthomosaics have a resolution of 1 cm and the DSM has a resolution of 2 cm.
The DSMs produced from each site where then further processed using GIS software QGIS in order to create elevation difference datasets. Each of the three DSMs were aligned to the same grid with a pixel size of 2 cm using nearest neighbour sampling. Then, the difference in elevation between two dates was calculated by subtracting the elevations of each pixel of the later dataset from the elevations of each pixel in the earlier data set. This processed was conducted three times to calculate the difference in elevation between 2022/02/04 to 2022/08/31, 2022/08/31 to 2023/04/18 and an overall change in elevation between 2022/08/31 to 2023/04/18.
Interpretation to date
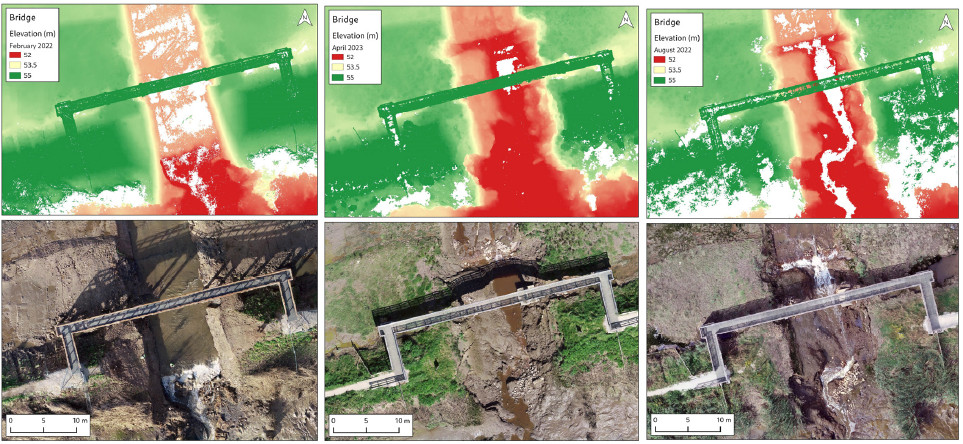
Due to the high spatial resolution of UAV photography, the resulting orthomosaics provide excellent insight into land use and surface types. Analysis is further supplemented by the DSM. From the first survey undertaken in February 2022, the resulting data immediately showed geomorphoical evidence of significant erosion under the footpath bridge on the site as shown on Figure 5.
Preliminary findings
The elevation change datasets created from the difference between elevations of the three DSM have allowed quantification and visualisation of the spatial changes in land use and sediment accumulation between the survey dates. Figure 6 clearly shows how the sediment accumulation rate was greatest between February 2022 and August 2022 when compared with the changes between August 2022 and April 2023. Between February 2022 and August 2022, the surface elevation of sediment in the east pool of the project site increase by 50 cm in places.
Conclusions and recommendations
Future work includes approximating the volumetric increase in sediment within the wetland which can then be used to make estimations of the total carbon sequestered over time within the wetland. Members of project have already made estimates of how much carbon currently resides in the new sediment of the area and it is planned to return to the site to take depth measurements. Depth data, along with these DSMs, will be used to calculate the volumetric mass of sediment accumulated and along with carbon concentration data will be used to calculate and evaluate the effectiveness of this sort of marshland redevelopment scheme for carbon capture.
Location of the archived data
Data will be submitted into the Centre for Environmental Data Analysis (CEDA) Archive upon project completion.
Publications (including conference presentations)
None to date.
