
Scientific Report 1114
This report is also available as a PDF document .
Abstract
Vegetation structure has a significant impact on snow modelling. Here, we surveyed a subalpine forest used for snow-forest interaction research in Davos, Switzerland through Terrestrial Laser Scanning (TLS). By voxelising the TLS data, we produce a three dimensional map of gap fraction that we use to drive the shadowVox radiative transfer model. These model runs will be used in future to evaluate the accuracy of shadowVox simulations of in-situ radiance measurements, optical satellite surface reflectance retrievals and satellite lidar measurements.
Background
Snow cover has a significant impact on the Earth’s radiative budget (Gulev et al., 20211). This is due to snow having a high albedo relative to other terrestrial surfaces. Modelling of interactions between radiation, snow and forest canopies are required to quantify the impact of snow on the albedo of forested regions (Essery, 20132). The shortwave radiation budget of forest snowpacks at meter scale is predominantly controlled by canopy shading (Malle et al., 20193). The propagation of radiation through forest canopies is highly variable due to the heterogeneity of forest structure; this causes variability in the radiative budget of below-canopy snow. Parameterisation of these small-scale radiative processes within global climate models could contribute to improved projections of future snow-albedo interactions (Ni-Meister and Gao, 20114).
The aim of this survey was to collect a large continuous Terrestrial Laser Scanning (TLS) plot in an area of subalpine forest with a diversity of tree ages and stand geometries. This was then used to build voxel scenes for the shadowVox radiative transfer model (Hancock, in prep). shadowVox offers a fast, efficient method for modelling shortwave radiative transfer through forest canopies; model scenes are built through the voxelisation of TLS data into three dimensional maps of gap fraction. The forest at Laret, Davos, Switzerland (Figure 1, 9.875 °E, 46.845 °N) has been used for a number of previous and ongoing forest-snow interaction studies (e.g. Webster et al., 20165; Malle et al., 20193; Mazzotti et al., 20216). While the survey was being undertaken, weather station and radiometer measurements were being collected alongside regular snow pit measurements. The site is an example of a forest managed by selective harvesting, constituted primarily of Norway Spruce with smaller populations of pine and larch. The selective harvesting practice means that the trees at Laret range from saplings to fully-matured trees.
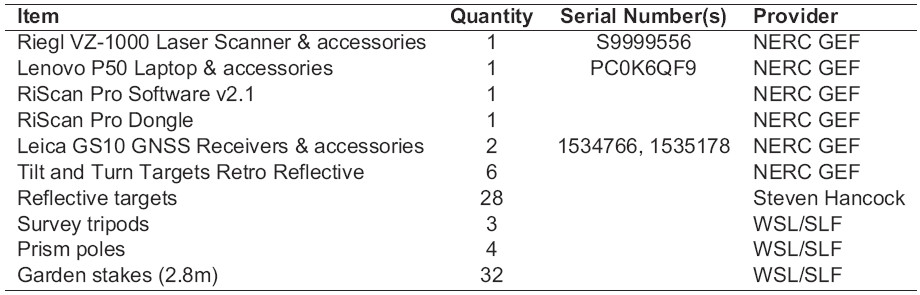
The survey was undertaken using the equipment described in Table 1 during March 2022; this was the beginning of the local snowmelt season (Tobias Jonas, personal communication). The snow suppressed the understorey such that the survey measured trees but not shrubs. Snow melt meant that the snow depth changed over the course of the month. However, the ground remained snowcovered throughout with the exception of some bare patches at the base of exposed trees in the final week.

Survey procedure
Geolocation
Global Navigation Satellite System (GNSS) base and rover stations were used to geolocate the survey. A reference point was established by marking a short fence post near to the access point for the field site with a clear view of much of the sky; the GNSS base station was established directly over this pin. Tilt-and-turn targets were placed on a tripod and 4 prism poles spread across the two largest clearings within the plot, all visible from the intended first scan position while being at a range of elevations. Screw-to-stub adapters were used to allow for easy exchange of targets with the GNSS rover antenna. Target positions were measured using the rover, working anticlockwise and beginning and ending at the same target. The rover was left at the first target position for extended periods before and after surveying the other target locations, which were themselves measured for five minutes each.
Rolling target workflow
Before beginning the TLS survey, targets were distributed in the south-western corner of the field site. Targets were not placed on a regular grid. Instead, we aimed to maximise the number of viable scan positions with line of sight to each target. The field site was accessible to the public, and so it was requested by our partners at the Institute for Snow and Avalanche Research (SLF) that we minimise the footprint of our survey when we were not present at the site. We therefore spread the targets across an approximately 50 50 m area to begin. Once this area was scanned, targets near the center of this area were rolled north-eastwards, with targets at or near the boundary remaining to act as tiepoints for the next set of scans.
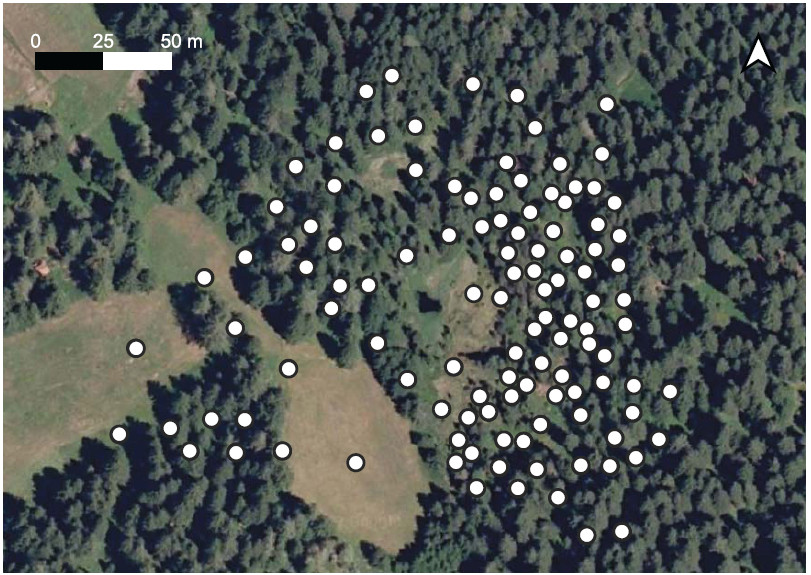
Our first TLS position was at the high point of the clearing in the west of the survey area (Figure 2), with clear line of sight to all tilt-and-turn targets. This ensured that the survey could be geolocated accurately. At this position, and all subsequent positions, the following procedure was followed:
- Set up tripod (relatively level) with tilt mount attached
- Unpack, affix TLS upright and power up
- Measure snow depth of undisturbed snow near tripod position
- Run quick scan to find tie points
- Scan tie points
- While scanning, take photographs to north, east, south, west and upwards from scan position
- Register the scan to ensure a sufficient number of targets are visible
- Run full scan at 0.018 resolution with 400 m range (approximately five minutes)
- If canopy tops were not visible in the first scan, tilt scanner to horizontal and repeat scans
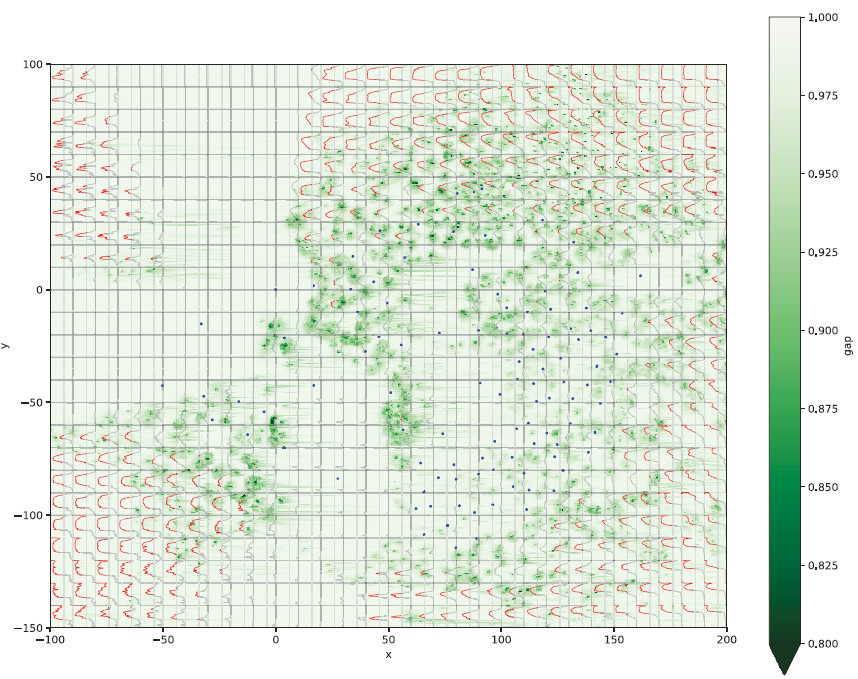
At the end of each field day, all data collected was backed up to a hard drive and to The University of Edinburgh DataStore. TLS scans registered during the day were assessed visually for the accuracy of the registration. At several intervals through the campaign, the data was processed using voxelate (Steven Hancock, 20217) to visualise occlusion (Figure 3) and ensure that the data collected was of sufficient quality. Quality was assessed by determining the stability of the within voxel gap fraction for different combinations of TLS scans, as a function of occlusion from the scans to that voxel. This revealed that, as long as at least one TLS scan position has at less than 60% occlusion to a voxel, that voxel will have a stable gap fraction (and so plant area) estimate. A paper describing this test is in preparation.
Final processing was undertaken in the UK on a different laptop with greater storage. We would recommend using a laptop with significantly larger storage if undertaking surveys of a similar size in future (e.g 2TB).
For gap fraction based methods, assessing the occlusion at regular intervals throughout data collection (Figure 3) can show where additional scan positions are needed. The code used during this study, designed to work with the raw Riegl outputs, is available open-source (Steven Hancock, 20217).
Data quality
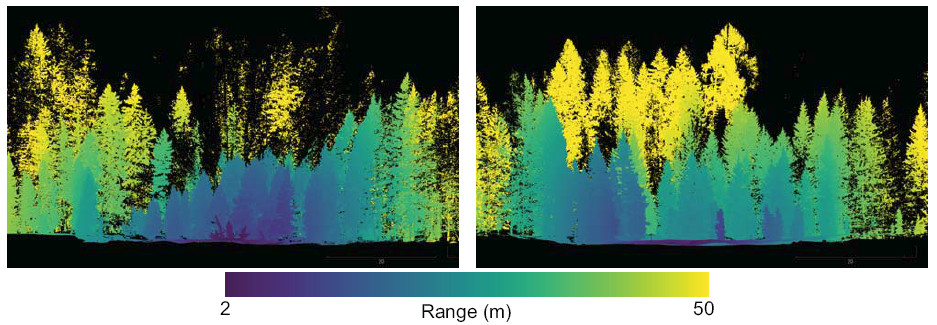
The TLS scan pattern was at a fairly fine resolution (0.018° x 0.018°). This ensured that voxels were intersected by many beams, improving the reliability of gap fraction estimates. Figure 4 shows the facing view from Scan Position 48, which was collected in the center of the clearing being monitored by cablecar- and ground-based radiometers during the survey. In general, wind speeds were low, minimising the movement of trees during and between scans. However, because the intended use of this data was for voxelisation, the suitability of the data for quantitative structural modelling (e.g. Hackenberg et al., 20158) is unknown.
Processing and modelling
Geolocation data
GNSS measurements were process following the protocol provided by GEF using Leica Infinity. Position data from the Automated GNSS Network for Switzerland (AGNES) station DAV2 (usefully situated on the hillside above the SLF office in Davos) was used to improve the base station location accuracy. Rover measurements of tilt-and-turn target locations were processed to get their positions relative to the base station and these positions were then identified in the TLS data.
TLS data
TLS data was processed in RiSCAN Pro 2.1. After registering the scans using tie points, we ran the default multistation adjustment with planes to improve the scan alignment. The scans were then georeferenced using the GNSS survey output for the tilt-and-turn targets.
Once geolocated, the TLS data has been processed using voxelate (Steven Hancock, 20217) to produce 50x50x50 cm voxel maps of gap fraction and Plant Area Index (PAI). These voxel maps can then be used as radiative transfer model scenes for shadowVox. This process is based on the beam geometry as recorded by the scanner as opposed to the point cloud commonly used as output from TLS surveys.
Preliminary findings and interpretation to date
Figure 5 shows example output from shadowVox using the data collected at Laret. It shows that the model replicates the expected spatial distribution of shadows cast by trees at a resolution useful to high-resolution snow modelling research. Future work will assess the accuracy of these sub-canopy insolation measurements against in-situ measurements. These results suggest that TLS-derived voxel scenes offer an efficient route to modelling the light regimes of subalpine forests.penetration of the GPR signal.
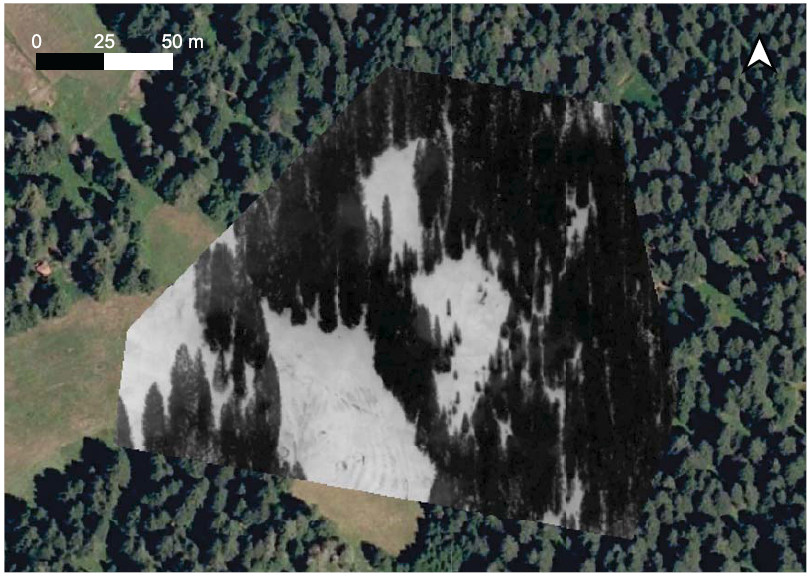
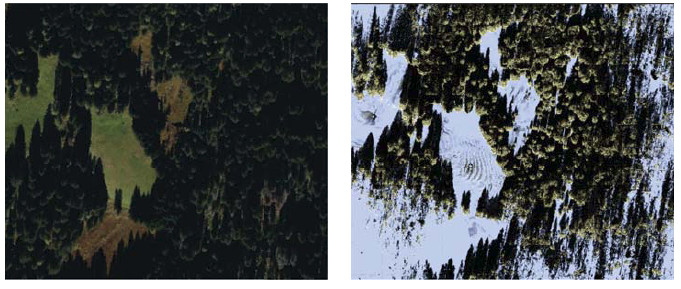
Figure 6 shows a comparison of a Bing aerial image (www.bing.com/maps) with an above canopy reflectance simulation from the TLS voxels. Note that the ground is treated as snow in the simulation. The next step will be to quantitatively validate this simulation against Sentinel-2 data. Note the loss of detail due to occlusion at the right of the simulated image. This is outside of the field plot.
Conclusions and recommendations
We performed a large Terrestrial Laser Scanning survey of subalpine forest in Davos, Switzerland. The data collected was successfully used to build voxel scenes of gap fraction as input into the shadowVox radiative transfer model. Model output aligns well with expected patterns of shading in the forest. Future work will directly validate shadowVox against in-situ radiometry measurements (after Malle et al., 20193) and satellite-derived surface reflectance measurements.
Repeated assessment of occlusion through the course of the survey was beneficial. By mapping the level of occlusion from scans undertaken up to a certain date, future scan and target placement could adapt to ensure that the data collected was of sufficient quality for radiative transfer modelling. The occlusion mapping is available in the voxelate package (Steven Hancock, 20217).
The scale of the survey was limited by the requirement to fine scan targets from each scan position - this process took up the bulk of the time taken at each scan position. Replacing the Riegl VZ-1000 used here with a TLS system which do not require targets for alignment (through use of differential GPS and an inertial measurement unit) would have permitted a significantly larger area to be surveyed. This would be due to time no longer being required to scan targets nor to roll them between survey phases.
Location of the archived data
The data will be archived in the Centre for Environmental Data Analysis (CEDA) archive. Discussions with CEDA are ongoing to determine how the data can be archived to ensure users have access to the data they need. We intend to make the raw TLS data (with scan position and global transformation matrices) available as well as the digital terrain model, digital surface model and canopy height model and a tiled version of the point cloud. Until the data has been archived by CEDA, it can be made available upon request from the University of Edinburgh.
Publications
Hancock (in prep). Evaluation of the shadowVox voxel-based radiative transfer model.
References
-
S. Gulev, P. Thorne, J. Ahn, F. Dentener, C. Domingues, S. Gerland, D. Gong, D. Kaufman, H. Nnamchi, J. Quaas, J. Rivera, S. Sathyendranath, S. Smith, B. Trewin, K. von Schuckmann, and R. Vose. Changing State of the Climate System, page 287 422. Cambridge University Press, Cambridge, United Kingdom and New York, NY, USA, 2021. doi: 10.1017/9781009157896.004. ↩
-
R. Essery. Large-scale simulations of snow albedo masking by forests. Geophysical Research Letters, 40(20):5521 5525, 2013. ISSN 1944-8007. doi: 10.1002/grl.51008. ↩
-
J. Malle, N. Rutter, G. Mazzotti, and T. Jonas. Shading by Trees and Fractional Snow Cover Control the Subcanopy Radiation Budget. Journal of Geophysical Research: Atmospheres, 124(6): 3195 3207, 2019. ISSN 2169-8996. doi: 10.1029/2018JD029908. _eprint: https://agupubs.onlinelibrary.wiley.com/doi/pdf/10.1029/2018JD029908. ↩ ↩2 ↩3
-
W. Ni-Meister and H. Gao. Assessing the impacts of vegetation heterogeneity on energy fluxes and snowmelt in boreal forests. Journal of Plant Ecology, 4(1-2):37 47, Mar. 2011. ISSN 1752-9921. doi: 10.1093/jpe/rtr004. ↩
-
C. Webster, N. Rutter, F. Zahner, and T. Jonas. Modeling subcanopy incoming longwave radiation to seasonal snow using air and tree trunk temperatures. Journal of Geophysical Research: Atmospheres, 121(3):1220 1235, 2016. ISSN 2169-8996. doi: 10.1002/2015JD024099. ↩
-
G. Mazzotti, C. Webster, R. Essery, and T. Jonas. Increasing the Physical Representation of Forest-Snow Processes in Coarse-Resolution Models: Lessons Learned From Upscaling Hyper-Resolution Simulations. Water Resources Research, 57(5):e2020WR029064, 2021. ISSN 1944-7973. doi: 10.1029/2020WR029064. _eprint: https://onlinelibrary.wiley.com/doi/pdf/10.1029/2020WR029064. ↩
-
Steven Hancock. voxelate, 2021. URL https://bitbucket.org/StevenHancock/voxelate/src/master/ ↩ ↩2 ↩3 ↩4
-
J. Hackenberg, H. Spiecker, K. Calders, M. Disney, and P. Raumonen. SimpleTree - An Efficient Open Source Tool to Build Tree Models from TLS Clouds. Forests, 6(11):4245 4294, Nov. 2015. doi: 10.3390/f6114245. Number: 11 Publisher: Multidisciplinary Digital Publishing Institute. ↩
