
Scientific Report 1114
This report is also available as a PDF document .
Abstract
Vegetation structure has a significant impact on snow modelling. Here, we surveyed a subalpine forest used for snow-forest interaction research in Davos, Switzerland through Terrestrial Laser Scanning (TLS). By voxelising the TLS data, we produce a three dimensional map of gap fraction that we use to drive the shadowVox radiative transfer model. These model runs will be used in future to evaluate the accuracy of shadowVox simulations of in-situ radiance measurements, optical satellite surface reflectance retrievals and satellite lidar measurements.
Background
Snow cover has a significant impact on the Earth’s radiative budget (Gulev et al., 2021). This is due to snow having a high albedo relative to other terrestrial surfaces. Modelling of interactions between radiation, snow and forest canopies are required to quantify the impact of snow on the albedo of forested regions (Essery, 2013). The shortwave radiation budget of forest snowpacks at meter scale is predominantly controlled by canopy shading (Malle et al., 2019). The propagation of radiation through forest canopies is highly variable due to the heterogeneity of forest structure; this causes variability in the radiative budget of below-canopy snow. Parameterisation of these small-scale radiative processes within global climate models could contribute to improved projections of future snow-albedo interactions (Ni-Meister and Gao, 2011).
The aim of this survey was to collect a large continuous Terrestrial Laser Scanning (TLS) plot in an area of subalpine forest with a diversity of tree ages and stand geometries. This was then used to build voxel scenes for the shadowVox radiative transfer model (Hancock, in prep). shadowVox offers a fast, efficient method for modelling shortwave radiative transfer through forest canopies; model scenes are built through the voxelisation of TLS data into three dimensional maps of gap fraction. The forest at Laret, Davos, Switzerland (Figure 1, 9.875 °E, 46.845 °N) has been used for a number of previous and ongoing forest-snow interaction studies (e.g. Webster et al., 2016; Malle et al., 2019; Mazzotti et al., 2021). While the survey was being undertaken, weather station and radiometer measurements were being collected alongside regular snow pit measurements. The site is an example of a forest managed by selective harvesting, constituted primarily of Norway Spruce with smaller populations of pine and larch. The selective harvesting practice means that the trees at Laret range from saplings to fully-matured trees.
The survey was undertaken using the equipment described in Table 1 during March 2022; this was the beginning of the local snowmelt season (Tobias Jonas, personal communication). The snow suppressed the understorey such that the survey measured trees but not shrubs. Snow melt meant that the snow depth changed over the course of the month. However, the ground remained snowcovered throughout with the exception of some bare patches at the base of exposed trees in the final week.

Survey procedure
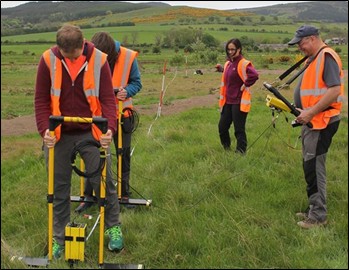
GPR and topographic survey (using dGPS) were carried out on the River Coquet between 17th May and 1st June 2018. We used the NERC Geophysical Equipment Facility (GEF) Sensors and Software Pulse Ekko Pro GPR with a 1000 V transmitter, and 50, 100 and 200 MHz antennas (Figure 2). A common offset (CO) survey using three different frequencies of antennas (50, 100 and 200 MHz) was performed along single lines in the first survey grid (Thropton grid) to establish depth of penetration and data resolution, and to determine which antenna set would be most appropriate to address the scientific goals of the project.
Subsequent GPR grids at Hepple and Holystone were conducted at frequencies of 50 and 100 MHz (Hepple), and 100 MHz (Holystone). The time window used in the initial survey line was 200 ns but this was then changed to 400 ns for 100MHz data acquisition and 600 ns for 50MHz acquisition, to ensure that all subsurface reflections were acquired. The number of stacks was 16 for all the GPR profiles. To calculate subsurface velocities at each site we collected a number of common midpoint (CMP) profiles (Figure 1). CMP surveys were acquired with both 50 MHz and 100 MHz antenna sets to obtain an accurate estimate of the depth by calculating the velocity of the subsurface radar wave. The average velocity calculated for subsurface hyperbola reflections ranged between 0.07 and 0.088 m ns1.
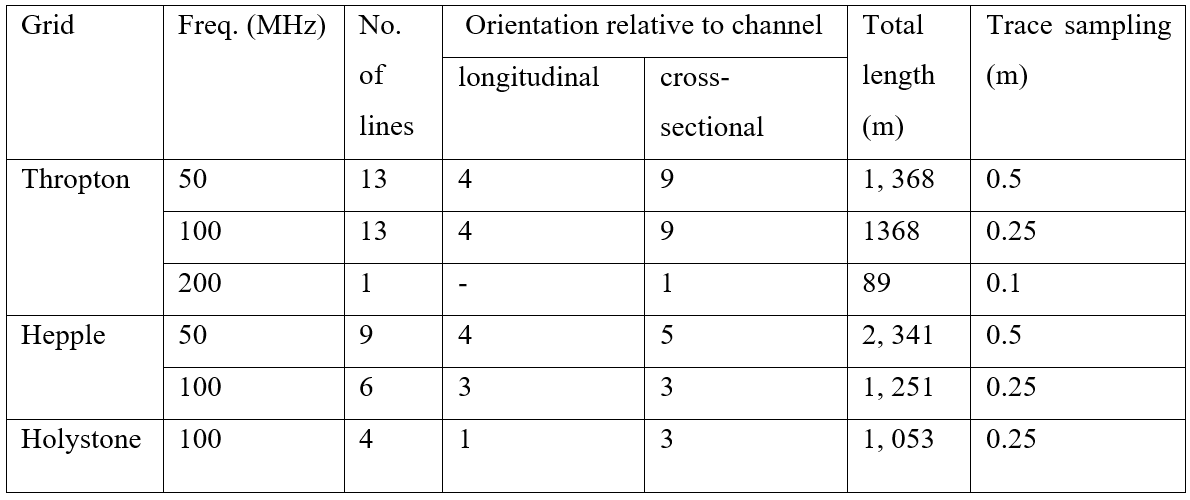
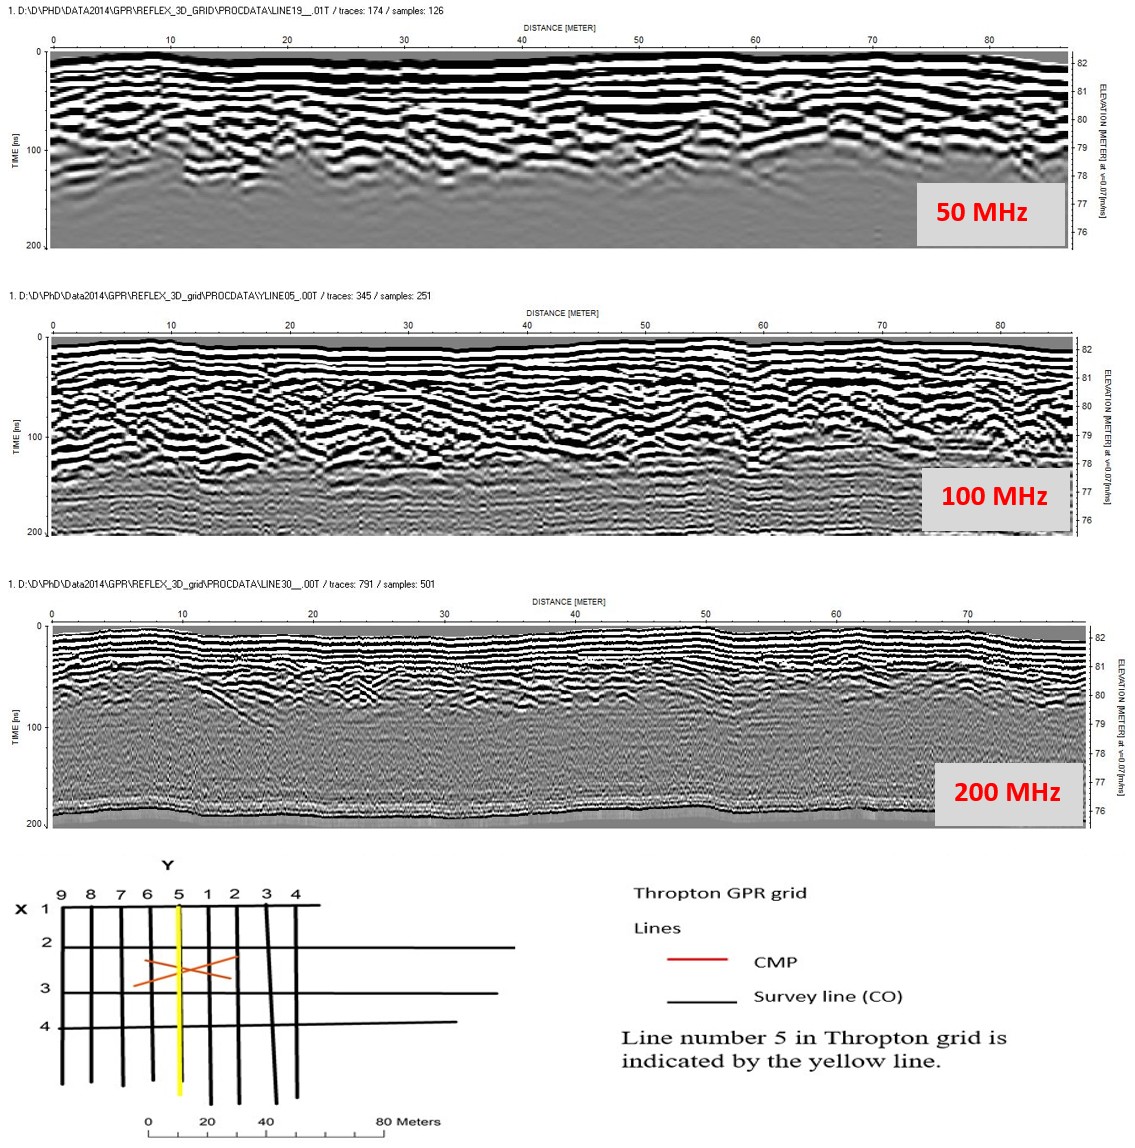
Palaeo-flow parallel and palaeo-flow transverse longitudinal and cross-sectional GPR profiles were acquired at each field site (Table 1). Line number 5 in Thropton grid (Figure 3) was repeated using the three antennas (50, 100 and 200 MHz) to test depth penetration and vertical resolution.
Data quality
Repeat GPR surveys showed that the 50 and 100 MHz frequencies provided significant depth penetration and good resolution, while the high frequency antennas (200 MHz) provided greater resolution but less depth penetration (Figure 3). The quality of data collected was very good, although some profiles in the Hepple grid were affected by above surface reflections from nearby telegraph poles and tree logs. The location of these objects was mapped using hand-held GPS.
Data processing
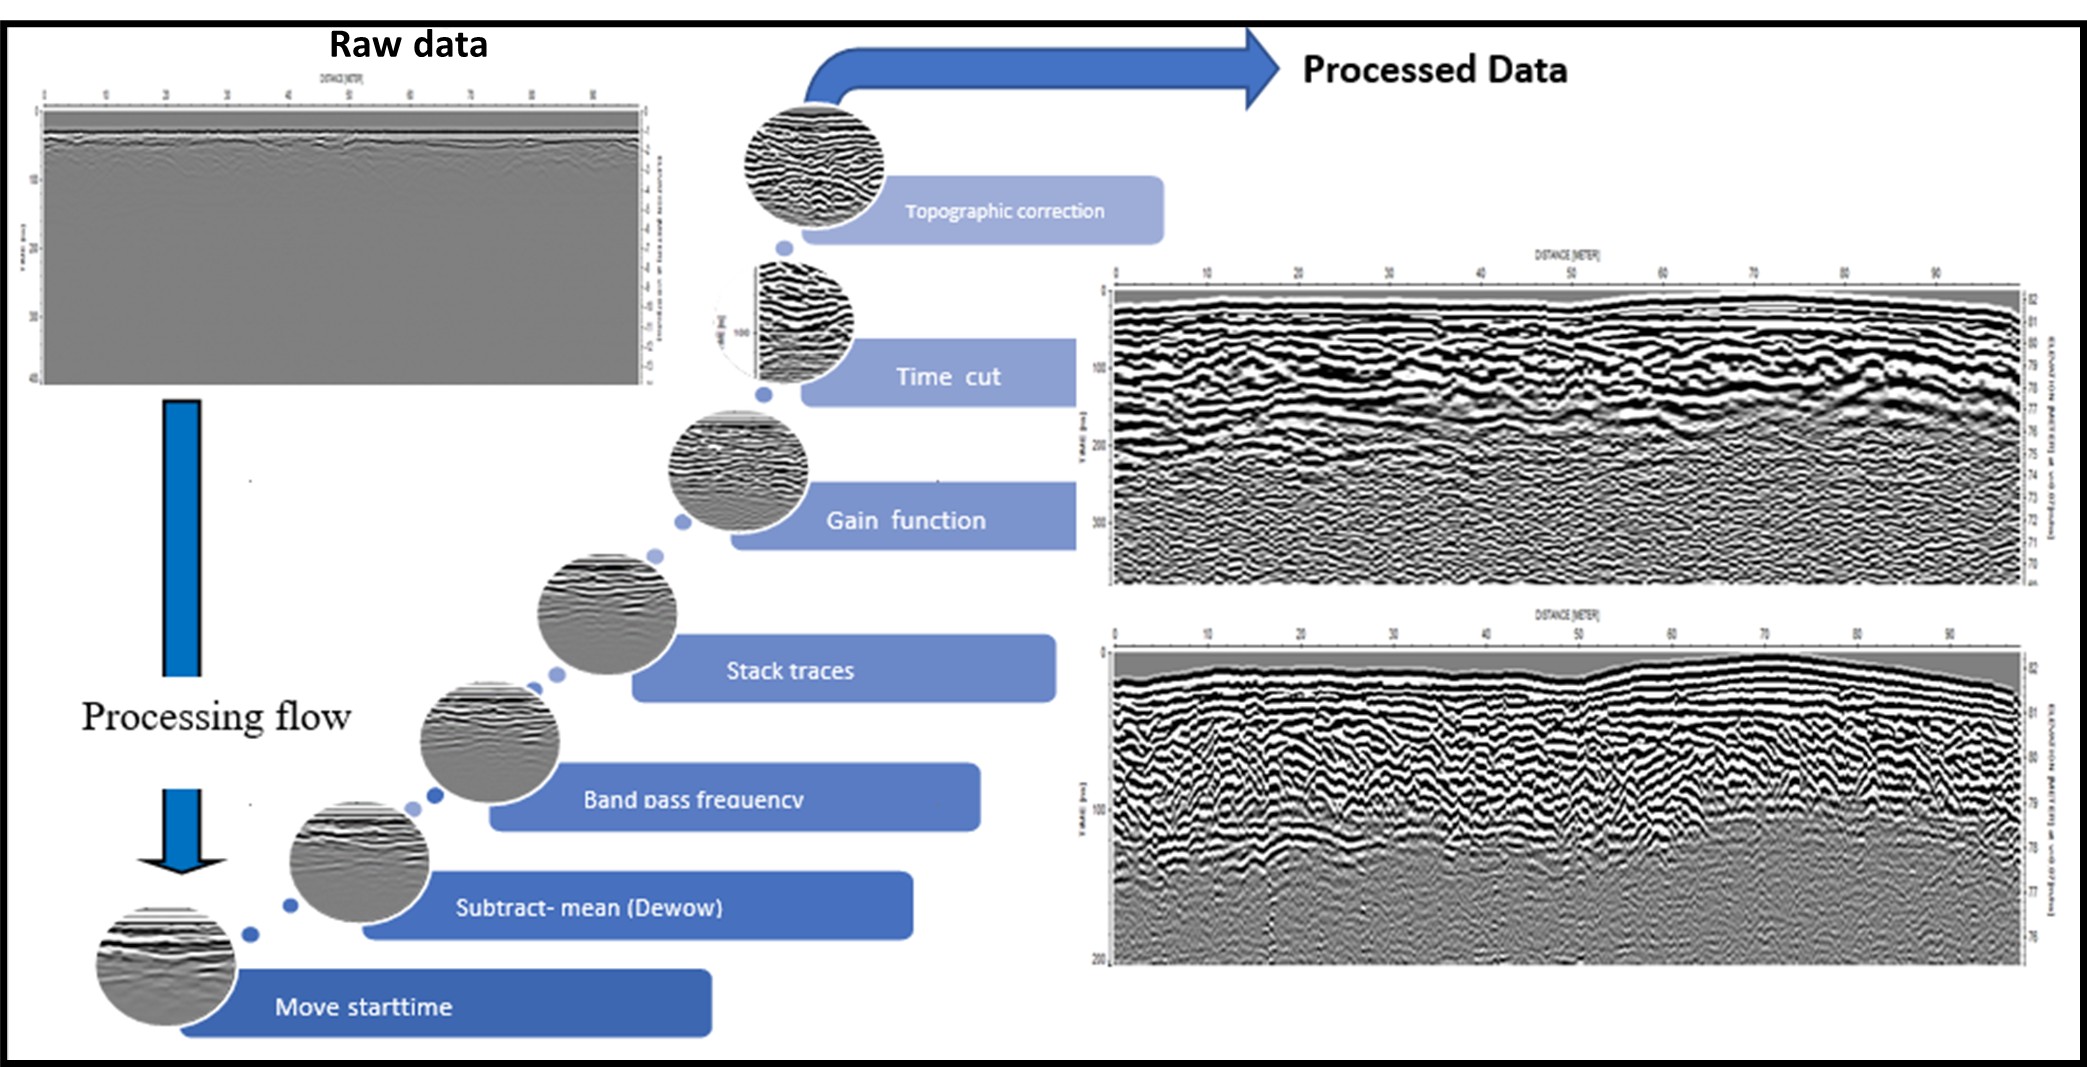
Following data acquisition, all GPR profiles were processed using the Sandmeier software REFLEXW (version 8.5). The main aim of this was to improve the data quality and to get a more realistic image of the subsurface data by enhancing the signal-to-noise ratio (Neal, 20041). Basic processing steps were applied to all GPR lines to improve the data, with variations in processing applied to data acquired at different frequencies. Processing included: (a) move start time to change the arrival time signal; (b) de-wow to remove very low frequency components from the data (Annan, 20022); (c) bandpass filter: different parameters were tested, with the most optimal parameters found to be 35-70-150-225 MHz for the 50 MHz transmitter, while the frequency band chosen for filtering the 100 MHz were 35-70-200-325 MHz; (d) stack traces (number of traces = 3); and (d) gain function to enhance the amplitude of deeper reflections (Cassidy, 20093). Finally, topographic correction was applied to correct the subsurface reflection position. Since the GPR profiles were acquired in alternate directions, every second profile was flipped in the x-direction to provide a comparable view of all profiles. The CMP data were processed using CMP-velocity analysis within REFLEXW to provide an accurate estimate for the subsurface radar velocity.
Interpretation to date
GPR data were analysed and interpreted by identifying reflection patterns based on the shape, amplitude, continuity and reflection configurations, following approaches used in a variety of previous studies of fluvial sedimentary architecture (e.g. Ekes and Hickin, 20014; Skelly et al., 20035; Wooldridge and Hickin, 20056; Kostic and Aigner, 20077; Hickin et al., 2009; Rice et al., 20098; Vandenberghe and van Overmeeren, 19999). The subsurface architecture and stratigraphy of the River Coquet were described from the GPR data. Eight key radar facies were identified to a depth of 7 m in the River Coquet alluvial fill, based on the reflection patterns outlined in Table 2.
RF1 consists of horizontal to subhorizontal, continuous and parallel to subparallel reflections. It is characterised by high amplitude reflections that are gently inclined (0–4°) with an overall lateral extent that is typically in the range of 50 to 100 m. Reflections of this facies were detected at variable depths in the GPR profiles but are mostly found and better-defined in the uppermost units (0.5 - 1.5 m). RF1, commonly observed in the upper units of GPR profiles, represents planar bedding associated with either a lower- or transitional-flow fluvial regime. RF1 is interpreted as upper stage plane beds with horizontal stratification produced by aggradation (vertical accretion) of gravel sheets (Ekes and Hickin, 20014).
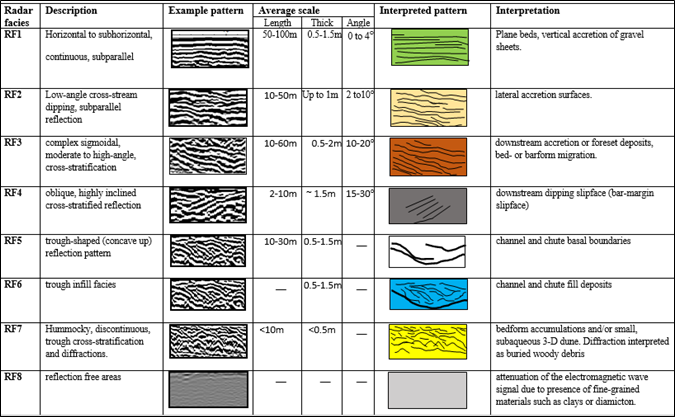
RF2 is characterised by low- to moderate-angle dipping (2-10°, typically 5° more common) reflections representing lateral accretion. This is interpreted as the primary depositional product associated with the process of point bar growth. RF2 is commonly observed in the upper units of GPR profiles. Steeply inclined GPR reflections (RF3 and RF4) are interpreted as bar-margin slipface deposits that document downstream bar progradation, where sediments have avalanched down the distal face of high-relief amplitude bars into deeper water, associated in the Coquet with high stage flows. The high-amplitude reflections in these facies reflect contrasting dielectric properties associated with the internal size and sorting of foreset beds composed of sand and gravel. RF5 and RF6 represent trough-shaped (concave-up reflections) reflection patterns and trough infill facies. These facies are interpreted as the basal contact of channels and chutes, and the subsequent channel infill structures. RF7 is characterised by individual high- to moderate-amplitude reflections that dip in different directions. This radar facies is the most frequently occurring and is characterised by short, discontinuous irregular subparallel and wavy reflections. In fluvial systems, hummocky reflections consisting of planar and trough cross-stratified sets comprised of poorly-sorted sand and gravel are interpreted as 3-dimensional dune bedforms (Mumpy et al., 200710). RF8, found at depths greater than 7 m, is a zone where no or few reflections arise, or is a zone of noise and enhanced attenuation of the radar signal. This likely indicates the presence of clay-rich material, possibly subglacial till, that prevents further penetration of the GPR signal.
Conclusions and recommendations
The upper ~2 m of the of stratigraphic succession, associated with ‘known’ channel pattern change over the past 160 years, is dominated by lateral accretion facies which represents point bar accretion associated with progressive lateral channel migration. Although the GPR-derived sedimentary architecture of the River Coquet is broadly comparable with other models of wandering gravel bed rivers (e.g. Wooldridge & Hicken, 20056), structures related to individual unit bars and sand sheets are harder to identify due to the Coquet having a lower relief amplitude. Work is in process to generate a three-dimensional interpretation block of depositional units using OpendTect software. GPR has proved very effective in characterising the sedimentary architecture of one of the UK’s most active wandering gravel-bed rivers.
Acknowledgments
The authors are grateful for loan of a PulseEKKO Pro GPR system from the NERC Geophysical Equipment Facility. We would like to thank landowners in the study sites for allowing access to their properties. Thanks also go to the Physical Geography team of academic staff and fellow postgraduate students from Newcastle University for their assistance in field data acquisition.
Location of the archived data
The data has been backed up and archived in the institutional data repository, data.ncl https://data.ncl.ac.uk/, which is powered by Figshare https://doi.org/10.25405/data.ncl.28351814.
PhD Thesis
Al Zerouni, S. (2021) Controls on decadal morphological change and sedimentary architecture of the wandering gravel-bed River Coquet, Northumberland, UK. PhD thesis, School of Geography, Politics and Sociology, Newcastle University, UK
Conference presentations
-
Al Zerouni, S., Russell, A.J., Large, A.R.G., Ross, N. (2022) Controls on morphological change within wandering gravel-bed rivers over decadal time scales: River Coquet, Northumberland, UK. British Society for Geomorphology Annual Meeting 5th-7th September 2022. Northumbria University (poster presentation).
-
Al Zerouni, S., Russell, A.J., Large, A.R.G., Ross, N. (2018) Quantifying 3-D morphological change within wandering gravel-bed rivers over time: the River Coquet, Northumberland, UK. European Geosciences Union General Assembly. 8th-13th April 2018. Vienna, Austria (oral presentation).
-
Al Zerouni, S., Russell, A.J., Large, A.R.G., Ross, N. (2017) Controls on morphological change within wandering gravel-bed rivers over decadal time scales: River Coquet, Northumberland, UK. 56th BSRG annual meeting, 16th-19th December 2017. Newcastle University (oral presentation).
References
-
Neal, A. (2004) Ground-penetrating radar and its use in sedimentology: principles, problems and progress. Earth-Science Reviews, 66(3–4), 261-330. ↩
-
Annan, A.P. (2002) GPR - History, Trends, and Future Developments. Subsurface Sensing Technologies and Applications, 3(4), 253-270. ↩
-
Cassidy, N.J. (2009) Ground Penetrating Radar Data Processing, Modelling and Analysis. In Jol, H.M. Ground Penetrating Radar Theory and Applications. Amsterdam, Elsevier: 141-176. ↩
-
Ékes, C. and E.J. Hickin (2001) Ground penetrating radar facies of the paraglacial Cheekye Fan, southwestern British Columbia, Canada. Sedimentary Geology, 143(3), 199-217. ↩ ↩2
-
Skelly, R.L., Bristow, C.S. & Ethridge, F.G., (2003) Architecture of channel-belt deposits in an aggrading shallow sand bed braided river: the lower Niobrara River, northeast Nebraska. Sedimentary Geology, 158, 249–270. ↩
-
Wooldridge, C.L., and E.J. Hickin (2005) Architecture and evolution of channel bars in wandering gravel-bed rivers: Fraser and Squamish rivers, British Columbia, Canada, Journal of Sedimentary Research, 75, 844 – 860. ↩ ↩2
-
Kostic, B. and Aigner, T. (2007) Sedimentary architecture and 3D ground-penetrating radar analysis of gravelly meandering river deposits (Neckar Valley, SW Germany). Sedimentology, 54, 789-808. ↩
-
Rice, S.P., Church, M., Wooldridge, C.L., Hickin, E.J. (2009) Morphology and evolution of bars in a wandering gravel-bed river; lower Fraser River, British Columbia, Canada. Sedimentology, 56(3), 709-736. ↩
-
Vandenberghe J. & Van Overmeeren, R.A. (1999) Ground penetrating radar images of selected fluvial deposits in the Netherlands. Sedimentary Geology, 128, 245–270. ↩
-
Mumpy, A.J.Jol, H.M. Kean, W.F. and Isbell, J.L. (2007) Architecture and sedimentology of an active braid bar in the Wisconsin River based on 3-D ground penetrating radar. In Baker, G.S and Jol, H.M (eds) Stratigraphic Analyses using GPR, Geological Society of America, Special paper, 432. Geological Society of America, Colorado. pp. 111-132. ↩