Scientific Report 1099
This report is also available as a PDF document .
Abstract
In this study, Ground Penetrating Radar (GPR) was used to investigate subsurface structures within a valley fill complex in the Huab River, Namibia. This aims to aid the interpretation of the palaeoenvironmental archive of past fluvial activity. GPR transects were conducted at six locations, covering a total distance of 350m. By using a higher frequency and higher antenna than in existing literature, we increased the resolution of the data obtained. This study has provided data to suggest that the valley fill is at least 7m deep, and that the depth of sedimentary boundaries varies across space. Using this data, it can be suggested that by drilling deeper, it would be possible to produce a longer record of palaeoenvironmental change from this system, and that because preservation of depositional units likely varies over space, samples need to be collected from multiple sites across the fill.
Background
Significant hydrological change occurred over southern Africa during the late Quaternary, with drier, western areas impacted by the interplay of temperate and tropical rainfall sources. Modelling and projections of future climate here depend on an understanding of how these precipitation systems shifted, including both the northward penetration of winter rainfall (Shi et al., 20011 ; Stengel and Leser, 20042; Chase et al., 20153; Lim et al., 20164) and southerly extent of tropical rainfall (Singarayer and Burrough, 20155; Scott et al., 20046; Chase, et al., 20097).
Sediment deposition in dryland river systems during the late Quaternary presents a potentially important palaeoenvironmental archive. Often located in regions of limited existence of depocentres and organics, these landscapes provide a window into past hydrological activity. Whilst there exists a longstanding body of research in fluvial systems, variable palaeohydrological interpretations and ambiguous climatic interpretation of fluvial silts has limited the use of such archives as palaeoclimatic indicators. For these archives to make a substantial contribution to palaeoenvironmental and palaeoclimatic literature, it is important to critically assess what information can be obtained from them and whether it is possible to produce better records using more robust methods.
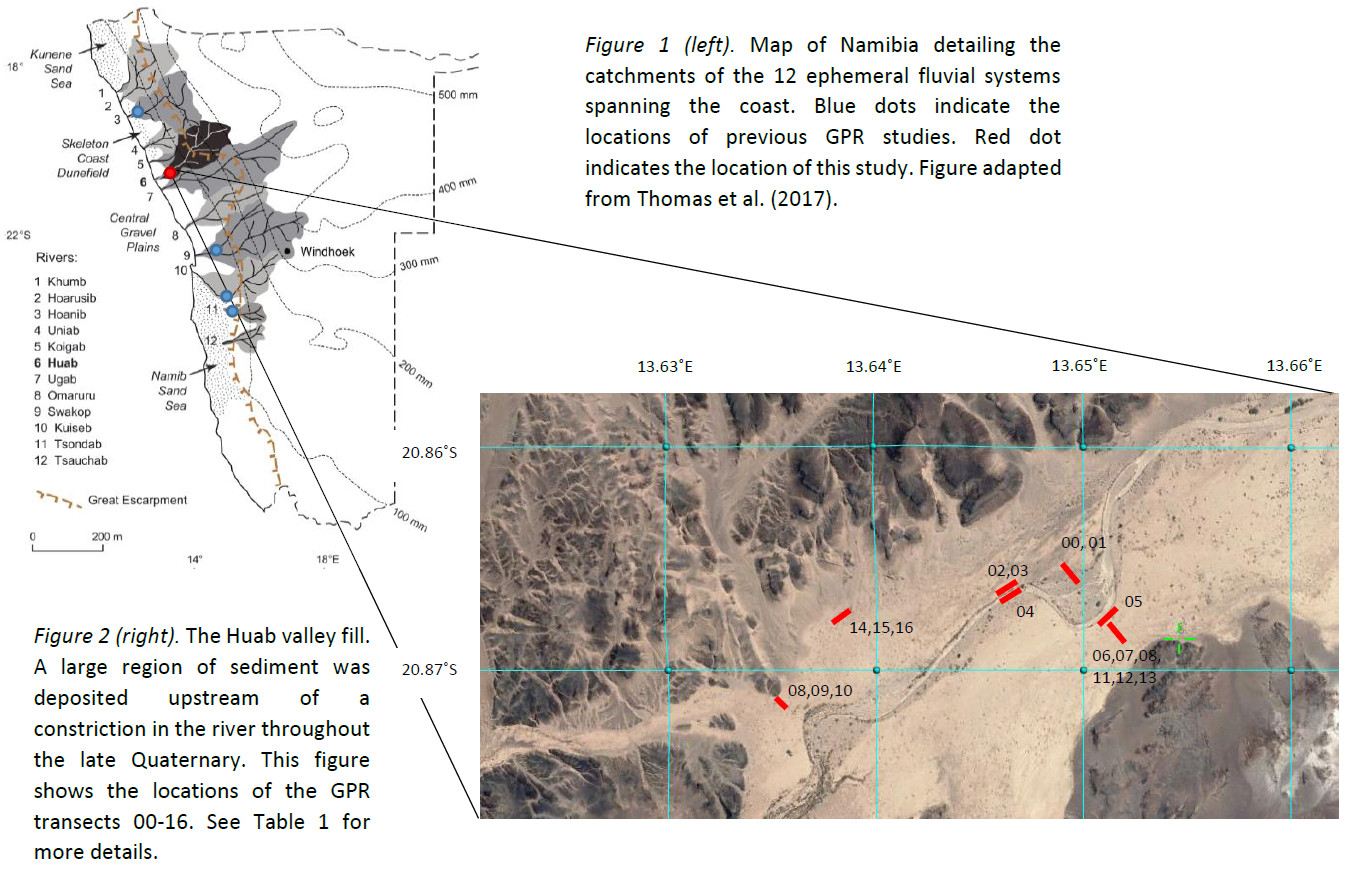
Spanning the North-South coast of Namibia, twelve ephemeral fluvial systems flow towards the coast. Aggradation of sediment in these fills has been used in a number of studies to elucidate the timing of past fluvial activity spanning the last 130ka (Srivastava, et al., 20048; Stone, et al., 20109; Eitel, et al., 200610; Grodek, et al., 201311; Greenbaum, et al., 201412). To date, these studies have focused on natural exposures formed by incision of the modern ephemeral channel into the sedimentary fill, and little is known about how the nature and depth of silt-sand complexes vary throughout the fill. GPR has been used extensively in dryland contexts, predominantly in dune systems (Bristow et al., 200713), but has been limited in a dryland fluvial context. Leopold et al. (2006)14 demonstrated the ability of GPR to image the complexity of depositional structures in the Hoanib, Swakop, Kuiseb and Tsauchab river valleys, Namibia (Figure 1). Focusing on the Huab River valley, which exhibits an extensive and relatively un-studied valley fill complex, this study aimed to use GPR to understand how deposition varied across a sedimentary fill, and provide a context for how ages of deposition should be interpreted.
Research objectives
This study fits within a wider research project that aims to reconstruct late Quaternary fluvial dynamics of the Huab River valley, Namibia. This GPR study aimed to achieve the following objectives:
- Evaluate the depth of penetration of the GPR signal in fluvial deposits;
- Test for the most appropriate antenna frequency;
- Test for the most appropriate stacking for signal preservation;
- Map lateral variability in depositional boundaries within the Huab river valley fill region.
Field survey site
The Huab valley was selected for analysis based on a previous scoping palaeoenvironmental study in the system (Thomas et al., 2017)15 and the identification of potential fluvial archives. From the Great Escarpment, the Huab flows west, terminating at the Skeleton Coast at 20.910°S, 13.452°E (Figure 1). In designing the GPR strategy, particular focus was placed on understanding the variability in depth of depositional structures in an extensive valley fill in the lower middle Huab valley at 20.868°S, 13.650°E.
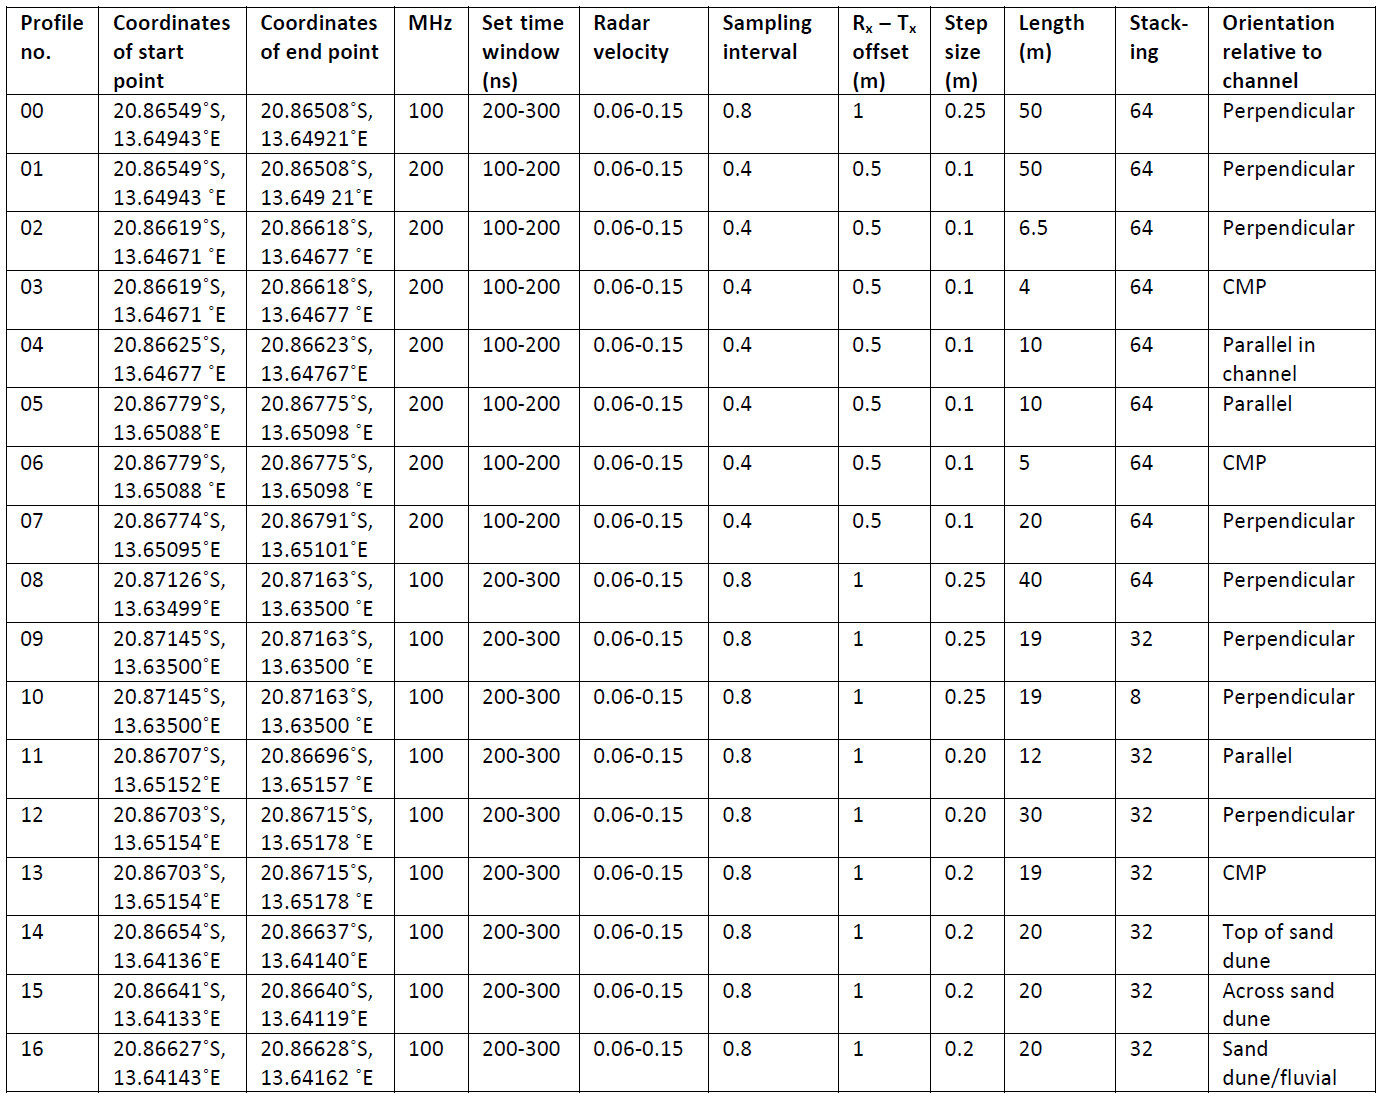
A total of 17 GPR transects were conducted across 6 sites, including 3 CMP analyses (Figure 2, Table 1)
Survey procedure and instrument deployment details
17 GPR transects were acquired using either the 100MHz and 200MHz antenna on the Sensors and Software PulseEKKO PRO system (see Figure 2 for locations, and Table 1 for further details). These sites span multiple aspects of the valley fill system: the surface of the valley fill, the base of the modern ephemeral channel, the edge of the fill with influences of slope inputs, and a location with interaction between aeolian dunes and fluvial sediments. GPR data for central mid-point (CMP) analysis was collected at 3 of the sites. Survey parameters were altered according to the frequency of the antenna being used. Other survey parameters such as stacking and sampling interval were altered for specific lines. Topographic correction was applied where needed, but most transects were collected from flat surfaces with very little or no inclination.
When forming this survey strategy, the literature was consulted. Dune systems in Namibia have been studied using a 100MHz antenna with 32 stacking (Bristow et al., 2007)13 and fluvial sediments studied using a 100MHz antenna with 8 stacking (Leopold et al., 2006)14. Here, we aimed to test for the optimal antenna frequency and stacking values for imaging structures in the Huab. For this reason, these conditions were varied between transects.

Data quality
Throughout this study, data quality was variable. Systematic tests of system parameters were employed to improve the quality of data collected. Data quality was improved by increasing the antenna frequency from 100MHz to 200MHz, and increasing stacking to 64. These findings are discussed in more detail below.
Ringing can be seen in the data presented here. Ringing is a form of noise that appears as horizontal lines across radargrams, often masking the structures in the data (Kim et al., 2007)16. This could be the result of reverberation of currents within antenna (Rashed, 2015)17, between antenna and ground surface (Daniels et al., 2008)18, or the result of amplification of signal through the data processing steps employed. Here, we tested processing steps such as background removal, subtracting a running average, and f-k filtering to remove this ringing. F-k filtering was found to improve the data quality substantially for most radargrams.
Processing and modelling
Data processing was undertaken in two stages. Initial data processing was performed in the field to review the outputs of transects and to guide further data collection. Detailed data processing after fieldwork was then undertaken to obtain the most representative image from the signal. Data processing steps were applied using the ReflexW software. These steps included application of the dewow filter, correction of the start time to time zero, application of a gain function, and f-k filtering to remove ringing. The time cut function was used to produce comparable transects. The processing steps are detailed in Figure 4 using an example transect.

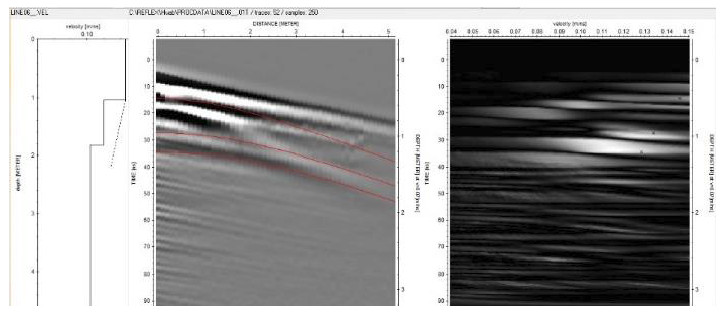
For time-depth conversion, the result of common-midpoint (CMP) analysis was used. CMPs were conducted at three of the seven sites to gain a representative estimation of the velocity profile in this sedimentary fill. The data was processed using the filters described above, and then read into the CMP velocity analysis dimension of ReflexW. Semblance analysis was performed with parameters: min velocity 0.04, max velocity 0.1, velocity interval 0.001. The velocity profile was defined by selecting the semblance analysis plot. A 2D model was created of this profile, which could then be incorporated into GPR lines using the time depth conversion tool. The velocity values in this model range from 0.15 - 0.10m/ns which is in the correct range for dry sand to silt.
Interpretation and preliminary findings
Testing the depth of penetration of GPR signal
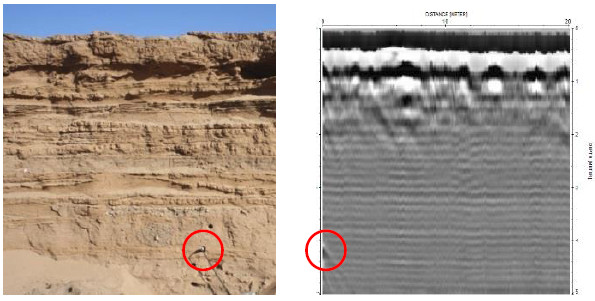
Meandering across the Huab valley fill, the modern ephemeral channel has incised deep into the valley fill sediments (as seen in Figure 3). This exposure provides a unique setting in which the stratigraphy of the fill is visible to around 4m depth. This gave an opportunity to conduct a controlled test of the depth of GPR signal penetration. An object was inserted into the sediment at a known depth, and the penetration of GPR signal was calibrated through identification of a reflection in the radargram at this depth. Figure 6 details the results of a GPR line compared to an image of the exposure face. A clear reflection is seen at 4m (mapping to the depth that the object was inserted) and the GPR signal appears to penetrate to at least 5m depth. At this depth however, ringing is significant (even after f-k filtering or background removal) and meaningful reflections of structures within the fill are limited to the top 2m of the fill.
Testing the influence of antenna frequency on data quality
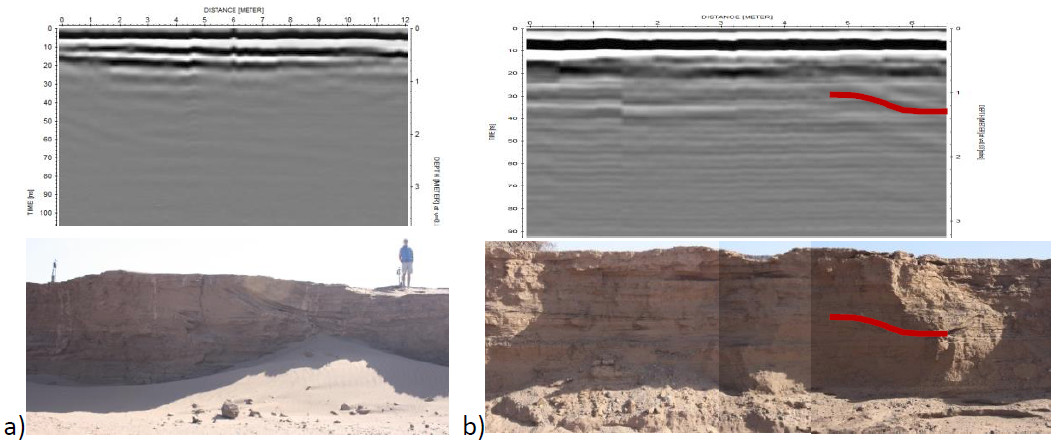
Given that the depth of penetration of GPR signal to provide information on sedimentary structures was limited to around 2m depth using a 100MHz antenna, a test was then performed to see whether a higher frequency antenna, with lower depth penetration (but still encompassing the top 2m), would provide better data quality. This was tested through two routes: 1) by producing a transect along an exposure face and comparing stratigraphy with reflections, and 2) by repeating a transect using different antenna frequencies. Here, we found that the 200MHz antenna outperformed the 100MHz antenna, despite the 100MHz antenna being the most commonly used frequency in this field15. Figure 7a shows that the 100MHz antenna was not able to pick up the sedimentary boundaries that we see in the exposure face, suggesting that the resolution of this antenna was too low for this application. Figure 7b on the other hand details how the 200MHz antenna was able to pick up a significant boundary.
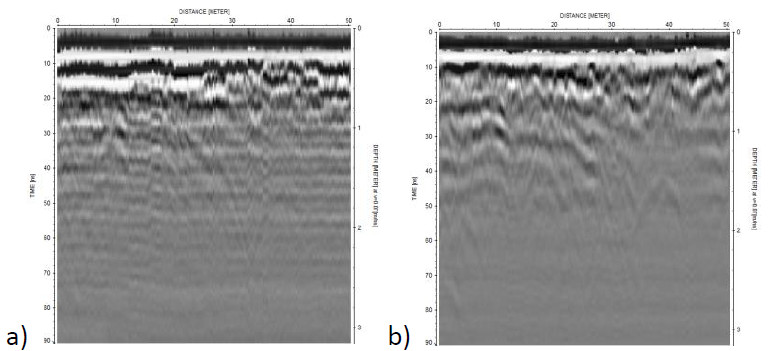
A second test was performed by repeating a transect line across a section of fill using both the 100MHz and 200MHz antennae. Here, limited reflections are seen in the 100MHz antenna radargram (Figure 8a), and a much higher resolution of reflections is provided by the 200MHz antenna (Figure 8b). These findings confirm those seen above, that the 200MHz antenna is optimal for this study. This antenna provides the correct balance between resolution of the signal and depth of penetration.
Testing the influence of stacking on data quality
Stacking values used in the literature vary. Bristow et al. (2007)13 used a stacking of 32 in dune systems, yet Leopold et al. (2006)14 only used a stacking of 8 in their study of Namibian fluvial systems. Stacking is a process of producing additional GPR traces at each point and averaging to reduce noise and improve the signal. Figure 9 shows there is a slight improvement in imaging resolution of subsurface structures obtained by increasing stacking from 8 to 64.

Using GPR to map lateral variability in depositional boundaries
Following tests to optimise the antenna frequency and number of stacks, we then investigated how sedimentary boundaries vary laterally across the fill beyond what is visible at the exposure face. Here, we made two findings: 1) that the valley fill sediments are at least 7m deep, and 2) that the depth of reflections in the radargram vary spatially within the valley.
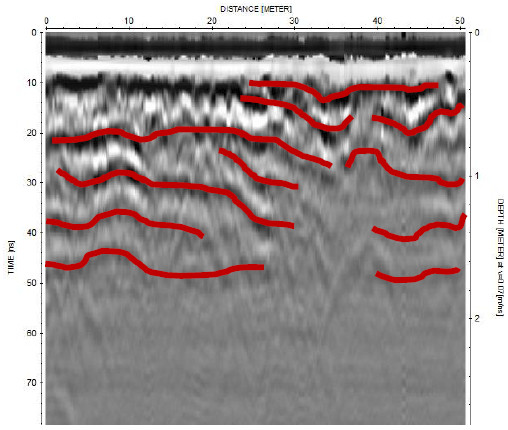
Figure 10 details a GPR transect performed in the base of the dry river channel. The modern ephemeral channel has incised into the valley fill deposits to a depth of around 4m (see Figures 6 and 7 for examples). This radargram shows reflections of sedimentary boundaries for at least a further 3m of fill depth, with no indication of a significant boundary that could reflect the bedrock of the system. Previous work on this system has studied the top 3.5m of the fill, providing a chronology of deposition within the last 10,000 years (Thomas et al., 2017)15. Here, we suggest that there is much greater depth of sediment to be studied, and that by coring deeper, it would be possible to produce a longer record of palaeoenvironmental change in this system.
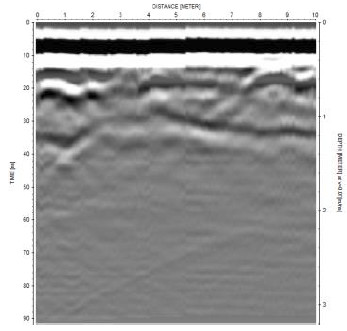
Figure 11 show reflections at a range of depths across transects perpendicular to the modern ephemeral channel exposure. This transect was conducted at the inner section of a meander on the northern side of the fill (line 01 in Figure 2). The image resolves evidence of stratigraphy within the top 2m, but along the transect, these lines are not horizontally consistent. This suggests that this valley fill has experienced significant reworking as the meander has migrated across the fill over time. GPR traces here show similar patterns to those in Sowik (2011)19, in which GPR images illustrated the spatial extent of migration phases of a lowland river in Poland. As preservation of depositional units likely varies over space, a study aiming to understand the depositional history of this fill would therefore require analysis on samples collected from multiple sites across the fill to gain a representative record of sedimentation in the system.
Conclusions and recommendations
This study aimed to use GPR to provide insights into the depositional processes of valley fill complexes in Namibia. To do this, we hoped to determine the most appropriate strategy for GPR data collection, to investigate potential depth of penetration of the GPR signal into the valley fill sediments, and to use these methodological considerations to collect data that helps understand the variability of the depositional boundaries in the fill.
This study found that the best results were obtained using a 200MHz antenna with stacking of 64. Using this methodology, we were able to image the structures of the sediment to a depth of 2m. This differs from the strategy used by Leopold et al (2006)14 in other Namibian fluvial units, but as this is the only existing paper published using this method in this context, the protocol is not well established. Here, we argue that by increasing the stacking and antenna frequency, we were able to achieve a higher resolution image, where data quality was improved, and sedimentary boundaries could be better identified.
Focusing on the findings from lines 01, 04, and 07 (Figure 2, Table 1), this study has provided insights into the depositional processes of valley fill formation along the Huab valley. Along the modern ephemeral channel, we see distinct sedimentary boundaries in the exposure, suggesting that there has been periodic sediment deposition, with episodes of rapid deposition and others of deflation and hardening of the surface, throughout the late Quaternary. Data from GPR transects collected perpendicular to the modern ephemeral channel indicate that these boundaries vary in depth laterally across the fill. This variation suggests that this is a complicated system of cut and fill, with a meandering channel, and regions of deposition and removal vary across space. From this, we argue that if one wants to understand the depositional history of this fill, it is critical that samples are collected from sites across a lateral transect spanning the fill. Study of a single exposure site would likely not be representative of the fill as a whole. From this, further study has been undertaken on a number of sites across the fill, aiming to target locations along the river and across the fill. By systematically sampling at a number of depths and a number of profiles, luminescence dating of these samples aims to produce at representative record of the timing of sediment deposition over the last 20ka.
This study also provided indications of the depth of the fill sediment. A GPR transect collected along the channel floor suggests that the fill is at least 3m deeper than the 4m deep channel. This suggests that the fill has a minimum depth of 7m. Beyond this study, it would be interesting to investigate the potential of using other methods to map the bedrock in this region.
To conclude, this study has developed a methodology for technical optimisation of data collection using GPR to map internal structures of a dryland fluvial valley fill unit. This method was then used to understand the depositional context of these sediments. We found significant lateral variability in sedimentary boundaries in the Huab valley fill and present a value for a minimum depth of the fill.
Location of archived data
Location of archived data The data has been backed up with copies on multiple disk spaces. Copies of the data can be provided by contacting Ella Walsh, University of Oxford (ella.walsh@ouce.ox.ac.uk)
Publications, including conference presentations
At present, there are no publications from this work. Any publications arising from it in the future will be forwarded.
References
-
Shi, N., et al., 2001. Southeast trade wind variations during the last 135 kyr: Evidence from pollen spectra in eastern South Atlantic sediments. Earth and Planetary Science Letters, 187 (3 4), 311-321. ↩ ↩2
-
Stengel, I., Leser, H. 2004. Late Quaternary Valley-Fill Terraces and Palaeoenvironments of the Huns River, Southern Namibia. Nutzungsbedingungen, 135, 129-149. ↩
-
Chase, B., et al., 2015. Influence of tropical easterlies in southern Africa’s winter rainfall zone during the Holocene. Quaternary Science Reviews, 107, 138-148. ↩
-
Lim, S., et al., 2016. 50,000 years of vegetation and climate change in the southern Namib Desert, Pella, South Africa. Palaeogeography, Palaeoclimatology, Palaeoecology, 451, 197-209. ↩
-
Singarayer, J., and Burrough, S. 2015. Interhemispheric dynamics of the African rainbelt during the late Quaternary. Quaternary Science Reviews, 124, 48-67. ↩ ↩2
-
Scott, L., et al., 2004. Fossil hyrax dung and evidence of Late Pleistocene and Holocene vegetation types in the Namib Desert. Journal of Quaternary Science, 19 (8), 829-832. ↩
-
Chase, B., et al., 2009. A record of rapid Holocene climate change preserved in hyrax middens from southwestern Africa. Geology, 37 (8), 703-706. ↩
-
Srivastava, P., et al., 2004. A record of fluvial aggradation in the northern Namib Desert margin during the Late Pleistocene Holocene. Zeitschrift F r Geomorphologie, Supplementary Issues, 133, 1-18. ↩
-
Stone, A., et al., 2010. Late Quaternary palaeohydrological changes in the northern Namib Sand Sea: New chronologies using OSL dating of interdigitated aeolian and water-lain interdune deposits. Palaeogeography, Palaeoclimatology, Palaeoecology, 288 (1 4), 35-53. ↩
-
Eitel, B., et al., 2006. Environmental changes at the eastern Namib Desert margin before and after the Last Glacial Maximum: New evidence from fluvial deposits in the upper Hoanib River catchment, northwestern Namibia. Palaeogeography, Palaeoclimatology, Palaeoecology, 234 (2), 201-222. ↩
-
Grodek, T., et al., 2013. The last millennium largest floods in the hyperarid Kuiseb River basin, Namib Desert. Journal of Quaternary Science, 28 (3), 258-270. ↩
-
Greenbaum, N., et al., 2014. Paleohydrology of extraordinary floods along the Swakop River at the margin of the Namib Desert and their paleoclimate implications. Quaternary Science Reviews, 103, 153-169. ↩
-
Bristow, C., et al., 2007. Age and dynamics of linear dunes in the Namib Desert. Geology, 35 (6), 555-558. ↩ ↩2 ↩3
-
Leopold, M. et al., 2006. A ground-penetrating radar survey of late Holocene fluvial sediments in NW Namibian river valleys: characterization and comparison. Journal of the Geological Society, 163 (6), 923-936. ↩ ↩2 ↩3 ↩4
-
Thomas, D., et al., 2017. Holocene fluvial valley fill sources of atmospheric mineral dust in the Skeleton Coast, Namibia. Earth Surface Processes and Landforms, 42 (12), 1884-1894. ↩ ↩2
-
Kim, J., Cho, S-J., Yi, M-J., 2007. Removal of ringing noise in GPR data by signal processing. Geosciences Journal, 11 (1), 75-81. ↩
-
Rashed, E. 2015. GPR background removal using a directional total variation minimisation approach. Journal of Geophysics and Engineering, 12 (6), 897-908. ↩
-
Daniels, J., Ehsani, M., Allred, B., 2008. Ground penetrating radar methods. Handbook of Agricultural Geophysics, 129-145. ↩
-
Sowik, M. 2011. Reconstructing migration phases of meandering channels by means of groundpenetrating radar (GPR): the case of the Obra River, Poland. Journal of Soils and Sediments, 11 (7), 1262-1278. ↩
