Scientific Report 1072
This report is also available as a PDF document .
Abstract
Loan 1072 was used to initiate a 2-year measurement campaign on Campfield Marsh, Cumbria. The campaign ran from Spring 2017 until Spring 2019, with the objective of gathering very high resolution topographic data from 4 sites on Campfield Marsh. Loan 1072 allowed the deployment of of a terrestrial laser scanner (TLS) and relative carrier phase GNSS (RCP-GNSS) in March, June and October 2017. Further data were collected under Loan 1091. Due to bad weather conditions, no data was collected in March 2017. Here, we present the measurements taken in June 2017. These data constitute the baseline for our topographic analysis of marsh evolution, which will be presented in the scientific report for Loan 1091. Our preliminary findings show that specific features need to be monitored to understand the evolution of marsh margins. Specifically, the diameter and shape of vegetation patches as well as the scarps and their fronting pool systems will be the focus of the following loan (Loan 1091).
Background
The increasing availability of high resolution topographic data represents a significant step in our understanding of coastal landscapes. Airborne LiDAR point clouds at a density of around 6 pts m2, made available by the Department for Environment, Food and Rural Affairs (DEFRA), cover the whole of England’s coastline. We have used this dataset in previous work 1. While it has been argued that spatial resolution under 1 m is not necessary for geomorphic analysis of mountainous landscapes 2, the scale of geomorphically important features on salt marshes is far inferior to 1 m. Furthermore, the most active features of a salt marsh cannot be adequately tracked with mid-altitude airborne sensors: indeed, monitoring the 3-dimensional structure of eroding marsh scarps requires multiple scan origins to be level with the scarp, and the small-scale changes under the vegetation canopy cannot be observed unless point density exceeds the spacing of vegetation stems.
In order to capture significant features of marsh erosion and progradation, we elected to use terrestrial laser scanners to collect 3-dimensional point clouds of active marsh platforms and margins. Due to its high tidal amplitudes, Campfield Marsh in the Western Solway Firth (England) presents very active margins on each side of the ruined railway bridge that formerly linked Bowness-on-Solway to Annan. Multiple modern 1 m resolution Digital Elevation Models (DEMs) are also available in this area, allowing for easy validation of our data.
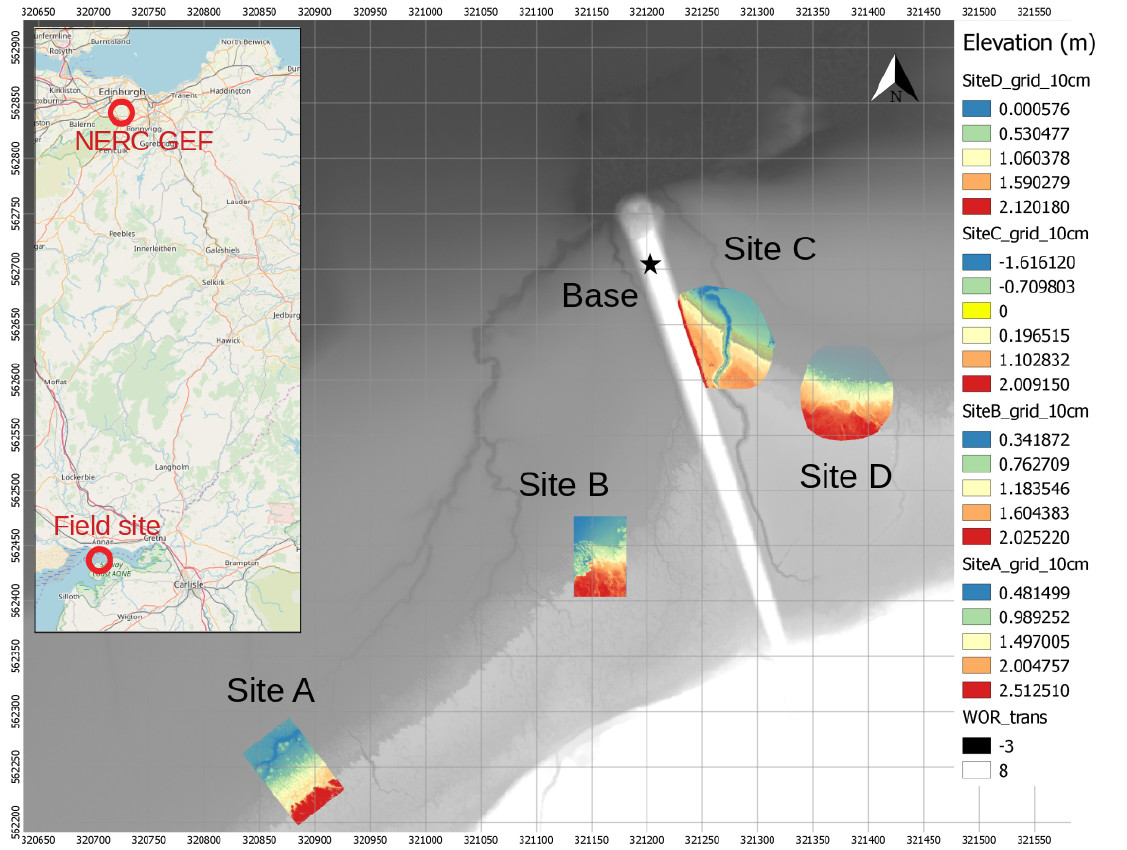
We selected 4 sites (A-D) within Campfield Marsh to capture representative behaviours of macro-tidal marsh margins without scanning 3.7 km of coastline (Figure 1). Two visits to the site were realised in 2017 for Loan 1072, one in early summer (after winter storms and before vegetation development), one in early autumn (before winter storms and after vegetation development). Upon each visit, the following equipment was deployed: 1 Leica GS10 receiver (base); 1 Leica GS10 receiver (rover); 1 Leica HD6100 terrestrial laser scanner (June); 1 Leica P40 terrestrial laser scanner (October).

Survey procedure
We realised topographic surveys of Campfield Marsh in June and October 2017 during neap low tides to maximise the exposure surface and time of the tidal flat, thus minimising the portion of wet surfaces. A survey was programmed in March 2017, but upon arrival at Campfield Marsh the inclement weather prevented the use of the TLS. Instead, 10 sediment traps were installed on each site. The traps installed were 20x20 cm rubber paving tiles, dug into the soil so that their surface was flush with ground level, and anchored with steel U-pins.
Each day began with the deployment of the Leica GS10 base receiver at the further extremity of the railway bridge. A physical marker (metal nail inserted in the bridge structure) was used as a reference point to position the GS10 base receiver. This base station was then left to record data at a frequency of 1 Hz for the entire day (6 - 7 hrs), assisted by an external battery.
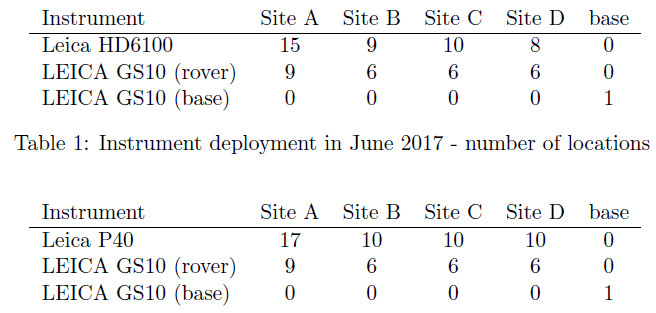
Then, for each site, we installed 9 (site A) or 6 (other sites) threaded metallic rods, 90 cm in length, to serve as stands for both the scanner targets and GS10 rover receivers. Site A required more stands due to its larger seaward extent. Targets were placed on the threaded rods in such a way that from each scanning position, 6 targets would be visible and within 25 m of the laser scanner. Multiple scans were taken for each site (see Tables 1 and 2), in such a way that no shadows remained within the desired study area. The location and elevation of each rod was determined using the GS10 rover receivers, recording at 0.2 Hz for 5 min at each rod.
Data Processing
RCP-GNSS data were processed in Leica GeoOffice (LGO) and TLS data were processed using Leica Cyclone, both at the NERC GEF facility in Edinburgh. For each site, GS10 base receiver data was loaded into LGO and tied to the local Ordnance Survey (OS) reference station of Carlisle. Rover receiver data were then tied to the base station location: the differential GPS allows better accuracy and is designed to reduce the error upon registration of the point clouds. TLS data, irrespective of the deployed model, were processed in Cyclone to produce a composite image of the multiple scans. Each scan was tied to 4-6 out of the 6 targets placed on the field. Once targets were identified in each of the individual scans, registration was performed, first between the scans, then between the grouped scans and the coordinates of the targets (measured with the GS10 rover receiver). The resulting composite and registered point cloud is then exported in the .pts format and compressed to .laz format for analysis in CloudCompare.
Data Quality
The GS10 rover data for site B targets in the Autumn campaign were acquired after shutdown of the GS10 base, and are therefore unusable. For other sites, the maximum (x,y,z) error on target registration was 0.02 m. In Section 6, we discuss the possibilities for building 3-D models of difference, made possible by such small errors.
Data Archive
All the TLS and RCP-GNSS raw data are stored in the NERC GEF facility hard drives. In addition, geo-referenced and registered TLS data in the .pts format are stored on the Land Surface Dynamics group Datastore, which is located on the University of Edinburgh servers and automatically backed-up. Due to the high volume of .pts files (on average 25 GB per site), we are currently examining the loss of data caused by conversion to .las and compression to .laz format (under 10 GB per site). D-GNSS data are stored as .txt files. Long-term storage of data will take place at the NERC CEH data repository.
Preliminary results and interpretation
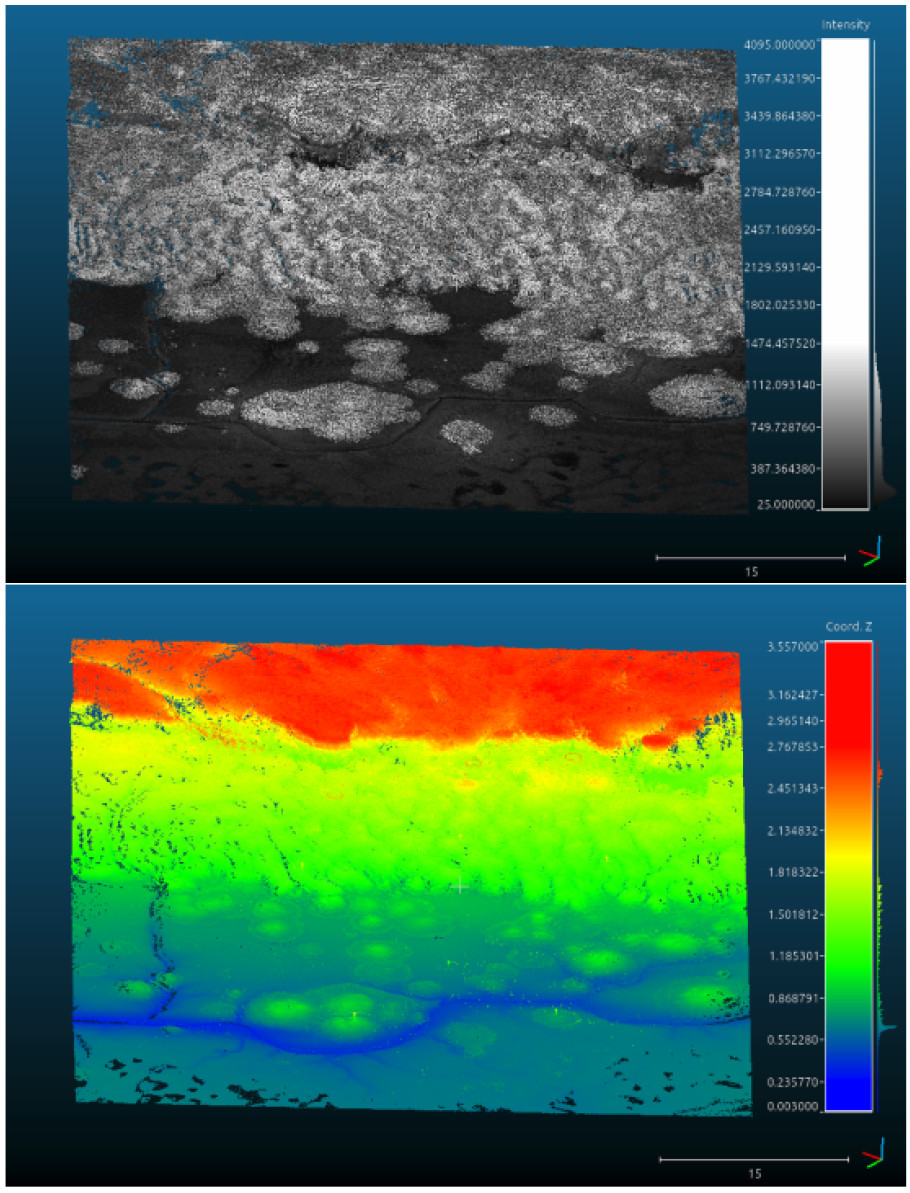
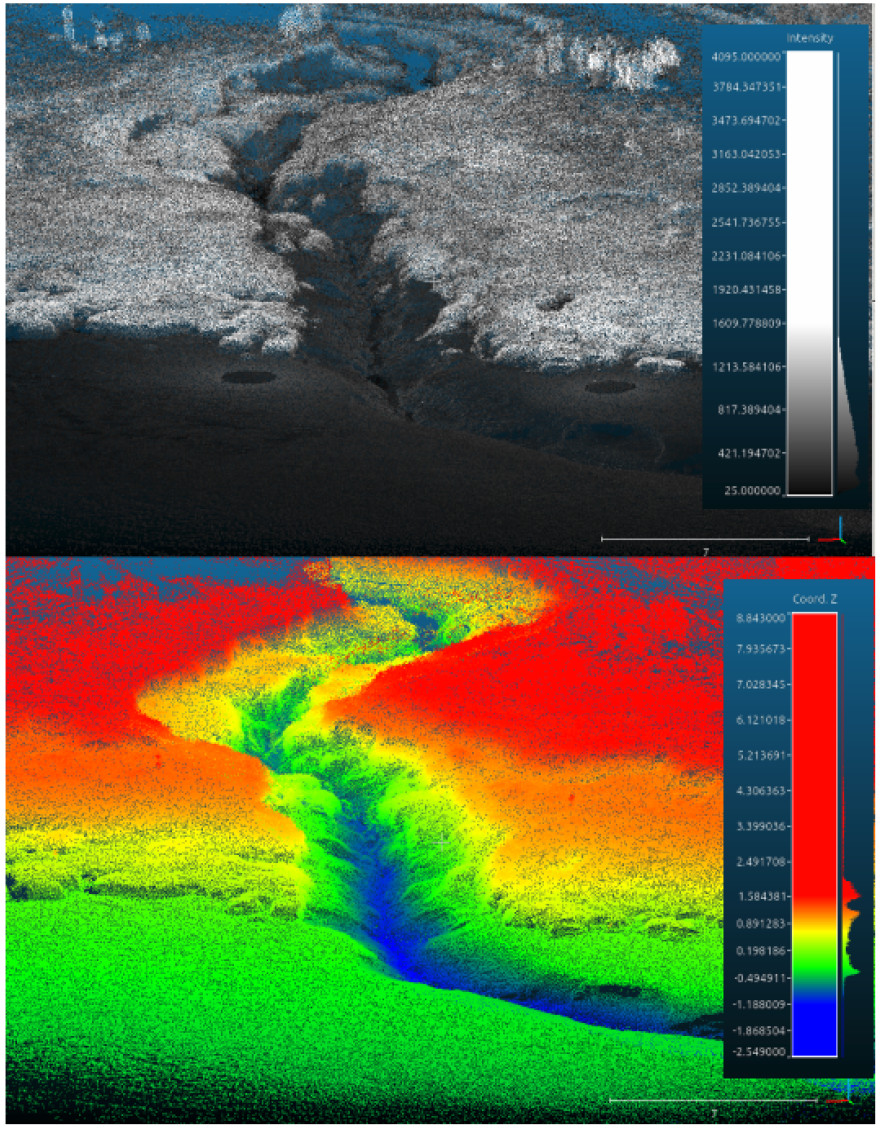
Site scouting in October 2016 had revealed sites located downstream of the railway bridge (A and B) to have extensive pioneer zones merging with the low marsh, a tell-tale sign of a prograding margin. Conversely, upstream sites (C and D) displayed more relief between the lowest platform and the tidal flat, and did not show the patches Spartina anglica typical to progradation, indicating a receding marsh limit. The goal of the 2-year campaign is to link eco-morphological patterns to types and rates of topographic evolution, and in this preliminary report we identify the key features to monitor. In Figures 2 and 3, we show subsampled clouds at a resolution of 1 pt/5cm3 for sites A and C respectively. The lowest point in the bounding box is selected to approach ground elevation. Intensity returns are used to mark the presence of vegetation and are compared to topography.
Progradation through vegetation and topographic nuclei: In site A, intensity returns show clearly delimited patches of vegetation in the pioneer zone (Figure 2, top), merging with the continuous low marsh. The central part of most patches is matched by a topographic dome (Figure 2, bottom). These domes rise almost to the elevation of the continuous low marsh and were populated, as was ascertained on the field, by an association of Puccinellia maritima and Armeria maritima, while the lower external parts of the patches hosted Spartina anglica. While high intensity patches of Spartina may be interpreted as the nucleating points of the pioneer marsh, the central domes present both topographic and ecological features of the low marsh (green to yellow shades in Figure 2, bottom), and may be seen as the initiating points of salt marsh growth in the geomorphic sense. Further surveys (including Loan 1091) will reveal whether the observed pioneer zone is consistently expanding and/or transitioning into low marsh.
Transition zones between pioneer and low marsh: Connectivity between Spartina patches increases landward in site A, as does the connectivity between low marsh domes (Figure 2). However, the limit between the continuous low marsh and the dense patches is still clearly visible. Comparison with the limit between the low marsh and the tidal flat in site C (Figure 3) may explain this feature. Indeed, the lowest part of the low marsh (yellow shades in Figure 3, bottom) sits much higher than the adjacent tidal flat (up to 50 cm), in comparison to site A (around 15 cm). We also note that site C does not exhibit pioneer Spartina patches. This could be explained by a lower or more frequently disturbed tidal flat, which prevents the establishment of seedlings. Further surveys (including Loan 1091) will reveal whether the tidal flat is consistently lowering at this site, and whether the low marsh is consequently receding at this site.
Terrace heights and staged marsh evolution: By comparing Figures 2 and 3, we observe that while site A has 2 distinctive sub-horizontal terraces (the high marsh and the low marsh), site C echibits an additional terrace, sloping down from the high marsh and onto a gently sloping low marsh. Such a structure points to different historical developments of the marsh platforms, likely due to the presence of the railway bridge. While this is not the focus of our study, it indicates different patterns of sediment delivery to the marsh platform. Furthermore, we note that eroding scarps are fronted by pools in site A, but not in site C. The height of the scarp may play a role in the development of pool systems, and linking various sites may present the key to understanding their formation and their role in scarp erosion. Further surveys (including Loan 1091) will reveal the rates of deposition on the different marsh terraces, as well as scarp retreat. We note that for this measurement to be successful, accretion rates must be superior to the error in measurement, or require ground-truthing.


Future work
Our preliminary results reveal a number of topographic features that are critical to our undertanding of salt marsh margin evolution. By monitoring topographic change end vegetation encroachment on these specific features, we aim to determine the changes in morphology that occur during progradation and recession of marsh margins. Througout the subsequent field campaigns, we will continue measurements and data processing in an identical manner to that descrubed in Section 2. When 3-D models in .laz format are generated for each successful campaign, we will generate cloud-to-cloud distance data (also in .laz format), first by using an (x,y,z) decomposition of coordinate change, and then by using the M3C2 module on CloudCompare. The resulting point clouds of change will contain data on accretion rates at each point.
In prograding platforms such as site A and B, we will specifically monitor: 1/ the diameter of each vegetation patch and their density, based on intensity measurements; 2/ the topography of each dome and their diameter relative to vegetation patches; 3/ the topographic evolution of unvegetated areas between patches to predict potential patch development. In receding platforms, we will specifically monitor: 1/ the retreat rates of scarps as a function of their height and the fronting pool system; 2/ The evolution of the tidal flat elevation relative to the scarp.
In all low marsh platforms, we will monitor the ground surface elevation change as a function of altitude. These measurements will be complemented by the analysis of height and grain size distribution of the sediment deposited on the sediment traps.
Planned publications
The preliminary results reported above have potential to be converted into 2 publications. 1/ previous work on single-species vegetation patches 3 has set the grounwork for a detailed analysis of the formation of patches and their transition into a low-marsh ecotone. 2/ The accretion rates of marsh platforms has been the recent focus of our research, leading to an accepted article in Frontiers (“High platform elevations highlight the role of storms and spring tides in salt marsh evolution”). Our field data will provide the basis for the improvement of the model defined in the article.

References
-
Guillaume C.H. Goodwin, Simon M. Mudd, and Fiona J. Clubb. Unsupervised detection of salt marsh platforms: A topographic method. Earth Surface Dynamics, 6(1):239 255, 2018. ↩
-
Stuart W D Grieve, Simon M Mudd, David T Milodowski, Fiona J Clubb, and David J Furbish. How does grid-resolution modulate the topographic expression of geomorphic processes ? Earth Surface Dynamics, 4:627 653, 2016. ↩
-
Thorsten Balke, Paul C. Klaassen, Angus Garbutt, Daphne Van der Wal, Peter M J Herman, and Tjeerd J. Bouma. Conditional outcome of ecosystem engineering: A case study on tussocks of the salt marsh pioneer Spartina anglica. Geomorphology, 153-154:232 238, 2012. ↩
