Scientific Report 1066
This is a Reduced Scientific Report resulting from our minor loan scheme.
Summary
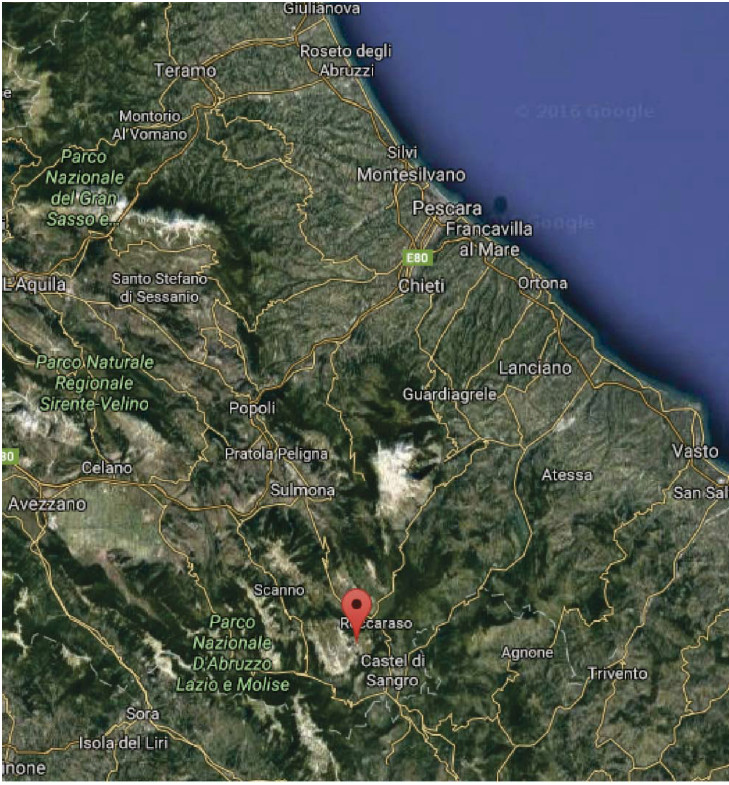
In order to understand the seismic hazard posed by an active faults it is necessary to know (i) the long-term rate of movement of the fault; (ii) the geometry of the fault; and (iii) the time that has elapsed since the last earthquake occurred on the fault. This study aimed to improve the information known about the Aremogna-Cinque Miglia Fault in the central Apennines, Italy (Figure 1). We collected a real-time kinematic GPS survey of the southeastern tip of the Aremogna segment of the Fault to map the surface trace of the fault, and map the offset of the fault. This was combined with a magnetic surveys and gravity surveys. We pursued field campaigns in 2014 (reported in GEF Minor Loan Scientific Report 1034) and in 2015 (reported in GEF Minor Loan Scientific Report 1051). This report covers our third field campaign in 2016.
Research facilitated by this loan
The aim of this project was to map the faults of the Aremogna Plain using a RTK GPS survey, and measure the slip-rate. In conjunction with the GPS survey, we carried out a magnetic survey using equipment from the UCL geophysical equipment pool: Caesium vapour magnetometer. Mapping fault slip-rates and fault geometries can reveal data that can be used in seismic hazard assessments (e.g. Roberts et al, 2004)1. This year we focussed on mapping the extent of the rupture in order to continue to:
1) accurately map the fault geometry, this is important when resolving stresses following Coulomb stress changes; and
2) map along strike changes in the slip rate and kinematics of the Aremogna Fault.
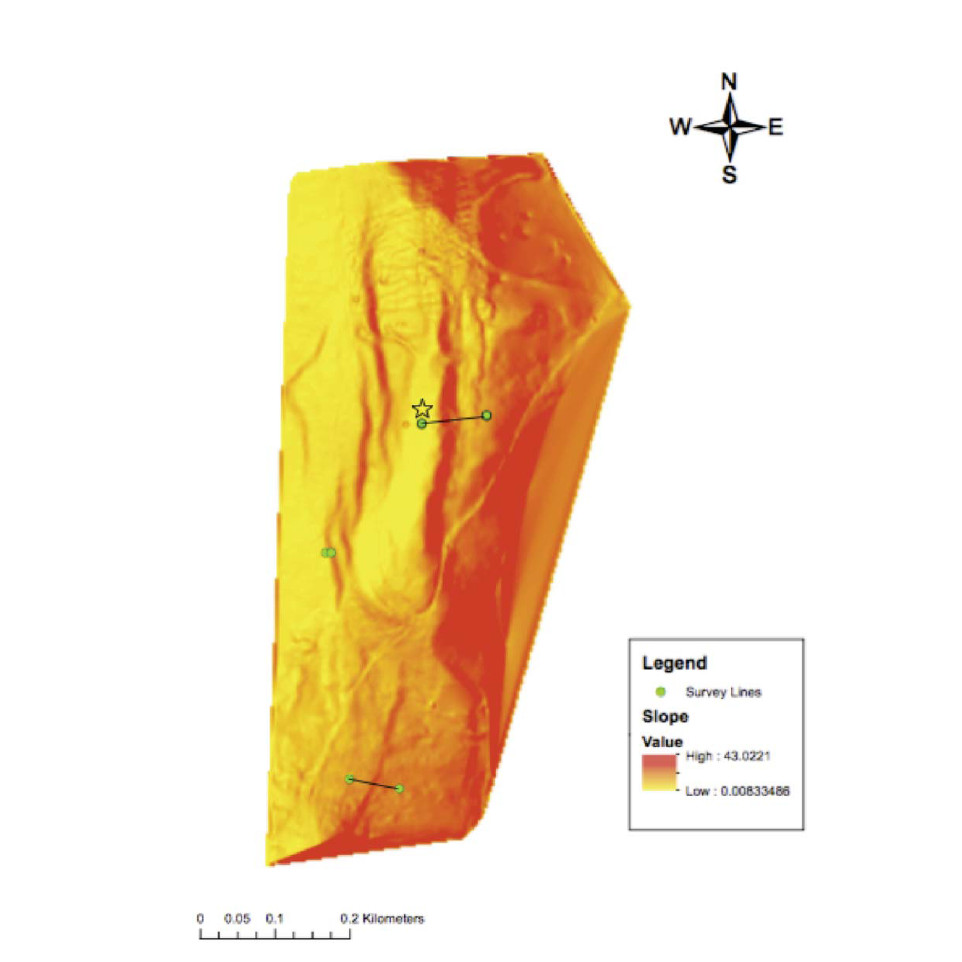
In particular we investigated en echelon faulting on the Aremogna Plain (Figure 2). The GNSS equipment was used in survey mode and data were added to GNSS data collected. We aimed to grid the en echelon faults through the DEM and the magnetic survey.
Survey Methodology and Data Processing
The GNSS equipment was used in survey mode and data was added to GNSS data collected. The Digital Elevation Model (DEM) was produced using Leica Geo Office. We aimed to supplement data collected in 2014 and 2015 and map the extent of the surface ruptures. The data supplemented a digital terrain model of the fault.
Project Outcomes
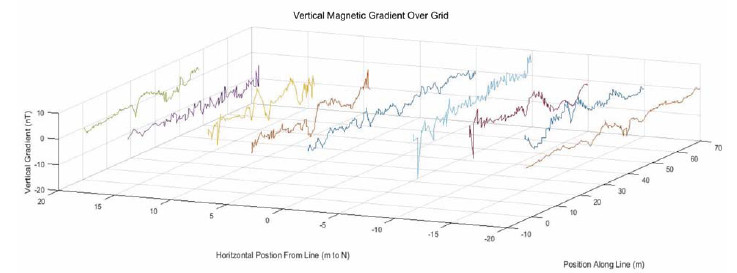
Data were collected with a vertical resolution of 0.25m and a horizontal spacing of 0.5m. In post-processing, the data was interpolated to produce a 2.5m resolution digital elevation model (DEM; Figure 2). The data were then analysed alongside field mapping carried out at the same time as the field survey to identify the faults in the region of study. The GNSS equipment used performed adequately for the task required. Levels of accuracy were sufficient for combing with geomagnetic and gravity data collected during the same field expedition. The level of accuracy was sufficient for this task. Figure 3 shows magnetic anomalies at approximately 15-20m and 85-90m over a grided area, indicating the presence of the en echelon faults.
Outputs
No publications have yet been produced using the data. The data have been used in Luke Wedmore’s PhD thesis which was successfully examined in 2017.
Data Archiving
When data processing has been completed, the data are archived within the UCL data archive. All publications that use this data will be open access.
References
-
Roberts, G.P. Cowie, P. Papanikolaou, I. Michetti, A. 2004. Fault scaling relationships, deformation rates and seismic hazards: an example from the Lazio– Abruzzo Apennines, central Italy, J. Struct. Geol. 26, 377-398. ↩
Figures and tables


