Scientific Report 1062
This report is also available as a PDF document .
Abstract
As per Loan Number 1062, this project set out to generate Digital Elevation Models (DEM) of a landslide-prone slope to calculate volumetric change using the Riegl VZ-1000 long range scanner. The scanner was deployed at Glen Ogle, Stirlingshire on 4 occasions: October 2016, May 2017, September 2017 and April 2018.
The Riegl VZ-1000 scanner was used to provide high-resolution data coverage of topography over a broad (3 km x 1 km) spatial scale. Error surfaces were categorised in the field by noting the ground cover and associating a code within the RtK check points. The capabilities and limitations of long range TLS for long-term monitoring and precise modelling of slope failures were investigated to analyse whether a multi-method approach could be implemented to generate surface models of sufficient consistency to identify the development of slope instability.
A DEM of Difference (DoD) was produced at 0.5 m resolution for the period of October 2016 to April 2018. The DoD was thresholded at 0.02 m with a 95% confidence interval. Most change was observed in the north-east and central sections of the slope. The maximum increase in elevation in this area was 0.05-1 m over 30 months. This change was concentrated to the gullies. The spatial coherence of this topographic change gives confidence that this change is real rather than an artefact of survey noise.
The PhD research project that these data were used for aims to address the gap in knowledge of slope instability by combining field-based data acquisition of geological, geotechnical and terrestrial remote sensing to further improve understanding of slope stability mechanisms and answer the question: is it possible to identify landslide precursors?
Background
Landslides are of significant interest in upland areas of the United Kingdom due to their complex mechanics, potential to channelise into hazardous debris flows and costly potential impacts on infrastructure. Slope failures in the UK are typically triggered by extended periods of intense rainfall and can occur at any time of year, with 34% of the Scottish road network at risk from slope failure. However, accurate prediction of the timing and nature of slope failures is still problematic.
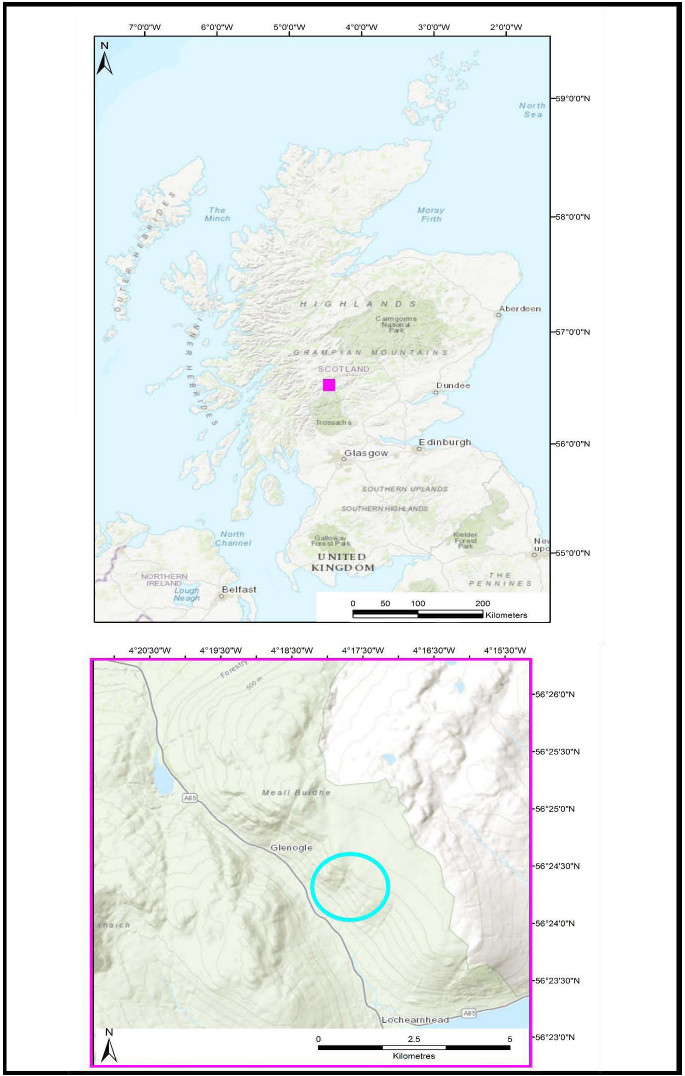
Riegl VZ-1000 long range scanner was the only equipment borrowed under this loan. It was deployed at Glen Ogle, Stirlingshire on 4 occasions: October 2016, May 2017, September 2017 and April 2018 (Figure 1). These times were selected to cover a full hydrological year (October-September) as well as to maximise against peak periods of vegetation growth on the slope, particularly bracken.
Previous Failure Event at Glen Ogle
On Wednesday 18 August 2004, the A85 in Glen Ogle, Stirlingshire, was blocked by debris flow material which originated from two shallow planar failures. There had been 90 mm of rain a week prior with a further 80 mm of rainfall on the day of the event. Fifty-seven people were trapped on the roadway and either left the scene on foot or were rescued by helicopter. The failures that caused the road closure of the A85 originated at the top of two gullies, one leading to a culvert under the road and a second, 435 m further north. It should be noted that 2004 was the second warmest year and third wettest since accurate records began (Met Office). These debris flows were triggered by a high magnitude summer rainstorm. Hourly rainfall data from the Killin and Strathyre tipping bucket rain gauges (located 6 km north and 10 km SSW of Glen Ogle) indicated that the most intense rainfall occurred over a 2 hour period around 1600 GMT with a peak intensity of 20 mm/hr over 1 hour or 15 mm/hr over 2 hours (Milne et al., 2009).
The valley of Glen Ogle has apparently remained stable since 2004 with no new visible scars and those identified by Milne et al., (2010) becoming vegetated. The capabilities and limitations of long range TLS for long-term monitoring and precise modelling of slope failures were investigated to analyse whether a multi-method approach could be implemented to generate surface models of sufficient consistency to identify the development of slope instability. This study also aimed to determine to what extent the infrastructure network would be impacted in the event of a subsequent failure.
Survey procedure
For all field campaigns, the Riegl VZ-1000 was used (Figure 2). At each survey station, an overview scan was conducted to orientate the operator in the scanner’s local co-ordinate system and to find targets. The scan was set at 0.05 m resolution at 950 m (150 kHz) and each scan took approximately ten minutes. Reflectors were identified in the TiePoint List (TPL) and any false reflectors were deleted and renamed with target sizes specified during this TPL cleaning process. Once cleaned, a fine scan of the valley was run before a more detailed scan of the study area took place. The detailed scan duration was approximately one hour and used Panorama-10 with a resolution of 0.2 m at 1400 km distance (70 kHz) producing an average of 2.7 million points in each scan. This process was repeated at all three scan positions along the old railway.
Following inspection in the field of the point cloud from the scan, a smaller section (~50 m2) of the slope focussing on the incipient landslide was scanned at 0.01 m resolution from a range of 1400 m producing an average of 0.2 million points in each scan. These scans took an average of thirty minutes to capture. These scans were added to the survey to allow more detail of a specific area to be imaged and to fill small data gaps in the topographic model that were caused by shadowing and vegetation. All three scans were combined to produce a final point cloud of over 100x106 observations over the survey area of 3 km2.
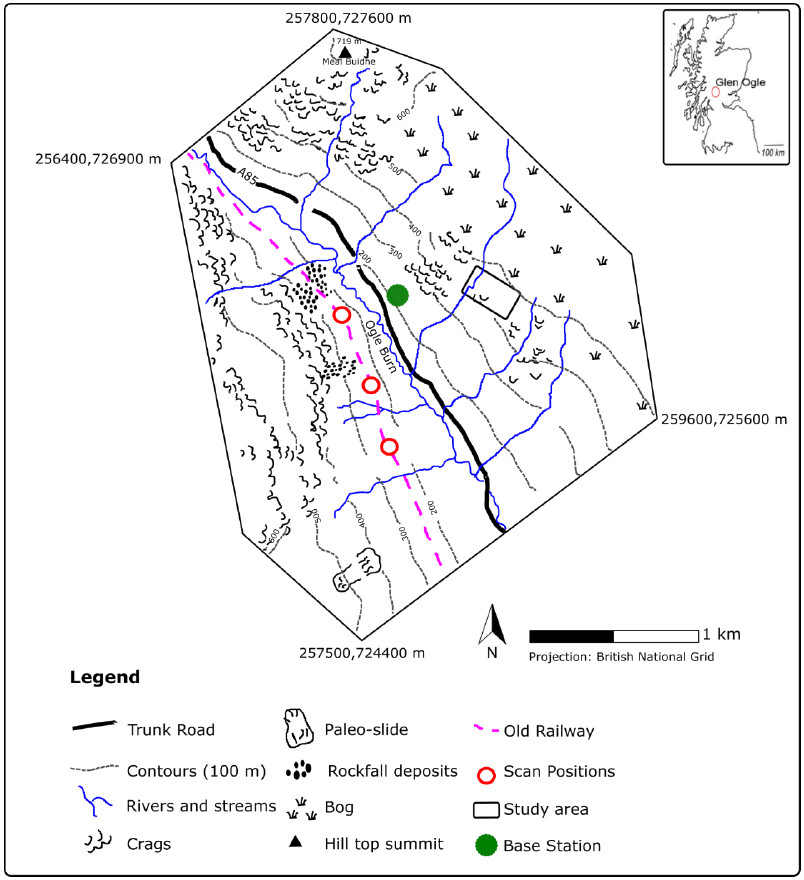
A Leica base station was positioned ~350 m NE on the opposite valley side to constantly georeference via post-processing of eight hours static data per day (Figure 2). It was observed in GNSS static mode for ~ 7 hours with Leica 1200. Post-processing with RINEX data from the nearest Ordnance Survey (OS) Net station was performed to calculate the base station’s coordinates in Ordnance Survey Great Britain (OSGB36(15)). Each target was observed for at least 30 minutes in GNSS-static mode. The geometry of the Glen Ogle site required the maximum range was set to 1400 m which yielded 42,000 measurements per second as the 45° steepness of the slope prevented scanning on the same valley side.
The TLS was located on a stable surface (cycle track) and fixed on a tripod, which raises the scanner up to approximately 1.5 m above the ground surface. To cover the complete study area, three scan stations were established. Six 150 mm targets were precisely located in the field between scan positions to act as tie points. These targets were positioned in a straight formation along the track, within the overlapping area between the scans, to ensure that adequate three-dimensional control was obtained. The targets used for registering the point clouds were calibrated based on their specific reflectance, allowing them to be identified and accurately positioned by the scanner. The capture of target positions by the scanner was semi-automated; areas matching the target reflectance characteristics were validated by a manual operator check before the target was in a high-resolution scan. A minimum of two control points was used to provide enough redundancy to ensure separate scans could be registered and assessed in RiScan.
Processing and modelling
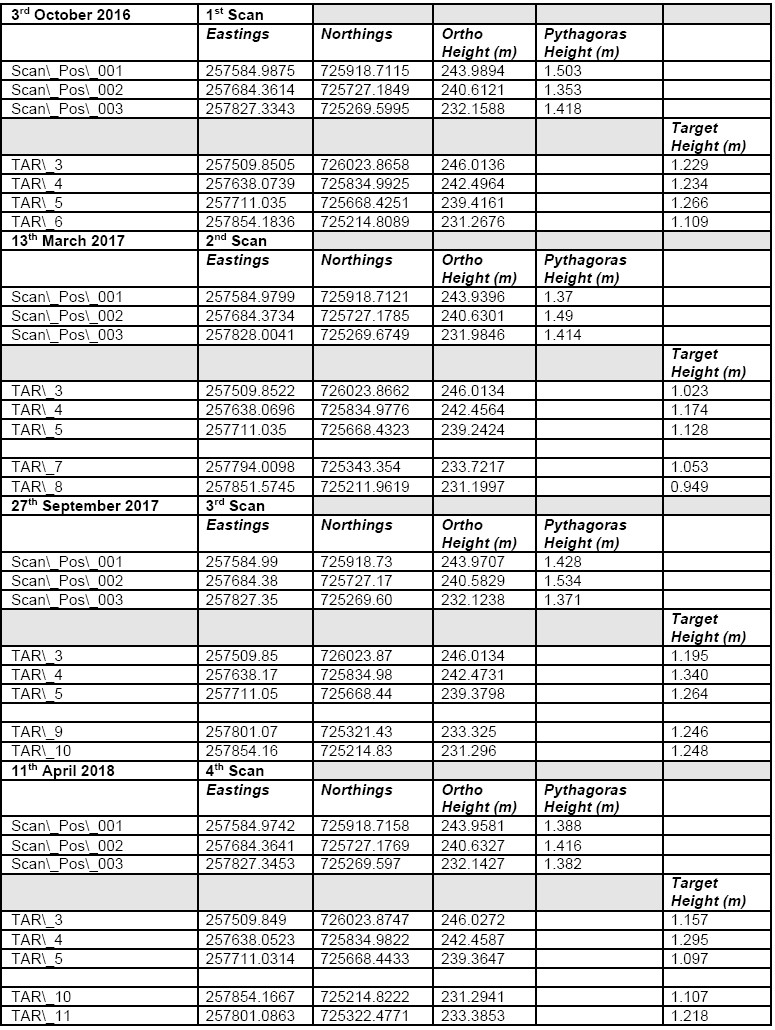
For each data set, a Digital Elevation Model (DEM) was generated from a high-resolution point cloud and geomorphic change was modelled from comparison of successive DEMs. Four DEMs were generated from long range TLS data (Table 1).
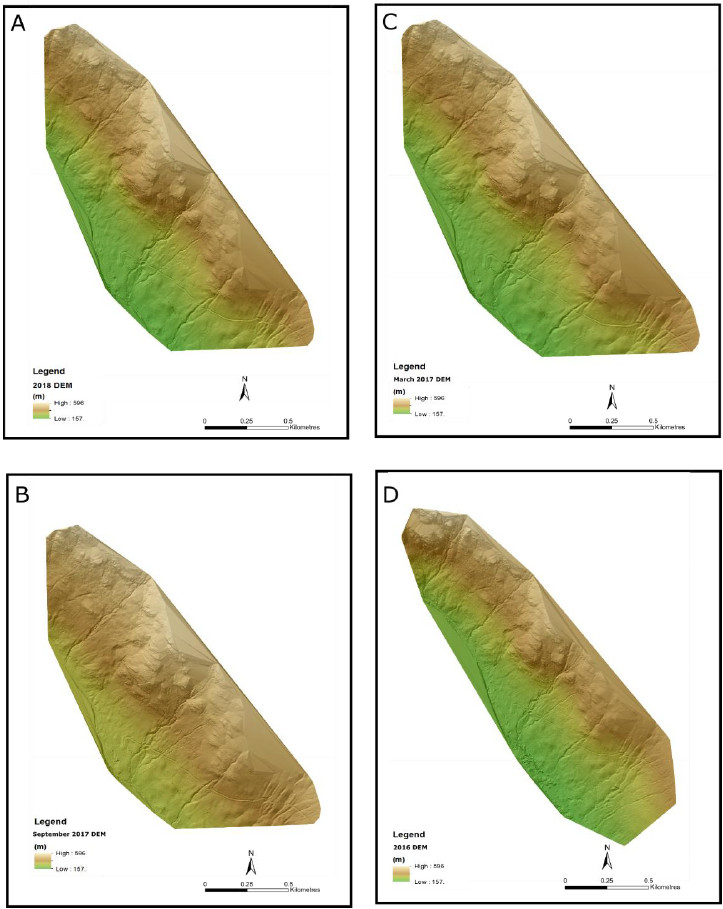
DEMS were generated at a resolution of 0.5 m due to the necessity of high local DEM accuracy for elevation-change analysis. The same workflow for DEM production that was used for the 2016 DEM was used to produce the 2018 DEM (Figure 3).

Interpretation to date
The point cloud data that had undergone manual cleaning required to remove artefacts in RiScan, were then decimated to 0.5 m using ToPCAT (Brasington et al., 2012). This was done to make the data set more manageable as the point clouds were too large to import into ArcGIS. The decimated minima point cloud was then interpolated to generate a DEM with a spatial resolution of 0.5 m.
A Geomorphic Change Detection (GCD) project was set up as the first stage in producing a DEM in ArcGIS (Brasington et al., 2012). The application of the project focussed on GCD where two DEMs that share the same geodetic co-ordinates are subtracted from one another to reveal morphological change. The DEMs of subsequent years (e.g. 2016-2018) were selected for analysis and summing the total change across the DoD quantifies the total volumetric change.
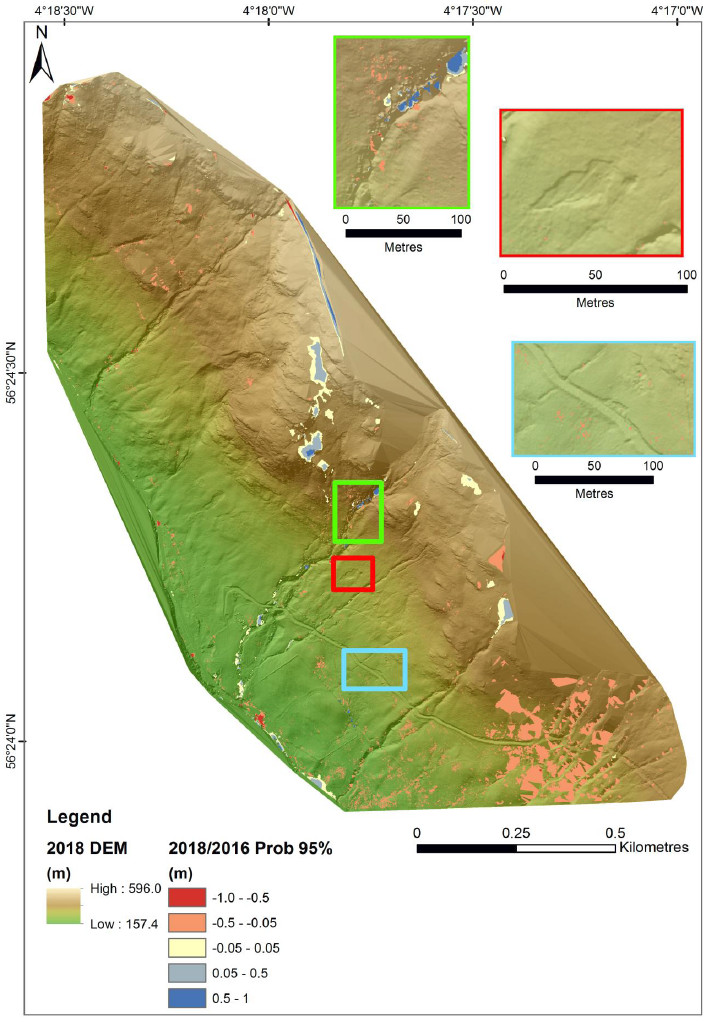
The DoD generation and thresholding approach detailed was also applied to the long-range TLS data to produce DoDs to determine change from October 2016 and April 2018. In this study, confidence levels of 68% and 95% were applied to the DoD within the GCD toolbox. 95% was found to most reliably discriminate between areas of true change and areas which showed erroneous changes arising from survey noise (gaps in data, crags, dense vegetation). The models (Figure 4) illustrate the topographic change between the two data sets where they overlap (red and blue section).
The darker the red, the more erosion has taken place, seen in the sides of the upper gullies of the slope with a maximum erosion of 0.5 m. Most change is observed in the north-east and lower sections of the slope ranging from -0.5 to 0.05 m. This change is spatially variable, with some change which can be attributed to lower vegetation levels, specifically bracken in October 2016.
The darker the blue, the more deposition has taken place, seen in the gullies of the slope with a maximum deposition of 1.0 m.
Most of the deposition seen within the gullies (in the range 0.5 - 1.0 m) can be considered real change as field observations show that sediment was displaced from the source (further up slope, out of scanning range) during the winter of 2017 and deposited in the area shown as net deposition.
In addition, the areas of the slope in the central upper section can be considered as unreliable change as that section was shadowed by the steep crags below generating an area of low point density (< 5 points m2). It can be determined that 85% of the slope has experienced no detectable change within this period, with specific attention to the shallow incipient landslide and neighbouring control site which also exhibited no change during the monitoring period (Figure 4).
Conclusions and Recommendations
The VZ-1000 produced high density point clouds. There were no issues with the scanner at any stage in our work and thanks to the training from GEF staff in Edinburgh we had no issues acquiring the data in the field or during processing.
TLS registration errors ranged from 0.019 to 0.023 m.
Point density over 1.4 km was 23 per m2, reduced to 17 per m2 after cleaning at the site of slope failure.
The data allowed the identification of spatially coherent changes in slope elevation, specifically erosion and deposition of 0.05-1 m over 30 months.
The post-processed data are accurate to within 30 mm and the loan has directly led to a PhD thesis and two papers currently in preparation (Gilles et al., in prep 2019).
Publications
Data was integral to Charlie’s PhD, which was completed in 2019 (accepted pending revisions which are expected to be complete by October 2019).
C.Gilles, T. Hoey and R. Williams, 2017. European Geosciences Union, Vienna Austria. PICO Talk titled: A multi-sensor approach to monitoring rainfall-induced slope failures in Scotland.
C.Gilles, T. Hoey and R. Williams, 2018. British Geomorphological Society, Hull, UK. Poster titled: A multi-sensor approach to monitoring rainfall-induced slope failures in Scotland.
C.Gilles, T. Hoey and R. Williams, 2018. Landslide impact on transport network conference at Geological Society London, UK. Talk titled: Evaluating a multi-method approach to landslide susceptibility in Scotland.
Data Archiving
The data will be offered to the National Geoscience Data Centre (NGDC).
References
Brasington, J., Vericat, D. and Rychkov, I., 2012. Modeling river bed morphology, roughness, and surface sedimentology using high resolution terrestrial laser scanning. Water Resources Research, 48(11).
Met Office- https://www.metoffice.gov.uk/
Milne, F.D., Werritty, A., Davies, M.C.R. and Brown, M.J., 2009, February. A recent debris flow event and implications for hazard management. Geological Society of London.
Milne, F.D., Brown, M.J. and Werritty, A., 2010. A hazardous channelized debris flow in Glen Ogle, Stirlingshire. Scottish Journal of Geology, 46(2), pp.181-189
