Scientific Report 1054
This report is also available as a PDF document .
Abstract
SEIS-UK provided a loan of 10 broadband seismic systems (7 x ESPD and 3 x 40T) for deployment in Ethiopia during May 2017 until October 2018. The network covers a profile across the north western margin of Afar. The instruments recorded continuously at 100 samples per second, with relatively minor data losses due to equipment problems. The dataset has been archived in the SEISUK data management system and will be archived with IRIS (Incorporated Research Institutions for Seismology). We have analysed the distribution and magnitudes of seismicity, and focal mechanisms, during a major mainshock and aftershock sequence near the network in March 2018. In addition, we have analysed teleseismic earthquake through the duration of the project for receiver functions in order to constrain crustal structure.
Background
The Africa-Arabia rift system encapsulates the transition from continental rifting in the East African rift to seafloor spreading in the Red Sea (e.g. Stab et al., 2016) (Fig. 1). The region is therefore the ideal locale to understand continental breakup processes. Within this system, the Afar rift is near to continental break and shows evidence for along rift variations in style of extension that may provide clues to the diverse mechanisms of pate extension, and temporal evolution of extension mechanisms during continental breakup (Stab et al., 2016).
The study area is ideal to understand the variations in magmatic processes, structure and deformation style from the early stages of extension preserved beneath the rift margin to the current rift centre. We also tested how the rift margin actively participates in the rifting process close to the breakup stage. The acquisition of passive seismic data from two profiles of very dense stations (510 km spacing) profiles from the plateau into the rift centre in central and northern Afar provided an unprecedented opportunity to understand the locus and mechanisms of crustal deformation processes responsible for continental breakup. The new seismic project built on structural fieldwork geochronology, and geodesy studies (e.g. Stab et al., 2016; Pagli et al., 2019). The work also builds on previous lower resolution analysis of Earth structure and seismicity from the 30-50 km spaced networks of the Afar Consortium projects during 2005-2009 and Afar0911 network of 2009-2013 (e.g. Hammond et al., 2011; Illsley-Kemp et al., 2018).
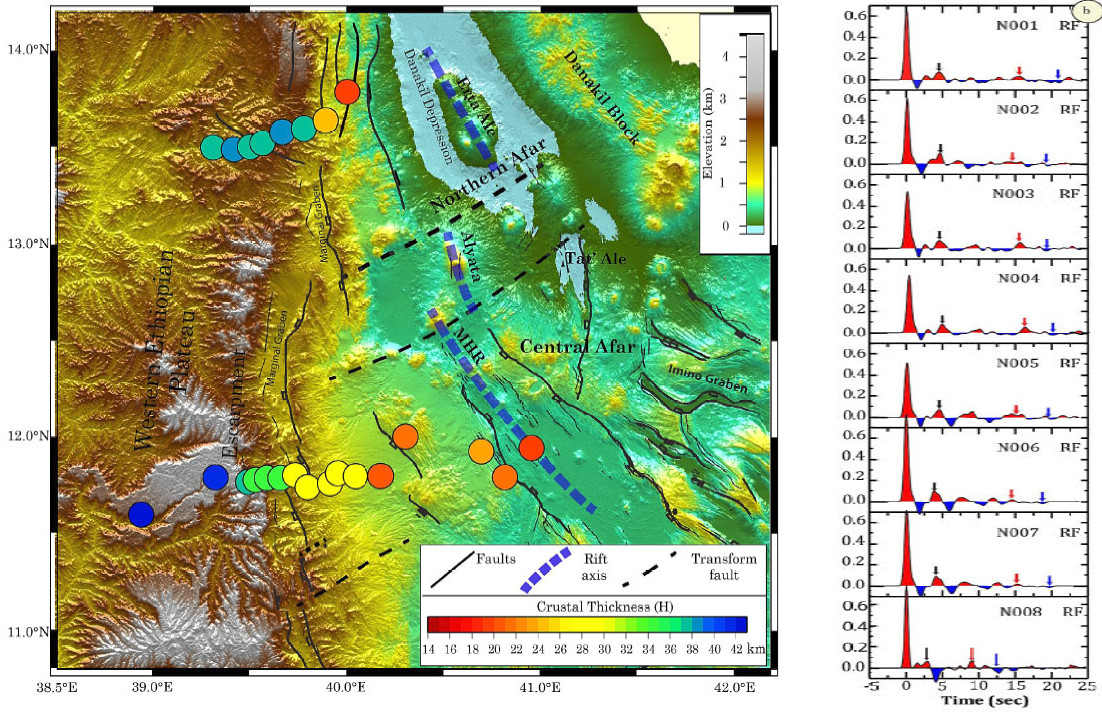
SEISUK loan 1054 was for 10 instruments of which 7 were Guralp CMG-3ESP-60s and 3 were Guralp CMG-40T-30s with CMG-DCM/EAM dataloggers. The loan supplements an ANR (France) funded project which included 20 French Sismob-RESIF broadband seismic stations of Guralp CMG40T-30s with Nanometrics Taurus digitizers. The 10 SEISUK sourced stations form the northern profile, whereas the SISMOB (France) sourced stations form the profile across central Afar (Fig. 1). The majority of funding for fieldwork came from the ANR project to Cecile Doubre and Sylvie Leroy, but was also supplemented by the NERC RiftVolc large grant to Keir, and from University of Pisa departmental funding to Carolina Pagli and Alessandro La Rosa.
Survey procedure
The fieldwork was conducted in collaboration with Addis Ababa University (AAU), University of Strasbourg (France), CNRS/Sorbonne University (France), and the University of Pisa (Italy). The instruments were shipped by Despatch Point Ltd from SEISUK in Leicester to Addis Ababa International airport. The customs agents of Addis Ababa University then led extracting the equipment through customs from the airport, with us providing logistical support such as providing vehicle and financial resources to speed up the customs processing and equipment transport. We transported the equipment to Addis Ababa University and conducted a Huddle Test overnight in early May 2017 on the IGSSA (9th) floor of the graduate school building at AAU. The Huddle Test showed that all the equipment worked as expected. This report outlines the deployment procedure of the SEISUK sourced instruments that form the northern profile.
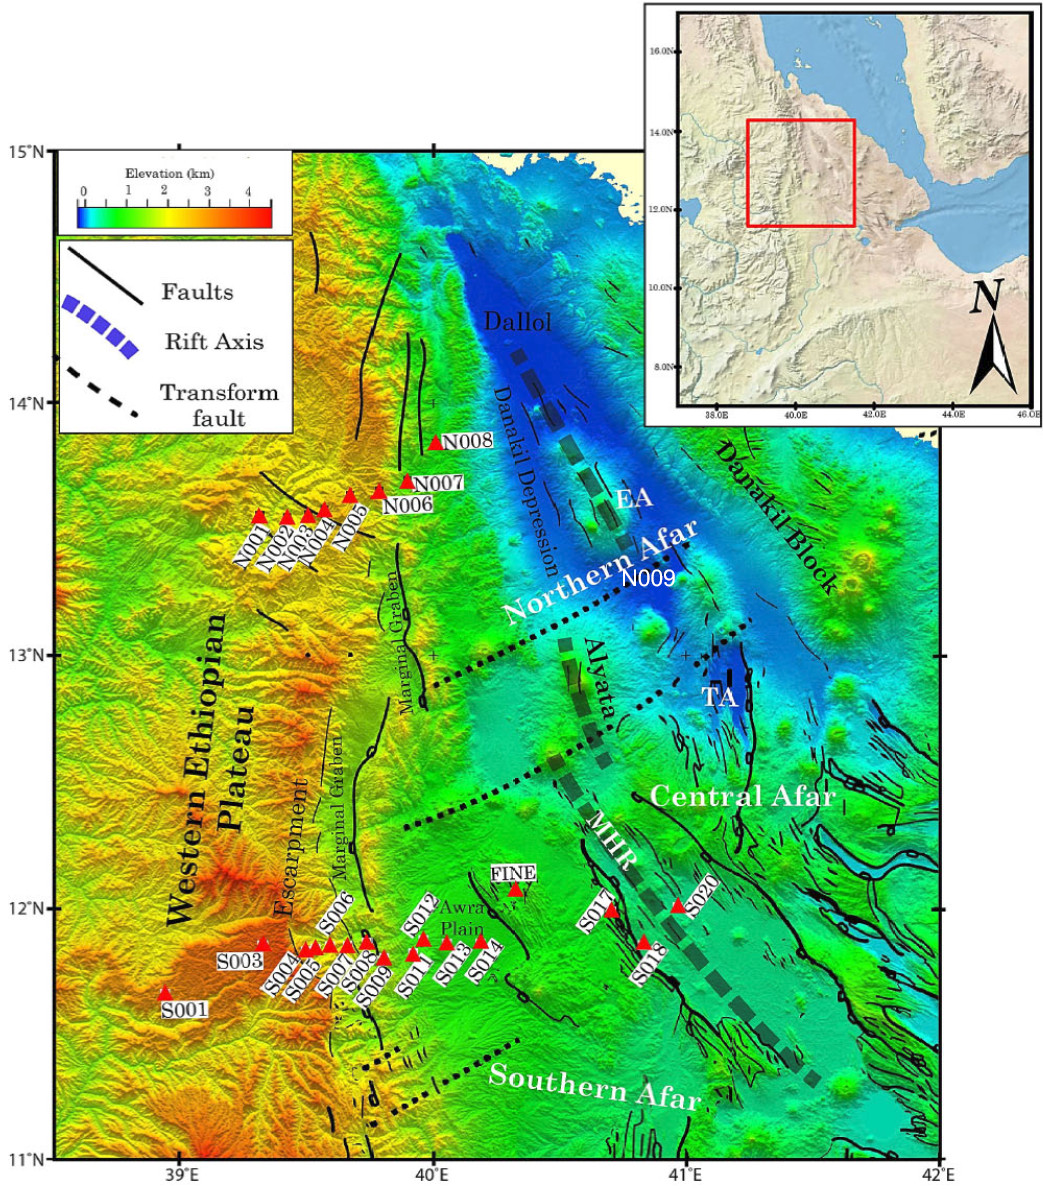
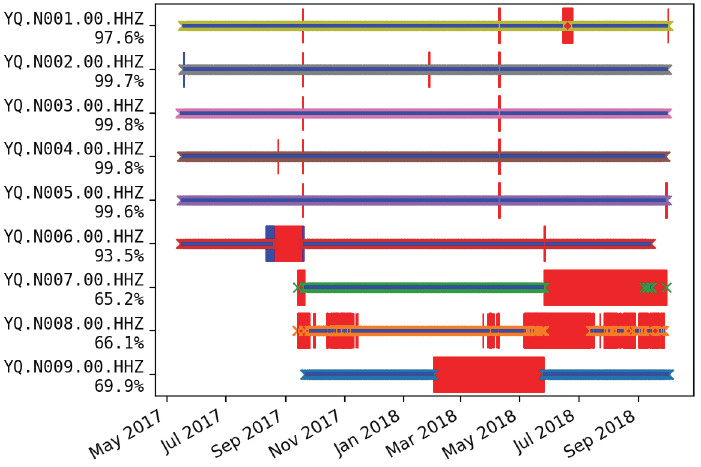
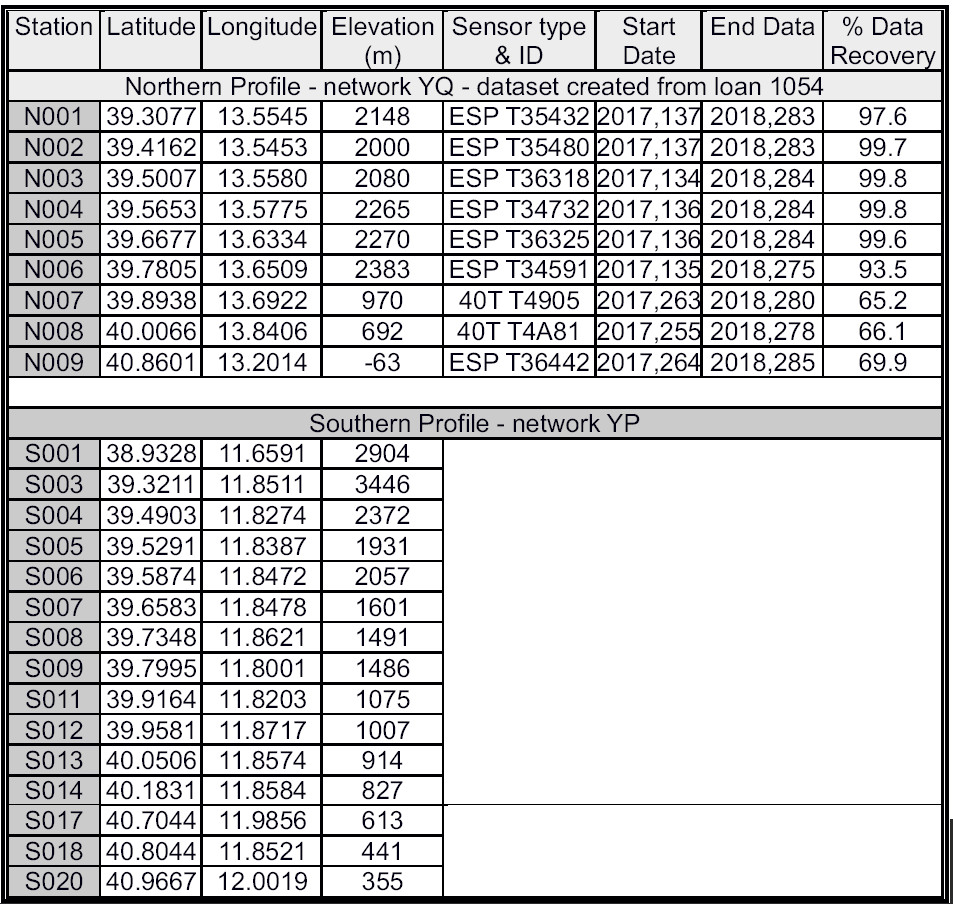
Phase 1 - May 2017 - We initially departed Addis Ababa with the 7 ESPD instruments packed in two 4x4 vehicles and travelled to the city of Mekele located on the Ethiopian plateau adjacent to northern Afar (Fig. 1). Initially we obtained permission to deploy 6 instruments on the profile positioned in towns within the Tigray Regional Government administrative area. For site choice, we located sites mainly in fenced compounds to maximize security. Care was taken to achieve a roughly regular spacing of stations, but not at the expense of finding a secure location. Available locations were mainly limited to towns that included a fenced government compound (e.g., police stations, clinic, government offices, military camps). In the countryside we identified a number of private farm houses with secure fenced compounds. We distributed the stations at a spacing of around 10-20km. Road access was good overall, partly because we had selected the profile position to correspond to accessible locations (Fig. 1). We did not deploy all 10 instruments during phase 1 for the following reasons due to delays in clearing the instruments through customs resulting in the deployment team having limited time. We deployed stations N001 to N006 on Fig. 1. These 6 instruments functioned well with high data recovery and no instrument malfunctions (Fig. 4). Only N006 lost some data due to battery failure following flooding (Fig. 4 & Table 1).
Phase 2 - October 2017 - The remaining ESP, and 2 of the 3 remaining 40Ts were deployed during the first service run. These instruments were tested in Addis Ababa prior to departure to the field, with the only issues being that the ESP had a broken horizontal component. We gained permission from the Afar Regional government to install sites in Afar to complete the eastern end of the profile (N007 & N008), and for one station in Afdera (N009). N007 and N008 were populated with 2 40Ts and N009 with the ESP with the non-functional horizontal component (Table 1). While deploying the 40Ts we had issues at the sites with getting the instruments to communicate with the DCM/EAM. We managed to get 2 stations up and running and due to the time lost were unable to deploy the final instrument and instead kept it as a spare. Despite these issues, we acquired an excellent dataset suitable for our goals as indicated in the data continuity plot shown as Fig. 4.
The seismometers were deployed in a hole ~1-1.5m deep, ~0.7m in diameter. Seismometers were placed in a plastic bag and buried directly in the soil, with the sensor pits were protected from the heat using buried reflective sheets. A second hole close to the seismometer hole was dug, and a plastic bin placed inside. This was of a depth so that the bin was ~20cm above the surface. The battery, break out box, were placed in this box with all cables attached. Cables for the sensor and firewire led from this box to the seismometer hole. Cables for the GPS and solar panels led out of the box and connected with the solar panels and GPS antenna located nearby. All cables out of the box were fed through flexible plastic conduit and secured to posts or buried. The battery/cable box was then covered with a layering of tarpaulin and plastic sheets, and secured with tape. Before the box was secured the configuration of the sensors was checked using the field notebooks for the ESPD and 40Ts. We paid all station gaurds 600 Ethiopian Birr per month, with the exception of the military camps where we were not allowed to provide payment.
All instruments recorded data at 100 samples per second. The complete northern profile dataset has been archived in the SEIS-UK data management system and the complete versions of both northern and southern profiles are on the computing system at the University of Strasbourg. Both will be archived with IRIS (Incorporated Research Institutions for Seismology). The data from loan 1054 will be archived as network YQ 2017-2018 (http://www.fdsn.org/networks/detail/YQ_2017/), and the SEISMOB data will be archived as network YP 2017-2018 (http://www.fdsn.org/networks/detail/YP_2017/)
Data quality (including example data)
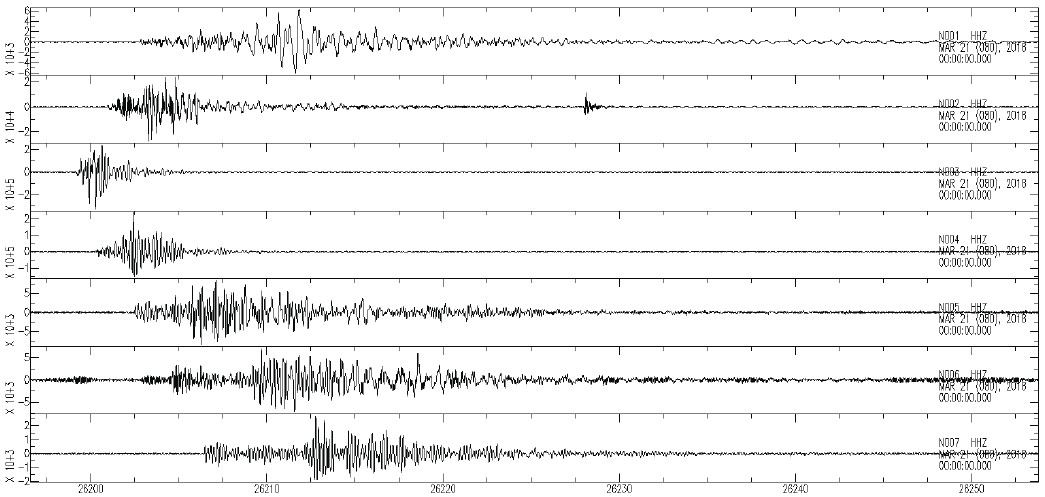
The ESPD and 40T systems used in the study and were generally user friendly, and we recorded well over 1000 earthquakes during the experiment (e.g. Fig. 2). The requirement to place instruments close to people meant anthropogenic noise is high during the day. Anthropogenic noise typically ranges between 2 - 25 Hz and overlaps the frequency content of the detected earthquakes (1-10 Hz) (Fig. 3). This significantly affects the ability to detect earthquakes during the day. (As a result, 45 times more earthquakes were detected at night). In contrast, microseism noise levels are low, close to the new-low-noise-model (NLNM) (Peterson, 1993), presumably as this area of Ethiopia is far from the coast (Fig. 3).

Processing and modelling
Earthquake detection - Fortunately during the project an M5.2 earthquake occurred on 24 March 2018 beneath the western margin of Afar in close proximity to the seismic network. The earthquake was reported on both the NEIC and gCMT catalogs, and is one of the largest earthquakes in Ethiopia during the past 50 years. We therefore focused attention on using our data to understand the mainshock and aftershock sequence. Earthquakes were identified in the continuous seismic data using a combination of manual inspection and using in STA/LTA detection algorithm on data filtered at 2-15 Hz. We have so far focused attention on the time period March and April 2018 during which the seismic activity was most intense, and during which ~1000 of earthquakes have been located. Prior to, and after this time period provisional analysis suggest the seismicity is limited to “background” microseismicity of around 3 events per day. The analysis shows that the main shock and aftershocks occurred along the western margin of Afar, a few 10s of km south of the northern profile of stations (Fig. 5).
Velocity model generation - We aimed to improve the earthquake locations along the WAM beyond previous studies (e.g. Illsley-Kemp et al., 2018, Ayele et al., 2007) by recording earthquakes on a denser than previous seismic network and also through use of an improved velocity model. For this study we generated a 2.5D velocity model across the WAM that draws on crustal thickness constraints from previous controlled source profiles (Makris and Ginzburg, 1987), and more recent receiver function work (e.g. Hammond et al., 2011; Ahmed et al., in review). The internal P-wave velocity structure of the crust was constrained from the previous controlled source profiles, and a Vp/Vs of 1.76 derived from constructing Wadati diagrams from the P- and S- wave travel times from local earthquakes. The earthquakes have been located using NonLinLoc. The magnitude of the detected earthquakes (ML) was calculated using the amplitude of the synthetic Wood-Anderson displacement seismographs, and the local magnitude distance correction of Illsley-Kemp et al. (2017).
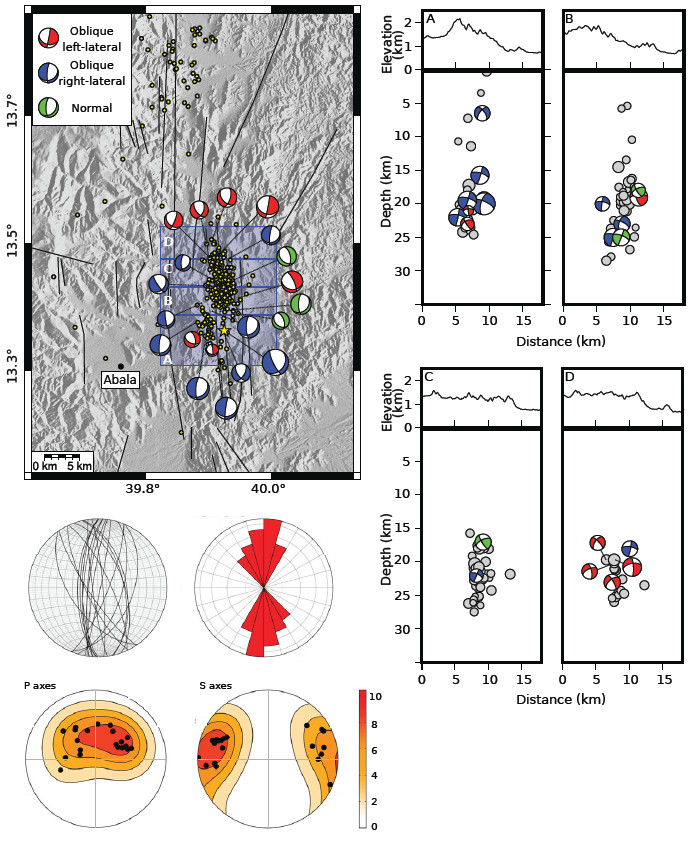
Fault plane solutions (FPS) - FPSs were calculated using first motion P-wave polarities picked on this catalog of well-located events. We inverted for the best fitting FPS using Focmec. We use only P-wave polarity picks to calculate the FPSs (Fig. 5).
Receiver functions - For the receiver functions analysis, the IRIS earthquake catalog was searched for events with magnitude 5.5 Mb, occurring within an epicentral distance range of 30°-95° from the center of the network. To increase the azimuthal coverage, regional events between 20° and 30° were also included. During the operational period of the network, ~126 teleseismic earthquakes were recorded and collected for receiver function construction and processing. After removing the mean and the first-order trend from the selected waveforms, the data were band-pass filtered using a zerophase Butterworth bandpass filter with corner frequencies of 0.02 0.8 Hz and windowed 5 s before and 35 s after the theoretical P arrival time. We then rotated the horizontal seismograms into a greatcircle path from the ZNE coordinate system to the ZRT coordinate system. We utilize the iterative time domain deconvolution technique of Ligorria & Ammon (1999), to compute the receiver functions with 200 iterations. We use a Gaussian pulse of 2.5 s width in the deconvolution of the vertical trace to predict the radial one (Ligorria & Ammon, 1999). To determine average crustal properties, we analyze receiver functions for each station using the H-k domain stacking technique of Zhu and Kanamori [2000], assuming the P-wave velocity taken from nearby refraction profiles (Makris & Ginzburg, 1987). To estimate the standard deviation for both crustal thickness H and Vp/Vs, we employ the bootstrap resampling technique.
Interpretation to date and preliminary findings
Seismicity - We located ~1000 earthquakes associated with the 24 March 2018 M5.2 earthquake beneath the western margin of Afar (Fig. 5). The cluster of earthquakes is ~15 km long and mainly at 15-25 km depth. Cross sections of the cluster show evidence that at least the southern portion of the sequence occurred on westward dipping antithetic faults. The northern part of the cluster shows now clear dip direction. The focal mechanisms show that there is a mix of pure normal and slightly left and right lateral oblique slip events. The combination of all the focal mechanisms suggests the direction of extension is locally near E-W (Fig. 5). The sequence of earthquakes suggests that the border faults of Afar are still active, and that the faults potentially penetrate into the lower crust. The results of the seismicity will be presented at EGU 2020 (La Rosa et al., 2020).
Receiver functions - The crustal thickness H and Vp/Vs estimated from receiver functions analysis are shown in Fig. 6. Most of the stations, show a strong and easily identifiable Pms Moho conversion phase on individual and stacked receiver functions (Fig. 6). The corresponding Multiple PpPs, in most cases is also identifiable, but not as consistently visible as Ps, while the later arrival multiple PpSs+PsPs are variable and ambiguous to a varying degree and could be observed clearly at only a few stations. The Moho conversion phase and/or its multiples may be disturbed by reverberations from near surface, low velocity sediment layers and intracrustal and/or upper mantle interfaces at some stations. Crustal thickness changes from ~14 km in the rift to ~39 km beneath the plateau, with the Vp/Vs ranging from 1.73 to 1.85, but with an average of ~1.76. The crust does not thin progressively along the profile, but instead in 3 discrete steps, pointing towards episodic thinning of the plate (Ahmed et al., in review).
Conclusions and recommendations
During May 2017 to October 2018, we operated a network of 6 ESPD and 3 40T seismometers that form a dense profile across the rift margin of northern Afar. We recorded, located and derived focal mechanisms for a swarm of ~1000 earthquakes following an M5.2 earthquake on 24 March 2018. The earthquakes cluster to a ~15 km long fault system of the rift margin at a depth of 15-25 km. The sub surface shape of the cluster is quite complex showing that potentially both antithetic and synthetic fault segments are active. Receiver function show that the crust thins from ~38 km beneath the Ethiopian plateau to ~14 km thick beneath the rift valley. The thinning occurs in. stepped fashion pointing towards episodic thinning of the plate during continental breakup. Data has been archived on the SEISUK data management system and will be archived to the IRIS-DMC shortly.
Publications
Ahmed et al., in review, Crustal Structure Variations beneath the Western Afar Margin from Receiver Functions, Tectonophysics.
La Rosa et al., 2020, Anomalously deep earthquakes in the March 2018 swarm along the Western Margin of Afar, EGU2020-3084.
Additional References
Illsley-Kemp, F., Keir, D., Bull, J., Gernon, T., Ebinger, C., Hammond, J. O. S., Belachew, M. (2018). Seismicity during continental breakup in the Red Sea rift of Northern Afar. Journal of Geophysical Research, 1-18. doi: 10.1002/2017JB014902.
Illsley-Kemp, F., Keir, D., Bull, J., Ayele, A., Hammond, J. O. S., Kendall, J-M., … Goitom, B. (2017). Local earthquake magnitude scale and b-value for the Danakil region of Northern Afar. Bulletin of the Seismological Society of America, 107(2), 521-531. doi: 10.1785/0120150253.
Ligorria, J., Ammon, G., 1999. Iterative deconvolution and receiver function estimates, Bull. Seis. Soc. Am. 89, 1395-1400.
Makris, J., Ginzburg, A., 1987. The Afar Depression: Transition between continental rifting and sea-floor spreading. Tectonophysics 141, 199-214.
Stab, M., Bellahsen, N., Pik, R., Quidelleur, X., Ayalew, D., Leroy, S. (2016). Models of rifting in magma-rich settings: Tectono-magmatic evolution of Central Afar. Tectonics 35, 2-38, doi: 10.1002/2015TC003893.
Zhu, L., Kanamori, H., 2000. Moho depth variation in Southern California from teleseismic receiver functions, Journal of Geophysical Research 105, 2969-2980.
