
Scientific Report 1040
This report is also available as a PDF document .
Abstract
Large volcanic eruptions are commonly associated with a collapse of the roof of a crustal magma reservoir, forming a caldera. Only a few such collapses occur per century, and the lack of detailed observations prior to the Bardarbunga collapse meant we knew little of the mechanical interplay between collapse and eruption. The collapse of Bardarbunga Caldera 2014-2015 provided a unique opportunity to observe these processes in action.
We borrowed four GNSS receivers from late 2014 to summer 2015, to assist in monitoring the caldera collapse, which occurred during the largest eruption in Iceland for 230 years, and the subsequent re-inflation once the eruption ended in late February 2015. The GEF receivers joined a pool of other receivers to provide good overall coverage. Because of particularly high snowfall over winter 2014-2015, we were not in the end able to deploy all receivers in the pool, including the GEF receivers, but this report is based on the success of the overall project.
GNSS monitoring of the deformation around the caldera played a key role in constraining the depth of the magma reservoir associated with the collapse. Taken together the data can be explained by collapse initiated through withdrawal of magma, and lateral migration for 48 km from a 8-12 km deep reservoir. The collapse rate, which followed a near-exponential decline, and the eruption rate, which followed a virtually identical decline during the 180-day long eruption, can both be explained by the interaction between the pressure exerted by the subsiding reservoir roof and the physical properties of the subsurface flow path.
Background
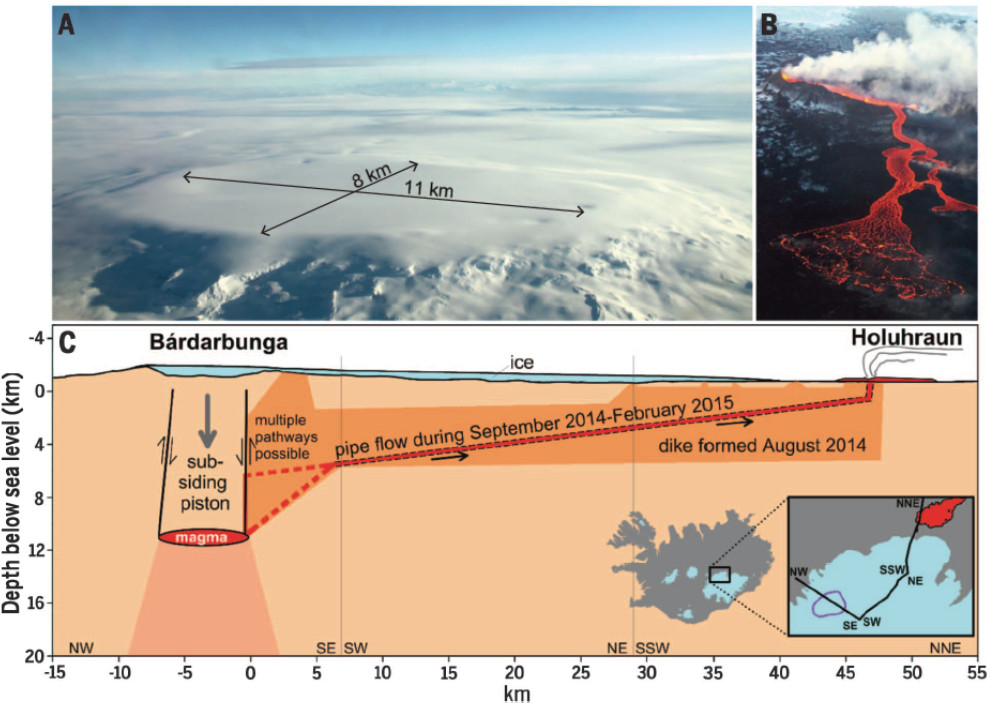
Bardarbunga volcano and its related fissure swarms form a 150-km‐long volcanic system on the boundary between the North American and Eurasian tectonic plates (Fig. 1). The volcano resides beneath the Vatnajökull ice cap and has a broadly elliptic 11- by 8-km‐wide and 500-to 700-m-deep caldera with a long axis trending east-northeast. About 700-800 m of ice fills the caldera. More than 20 eruptions have occurred on the fissure swarms outside the caldera in the last 12 centuries, including three that produced 1 to 4 km3 of magma, but no eruptions are known within the caldera in this period.
An eruption began in the Bardarbunga volcanic system in Iceland on 31st August 2014. The eruption was effusive in nature and occurred in Holuhraun, some 45 km from the Bardarbunga central volcano. Measurements from airborne radar on 5th September revealed a subsidence bowl within the caldera, indicating up to 16 m of subsidence at that 2 time. A GNSS instrument installed within the caldera on 12th September showed that the caldera was subsiding by some 40 cm per day. This subsidence showed little sign of decreasing in rate and it was reasonable to assume then that this volcanic activity would continue for many more months, which in fact it did, finally ending in February, 2015.
Measurements of the ground deformation in the region surrounding the caldera are key to understanding the nature of the caldera collapse. However, there are several sources of deformation in this region: glacial isostatic adjustment due to shrinking of the ice caps, plate spreading along the rift zones and a post-rifting signal from the dike feeding the eruption. A dense network of deformation measurements was therefore necessary in order to disentangle these sources and isolate the collapse signal from the other sources of deformation.
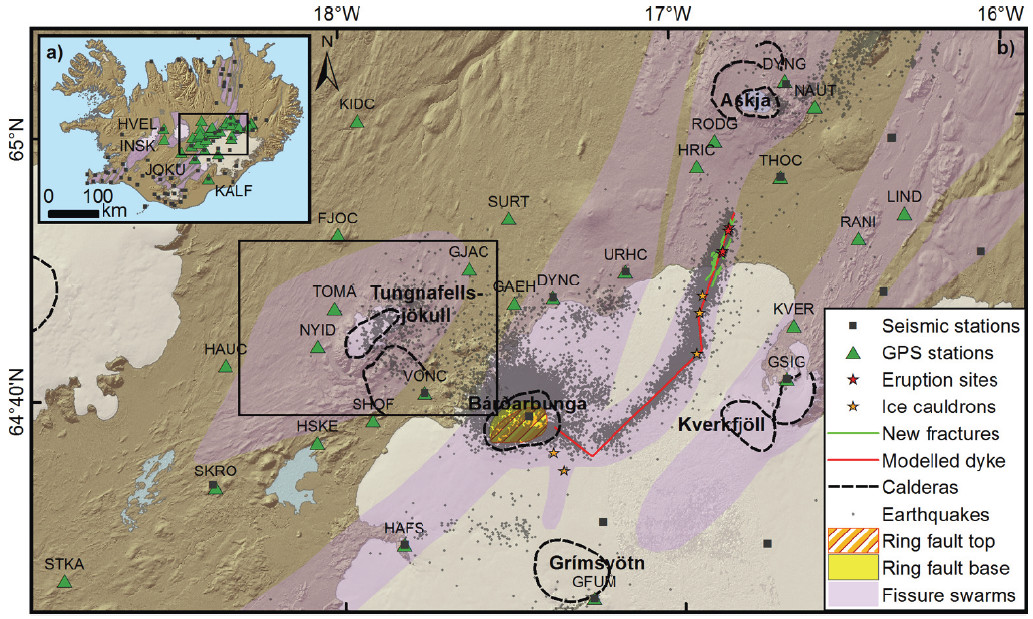
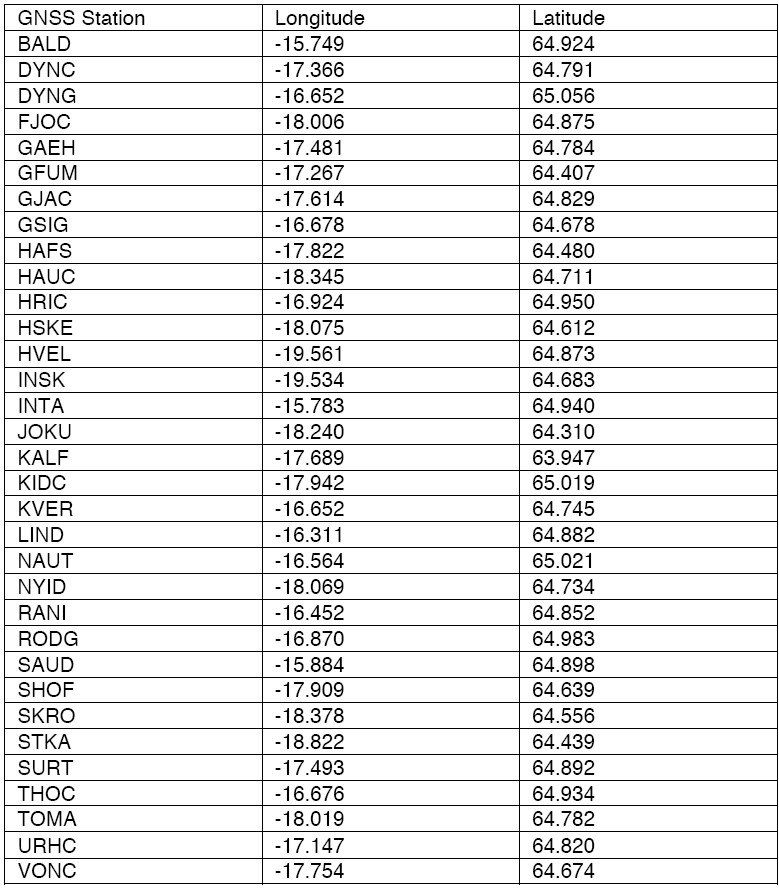
During summer months, the required density of deformation measurements can be achieved using inteferometric sythetic aperture radar (InSAR), but in winter, snow makes these measurements impossible. We proposed to deploy four GNSS instruments, borrowed from the GEF, to fill gaps in the existing GNSS network run by the Icelandic Met Office, with the aim of providing the required density of measurements over winter. Due to an exceptionally high snow fall over the 2014-2015 winter, we were not in the end able to deploy the four instruments. We were, however, able to deploy several GNSS instruments from other sources (Fig. 2, Table 1). These data, were used, together with seismic data, to model the sources of the collapse.
Objectives
The specific objectives of this proposal were:
1) to measure the deformation field in the region surrounding Bardarbunga volcanic system,
2) to isolate the deformation signal associated with the collapse of Bardarbunga,
3) to model the geodetic and seismic data to answer key questions about the source of the subsidence, e.g. depth, geometry and volume of the magma source(s) and geometry of faulting above the magma source(s),
4) to determine from the faulting and source geometry the likelihood of catastrophic collapse and eruption within the caldera.
These objectives are important for the scientific understanding and hazard assessment of volcanic systems and collapse calderas, both to the global community and to researchers working specifically in Iceland. They are central to the NERC mission and the dataset produced will be of lasting importance.
Survey procedure
We were not able to deploy the GEF receivers due to exceptionally high snowfall during winter 2014-2015.
Processing and modelling
GNSS data were analysed at the University of Iceland and the Icelandic Meteorological Office using GAMIT-‐GLOBK 10.6. The data were processed in the ITRF2008 reference frame using over 100 worldwide reference stations.
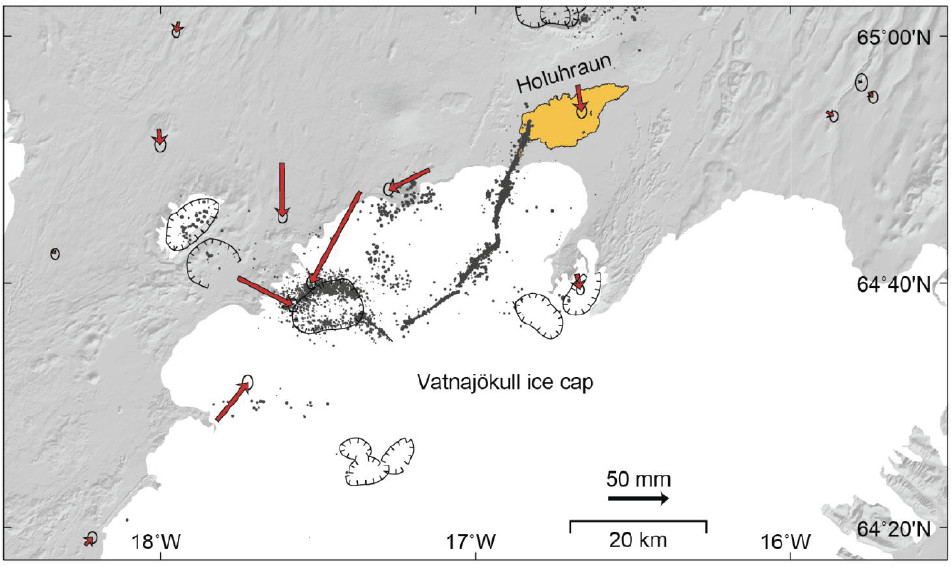
To determine the approximate depth of the magma chamber, we modelled post-rifting InSAR and GPS data (Fig. 3) using a point pressure source in an elastic halfspace. The depth range at 95% confidence is 8-12 km.
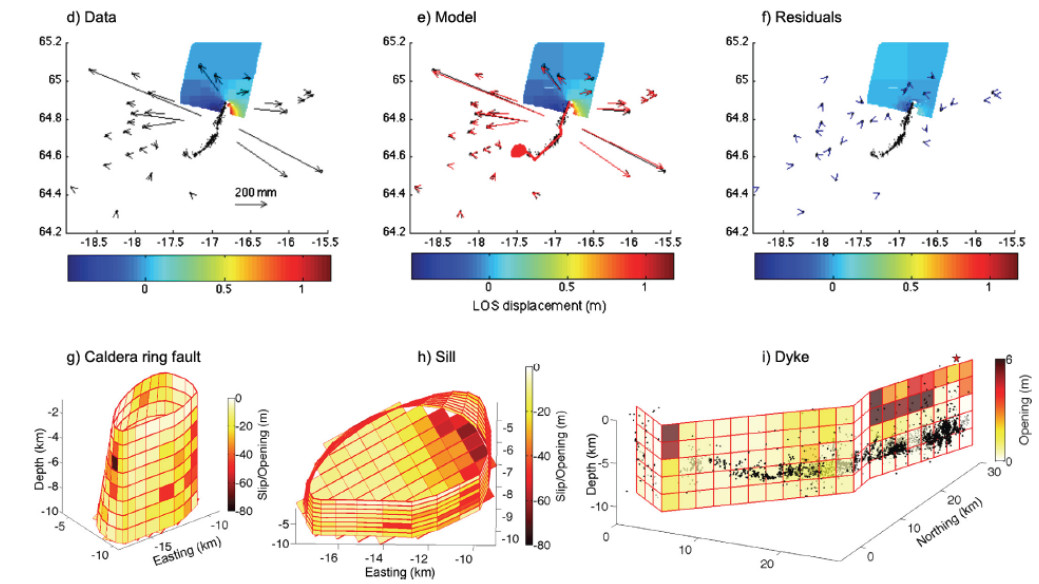
We also generated a series of more complex deformation models covering the period 16th August 2014 to 10th April 2015. Each of these models comprise i) a sill, at depth beneath Bardarbunga caldera, representing the magma reservoir; ii) a caldera ring fault system and iii) a dyke, which extends from the southeast edge of the caldera to the eruption site (Fig. 4). We utilised a ring fault and magma reservoir geometry. In addition we also incorporated the dyke geometry defined by Sigmundsson et al.(2015). We modelled the caldera ring fault, sill and dyke as a series of rectangular dislocations (patches) in an elastic half‐space (Okada, 1992). We employed Bayes’ Theorem to calculate the posterior probability distribution for slip on the ring fault and opening of the sill and dyke, assuming a uniform a priori probability over a range of possible values (Sigmundsson et al., 2015). We jointly solved for the opening along the dyke (24 patches in azimuth and 5 in depth), slip on each segment of the ring fault (24 patches in azimuth and 8 in depth) and the closing of the sill (85 patches)
Interpretation
We explain the longer term (eruption-‐scale) coupling and gradually decline of the rates of caldera subsidence, caldera volume change and lava eruption with a model of a collapsing piston overlying a pressurized magma chamber. We found the chamber pressure and fault friction each partially support the piston weight. Drainage of magma reduces the chamber pressure and causes piston subsidence. This in turn raises the chamber pressure, leading to a feedback loop that maintains quasi-‐constant pressure at the magma chamber top, and drives further magma drainage. The pressure feeding the eruption drops, however, due to the reduction in hydraulic head of magma over time. Assuming that the time-‐averaged resistive force due to friction on the ring faults remains constant, and that magma flow is laminar through a cylindrical pipe with radius r, and conduit length L, with L»r, then

Where is ΔP the driving overpressure, ΔP0 is the initial driving overpressure, ρ is the density of the magma, g is gravitational acceleration, A is the cross-sectional area of the magma chamber, v is the dynamic viscosity of the magma, L is the length of the conduit and t is time. We estimated ΔP0 and the constant in the exponent, assuming that the measured subsidence within the caldera represents the decrease in magma chamber height with time. The model also fits the measured caldera volume change and eruption rate. This model predicts the same form of decay in flow rate (exponential) as the standard ‘Wadge’ model of depressurisation of an overpressured magma body, but by a different mechanism. Without the feedback mechanism of re-‐pressurisation from the ongoing piston collapse the dyke would likely not have proceeded far enough to even begin erupting. In this model, which is supported by the data, the eruption drives the collapse and the collapse also drives the eruption.
Conclusions
We conclude that interaction between the pressure exerted by the subsiding reservoir roof and the physical properties of the subsurface flow path explain the gradual near- exponential decline of both the collapse rate and the intensity of the 180‐day‐long eruption. By combining our various data sets, we show that the onset of collapse was caused by outflow of magma from underneath the caldera when 12 to 20% of the total magma intruded and erupted had flowed from the magma reservoir. However, the continued subsidence was driven by a feedback between the pressure of the piston‐like block overlying the reservoir and the 48-‐km long magma outflow path. Our data provide better constraints on caldera mechanisms than previously available, demonstrating what caused the onset and how both the roof overburden and the flow path properties regulate the collapse.
Location of archived data
The data have been archived at the University of Iceland, and will soon be made available to the public through the FUTUREVOLC data hub.
Publications
Gudmundsson, M. T., Jónsdóttir, K., Hooper, A., Holohan, E. P., Halldórsson, S. A., Ófeigsson, B. G., et al. (2016). Gradual caldera collapse at Bárdarbunga volcano, Iceland, regulated by lateral magma outflow. Science, 353(6296).
Parks, M. M., Heimisson, E. R., Sigmundsson, F., Hooper, A., Vogfjörd, K. et al. (2017), Evolution of deformation and stress changes during the caldera collapse and dyking at Bárdarbunga, 2014-2015: Implication for triggering of seismicity at nearby Tungnafellsjökull volcano. Earth and Planetary Science Letters, 462, pp.212-‐223.
Sigmundsson F, Hooper A, Hreinsdottir S et al. (2015) Segmented lateral dyke growth in a rifting event at Bárðarbunga volcanic system, Iceland, Nature, 517, pp.191‐195.