Scientific Report 1036
This report is also available as a PDF document .
Abstract
As part of a survey of the resistivity structure of the central main Ethiopian rift we used the GEF TEM and solar panels in 2016, and just solar panels in 2017. Solar panels were used to power magnetotelluric (MT) systems borrowed from Dublin, Ireland. The equipment performed as expected but the MT data quality was only average owing to significant civil unrest at the times of our surveys. Nevertheless our 2016 data were sufficient to publish a 2D cross-rift profile model, and we are in the process of preparing a manuscript on a 3D model of a broader area; the latter was presented at the 2020 virtual EGU meeting. The western flank of the rift is associated with high conductivities, interpreted as abundant melt, whilst the restive Aluto volcano is underlain by a prominent resistor. Our 3D model has ubiquitous high conductivities in the lower crust, away from the Wonji fault belt to the southeast. The extent and location of this feature corresponds well with a low shear wave speed feature obtained from ambient noise tomography.
Background
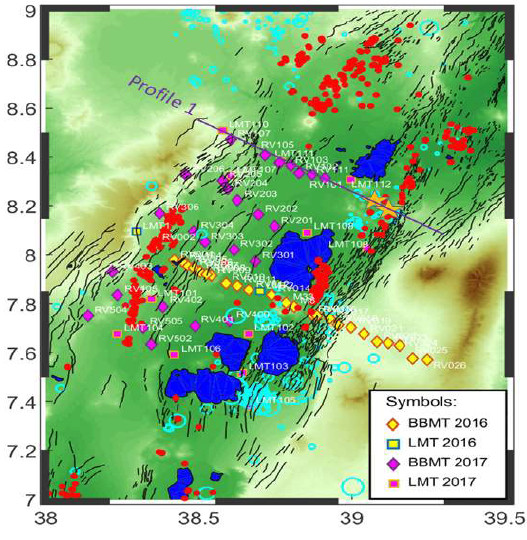
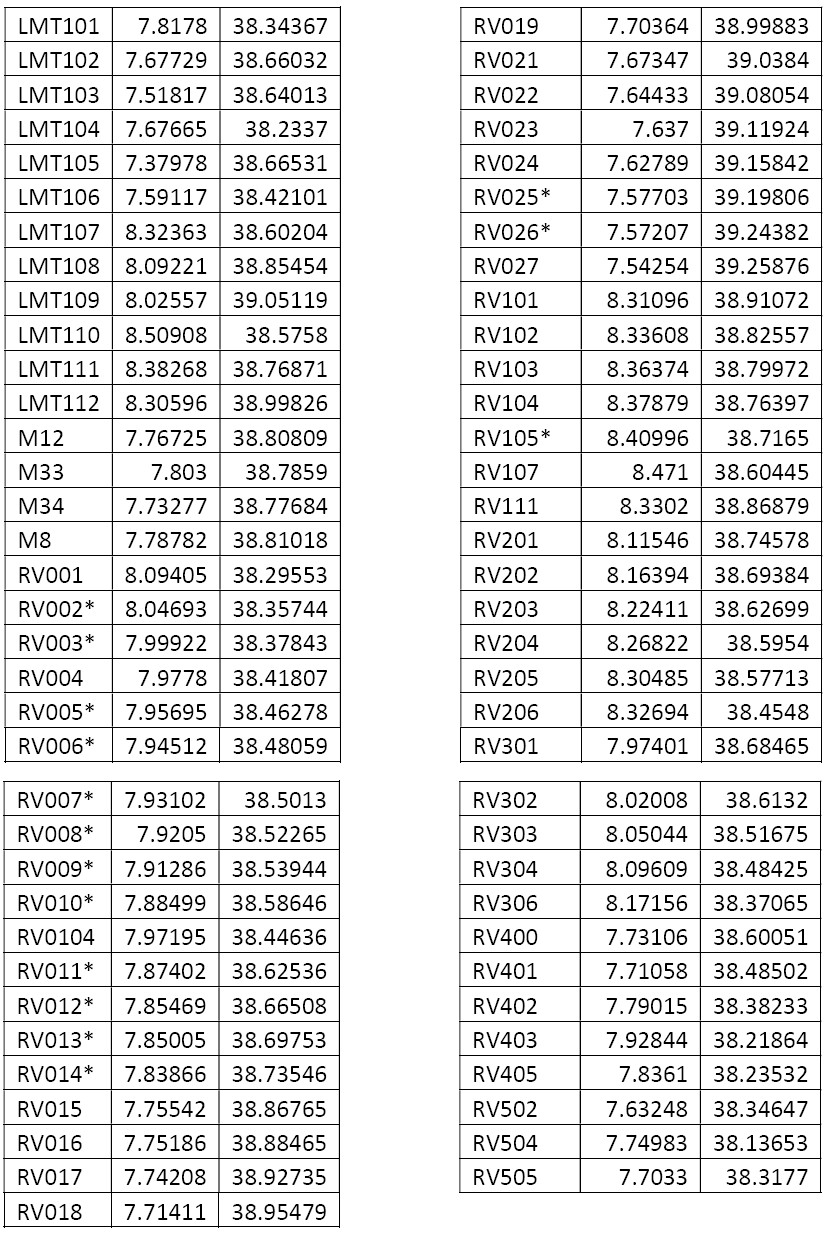
The loan consisted of 8 regulated solar panels and a complete Geonics TEM system, consisting of a TEM 47 transmitter and PROTEM receiver plus various batteries, cables, coils and a laptop with dongle (in 2016) and 8 regulated solar panels (in 2017). Figure 1 shows our MT sites from both seasons, comprising 57 broadband and 12 long period sites.
Survey procedure
Each MT system was attached to 2 solar panels (broadband sites) or 1 solar panel (long period sites) for the full recording time. After some experimentation, the TEM system was deployed with a 100 m x 100 m square source loop, with effective receiver loop size of 31.4 m2, and integration times from 0.25 to 120 s. TEM data were collected at all sites from the 2016 campaign (yellow diamonds in Figure 1).
Data Quality
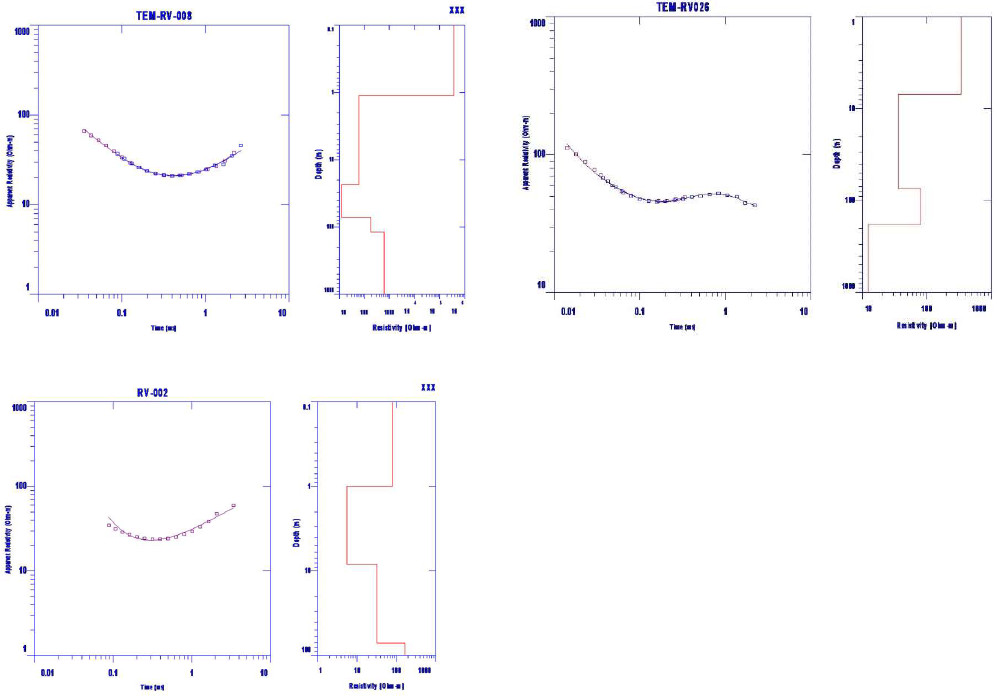
TEM data were of good quality (see Figure 2). MT data quality was variable, owing primarily to significant civil unrest at the times of our surveys. People interfered with our equipment and threatened our guards. Some sites had to be brought in early, compromising the long period data we hoped to collect. Other places where we would have liked to install sites were not deemed safe enough or could not have been accessed safely, or road closures meant we were unable to travel to and from them. These difficulties also reduced the number of sites we occupied. Since we were intending to produce a 3D model from data from season 2, where galvanic distortion is less of an issue, and because of the fieldwork challenges anticipated (and realised), we decided not to collect TEM data in 2017.
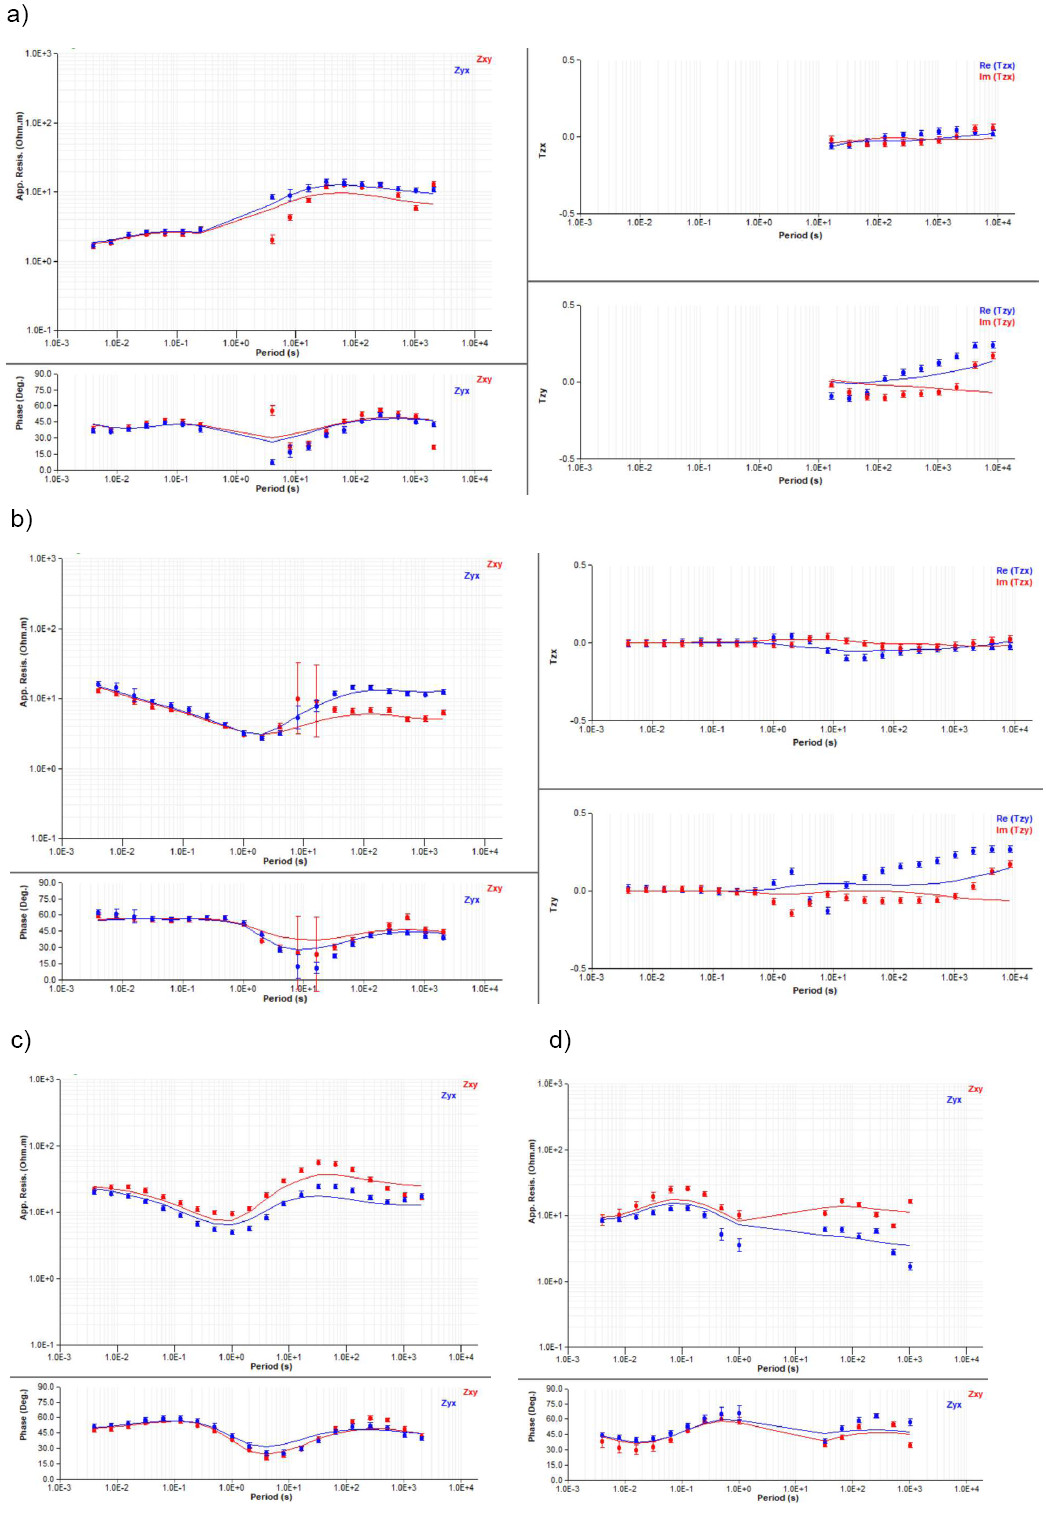
Sample off-diagonal MT impedance tensor elements, and tipper components for long period sites, are shown in Figure 3.
Processing and modelling
TEM data were processed to provide apparent resistivity as a function of time (left hand panels of figure 2) and then inverted for 1D layered models of resistivity as a function of depth (right hand panels of figure 2). The data predicted by the models are shown as continuous lines on the data plots.
MT data were robustly processed using remote referencing (based on the codes of Egbert (1997) and Smirnov (2003) for BBMT and LMT respectively) to calculate the impedance tensor elements as a function of period. The fluxgate magnetometers in the LMT systems measured all three magnetic field components, enabling tipper vectors also to be estimated.
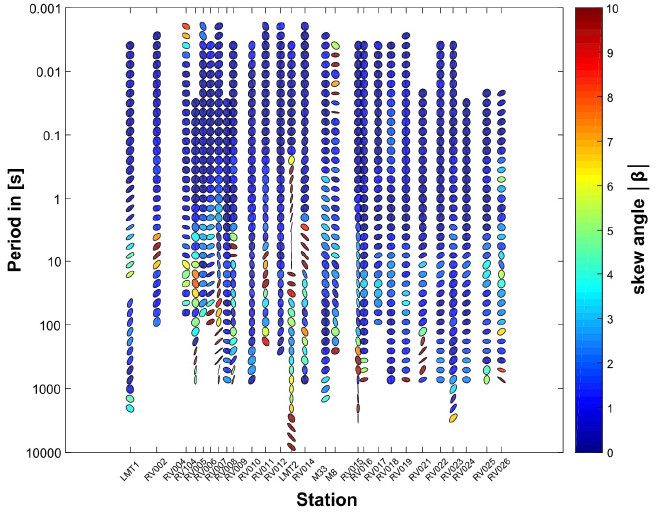
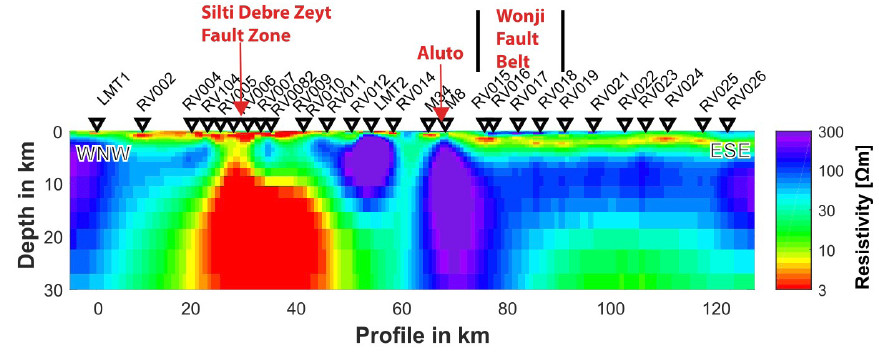
For data collected in 2016, phase tensors (figure 4) and other analyses indicated that they were broadly consistent with a 2D interpretation. Strike analysis (Zhang et al., 1987) did not indicate any dominant geoelectrical strike direction, so we chose it to be trend of the rift, 28N. The determinant average (DET) is invariant to strike angle and should be less noisy than the individual TE and TM components. We applied regularised inversion to the DET apparent resistivity and phase, and also the TE and TM modes separately and together, using the code of Kalscheuer et al. (2008). A fine model discretization between adjacent stations along the profile allows the inversion to introduce small near-surface heterogeneities, compensating for static shift (rather than correcting the data prior to inversion). The model and root-mean-square misfit did not vary much as the error floor varied between 10% and 90%. Nor did they change significantly with the starting homogeneous half-space resistivity value. Figure 5 shows our preferred model, from inversion of the DET data; others are shown in the supplementary material of H bert et al. (2018). The robustness of the main features was established by sensitivity tests. Subsequently, Dambley et al. (2020) obtained a similar result with 3D inversion of the data (including additional sites over the Aluto volcano) using a 3D code (Grayver, 2015).
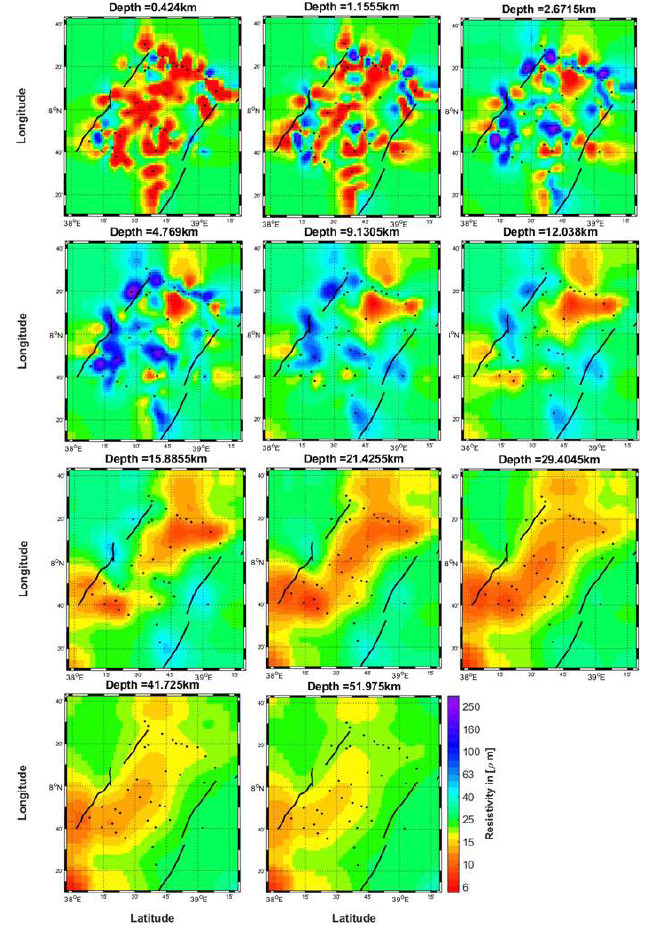
Impedance tensors and, where available, tippers, from all sites collected in this project, and two provided by Reykjavik Geothermal over one of their geothermal concessions (see figure 1), were inverted for a 3D model. Depth slices through it are shown in figure 6. Data predictions are the continuous lines on figure 3.
Interpretation/preliminary findings
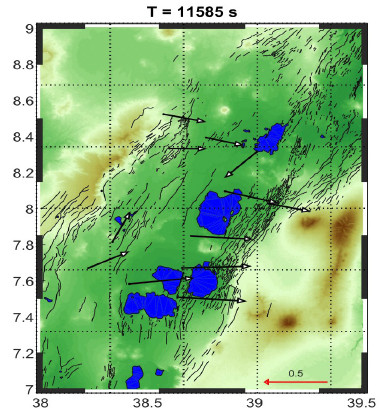
Samrock et al. (2015) undertook a local MT survey of Aluto volcano. They inferred a resistor beneath the volcano, in contrast to high conductivity beneath other Ethiopian volcanoes. The result was even more surprising as the volcano is actively deforming and degassing (Hutchison et al., 2016), so a magma reservoir, that would normally be conductive, is expected. Subsequently, Wilks et al. (2017) inferred that the magma reservoir is bubbly, meaning the melt will be poorly connected and hence the bulk resistivity will be high. Our survey confirms the high resistivity beneath Aluto, and that Samrock et al.’s (2015) result is not because of the limited aperture of their array. Samrock et al (2015) also inferred the existence of a good conductor to the north-west from the orientation and magnitude of the long period induction vectors, again confirmed in our survey. Our induction vectors and 3D model imply this is an elongated feature along the Silte Debre Zeyt fault zone (SDZF, figure 7). However, challenges remain in the interpretation. Iddon et al.’s (2019) melt inclusion data indicate high water content for Aluto melt, but low water content for SDZF melt, suggesting low and high resistivity respectively, in contrast to observations.
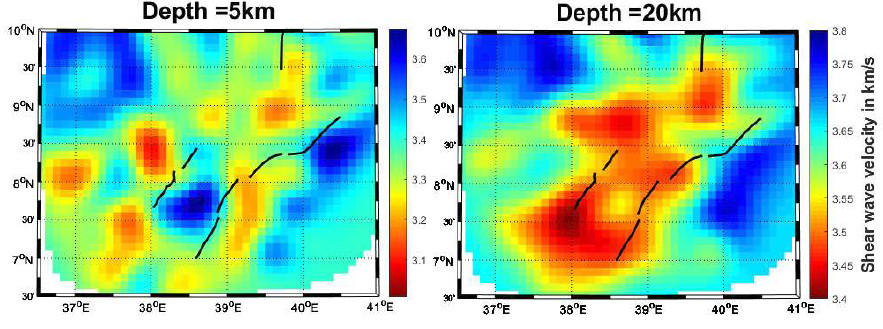
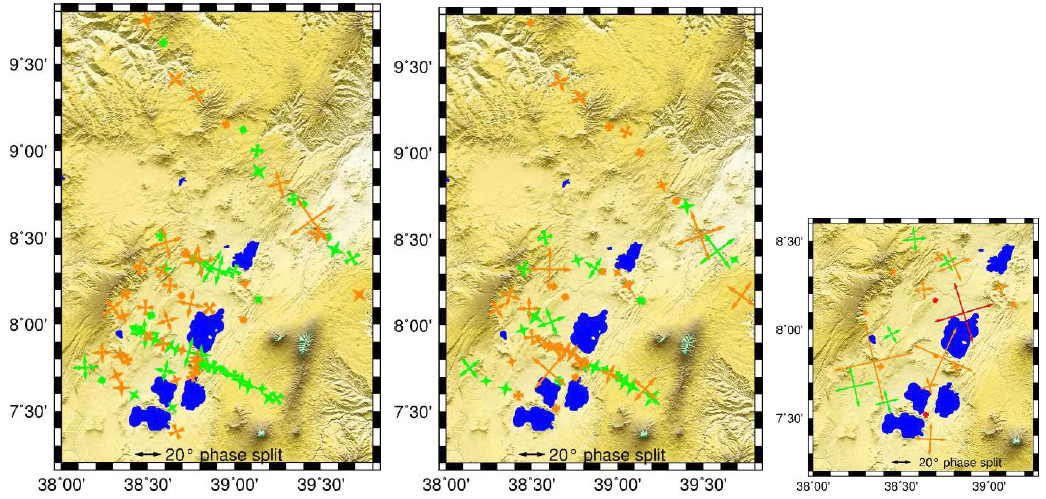
The extent of our lower crustal conductor agrees reasonably well with the low shear velocity region in Chambers et al.’s (2020) ambient noise tomography model (figure 8). However, neither MT nor ambient noise tomography has the resolution to determine whether melt is widespread, as in the models, or in laterally constrained regions. Geochemical signatures are different for volcanic products on the flanks of and in the rift, but the differentiation could be during ascent from a common source. We have also begun an analysis of electrical anisotropy, where the direction is given by the geoelectrical strike direction (with 90 ambiguity) and the amount by the maximum difference between the off-diagonal phases when the data are rotated into coordinates defined by the geoelectrical strike direction (e.g. Padilha et al., 2006). It is period dependent, but we seek period bands in which the geoelectrical strike direction is constant. The analysis is predicated on the data being consistent with a 2D Earth; this is one of the major limitations. Preliminary results are given in figure 9. We will undertake a comparison with seismic anisotropy, provided by several separate studies.
Conclusions and recommendations
Despite somewhat disappointing data quality, we have produced 2D and 3D resistivity models of the field area, resolving structure in the lower crust and uppermost mantle of the rift for the first time. We have begun an interpretation of them in conjunction with other geophysical and geochemical data. There is a good conductor associated with the SDZF, and the lower crust is electrically conductive, except in the region on the Wonji fault belt.
References
Chambers, E. L., et al. (2019). Using ambient noise to image the northern East African Rift. Geochem., Geophys., Geosyst., 20, 2091 2109. DOI: 10.1029/2018GC008129
Dambley, M. L. T., Samrock, F., Grayver, A. and Saar, M. O. (2020). Combined Multi-Scale Inversion of Regional and Local Magnetotelluric Data from the Main Ethiopian Rift. AGU Fall Meeting (https://agu2020fallmeeting-agu.ipostersessions.com/Default.aspx?s=51-7D-7E-E8EA-2B-75-5E-93-C1-47-0E-DF-AC-05-01&pdfprint=true&guestvie%E2%80%A6)
Egbert, G. D. (1997). Robust multiple-station magnetotelluric data processing. Geophys. J. Int., 130, 475 496
Grayver, A. V. (2015). Parallel three-dimensional magnetotelluric inversion using adaptive finite-element method. Part I: Theory and synthetic study. Geophys. J. Int., 202, 584 603
Hubert, J., Whaler, K., Fisseha, S. (2018). The electrical structure of the Central Main Ethiopian Rift as imaged by magnetotellurics: Implications for magma storage and pathways. J. Geophys. Res., 123, 6019-6032. DOI: 10.1029/2017JB015160
Hutchison, W., et al. (2016) Causes of unrest at silicic calderas in the East African Rift: New constraints from InSAR and soil-gas chemistry at Aluto volcano, Ethiopia, Geochem. Geophys. Geosyst., 17, 3008 3030, doi:10.1002/2016GC006395
Iddon F., et al. (2019). Mixing and crystal scavenging in the Main Ethiopian Rift revealed by trace element systematics in feldspars and glasses. Geochem., Geophys., Geosyst., 20, 230-59, DOI: 10.1029/2018GC007836
Kalscheuer, T., Pedersen, L. B., & Siripunvaraporn, W. (2008). Radiomagnetotelluric twodimensional forward and inverse modelling accounting for displacement currents. Geophysical Journal International, 175(2), 486 514.
Padilha, A., Vitorello, ., P dua, M., Bologna, M. (2006). Lithospheric and sublithospheric anisotropy beneath central-southeastern Brazil constrained by long period magnetotelluric data, Phys. Earth Planet. In., 158, 190-209
Samrock, F., et al. (2015). 3D analysis and interpretation of Magnetotelluric data from the Aluto-Langano geothermal field, Ethiopia. Geophys. J. Int., 202, 1923-1948
Smirnov, M. Y. (2003). Magnetotelluric data processing with a robust statistical procedure having a high breakdown point. Geophys. J. Int., 152, 1 7
Wilks, M., et al. (2017). Seismicity associated with magmatism, faulting and hydrothermal circulation at Aluto Volcano, Main Ethiopian Rift, J. Volcanol. Geotherm. Res., 340, 52-67
Zhang, P., Roberts, R. G., & Pedersen, L. B. (1987). Magnetotelluric strike rules. Geophysics, 52, 267 278
Instrument deployment details
Station locations. TEM data were collected at those marked with an asterisk.
Archived data
Data are almost ready to be submitted to NGDC. Accompanying metadata includes far greater detail of deployment than given above, e.g. sensor numbers, electric line lengths, and processing details.
Peer reviewed publications
Hubert, J., Whaler, K., Fisseha, S. (2018). The electrical structure of the Central Main Ethiopian Rift as imaged by magnetotellurics: Implications for magma storage and pathways. J. Geophys. Res., 123, 6019-6032. DOI: 10.1029/2017JB015160
Conference presentations
Hubert, J., Whaler, K., Fisseha, S. From `shoulder to shoulder’ A cross-rift Magnetotelluric Transect through Aluto volcano, Ethiopia, 23rd Electromagnetic induction workshop, Chiang Mai, Thailand, 2016
Hubert, J., Whaler, K., Fisseha, S. Evidence for off-axis magma pathways in the Central Main Ethiopian Rift as imaged by Magnetotellurics, TSG-VMGS-BGA Joint assembly, Liverpool, UK, 2017
Hubert, J., Whaler, K. and S. Fisseha, S. Magnetotelluric imaging of the Central Main Ethiopian Rift - Implications for magma pathways and storage, IAGA Scientific Assembly, Cape Town, South Africa, 2017
Hubert, J., Whaler, K.; Fisseha, S. and Hogg, C. Imaging an off-axis volcanic field in the Main Ethiopian Rift using 3-D magnetotellurics, AGU Fall meeting 2017
Hubert, J., Whaler, K.; Fisseha, S. and Hogg, C. Bi-modal Magma Storage across the Main Ethiopian Rift Zone as imaged by 3-D Magnetotellurics, 24th EM Induction Workshop, Helsing r, Denmark, 2018
Iddon, F., Edmonds, M.; Hubert, J. and Whaler, K. Missing Melts: Reconciling geochemical and geophysical observations of magma storage across the Main Ethiopian Rift, RiftVolc Conference `Magmatic and Volcanic Processes in Continental Rifts’, Hawassa, Ethiopia, 2019
Hubert, J., Whaler, K.; Fisseha, S., Iddon, F. and Hogg, C. Bi-modal Magma Storage across the Main Ethiopian Rift Zone as imaged by 3-D Magnetotellurics, RiftVolc Conference ‘Magmatic and Volcanic Processes in Continental Rifts’, Hawassa, Ethiopia, 2019
K A Whaler, J O S Hammond, D Keir, J Hubert, S Fisseha, Electrical and Seismic Anisotropy in the Main Ethiopian Rift, Abstract, RiftVolc Conference ‘Magmatic and volcanic processes in continental rifts’, Hawassa, Ethiopia, 2019
Hubert, J., Whaler, K., Fisseha, S., Iddon, F. and Hogg, C. Imaging deep magmatic processes in an active continental rift zone using 3-D Magnetotellurics, IUGG General Assembly Montreal, Canada, 2019 (Invited)
K A Whaler, J O S Hammond, D Keir, J Hubert, S Fisseha, Electrical and Seismic Anisotropy in the Main Ethiopian Rift, IUGG General Assembly, Montreal, Canada, 2019
Hubert, J., Whaler, K., Fisseha, S., Iddon, F. and Hogg, C. Imaging magma storage in the Main Ethiopian Rift with 3-D Magnetotellurics, EGU General Assembly, 2020
