Scientific Report 1034
This is a Reduced Scientific Report resulting from our minor loan scheme.
Summary
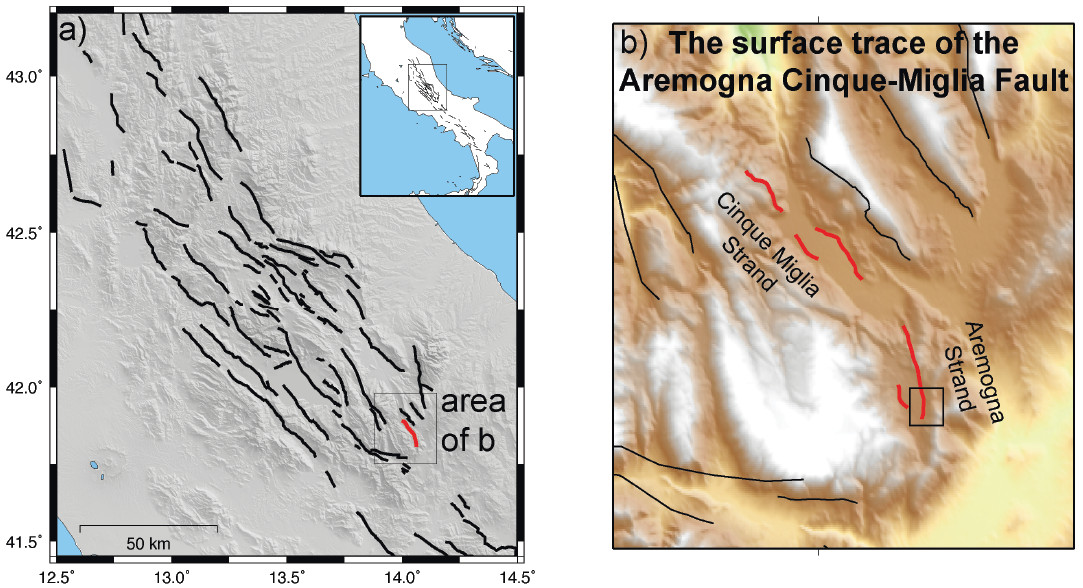
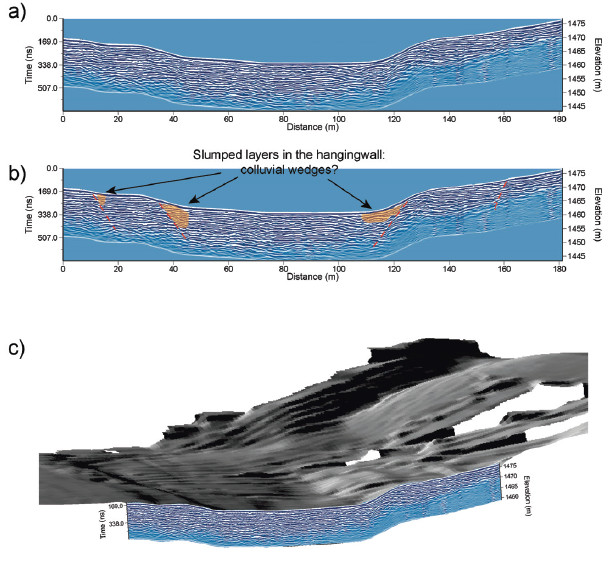
In order to understand the seismic hazard posed by an active faults it is necessary to know (i) the long-term rate of movement of the fault; (ii) the geometry of the fault; and (iii) the time that has elapsed since the last earthquake occurred on the fault. This study aimed to improve the information known about the Aremogna-Cinque Miglia Fault in the central Apennines, Italy. We collected a real-time kinematic GPS survey of the southeastern tip of the Aremogna segment of the Fault (Figure 1) to map the surface trace of the fault, and map the offset of the fault. This was combined with a ground penetrating radar (GPR) survey across the fault.
Research facilitated by this loan
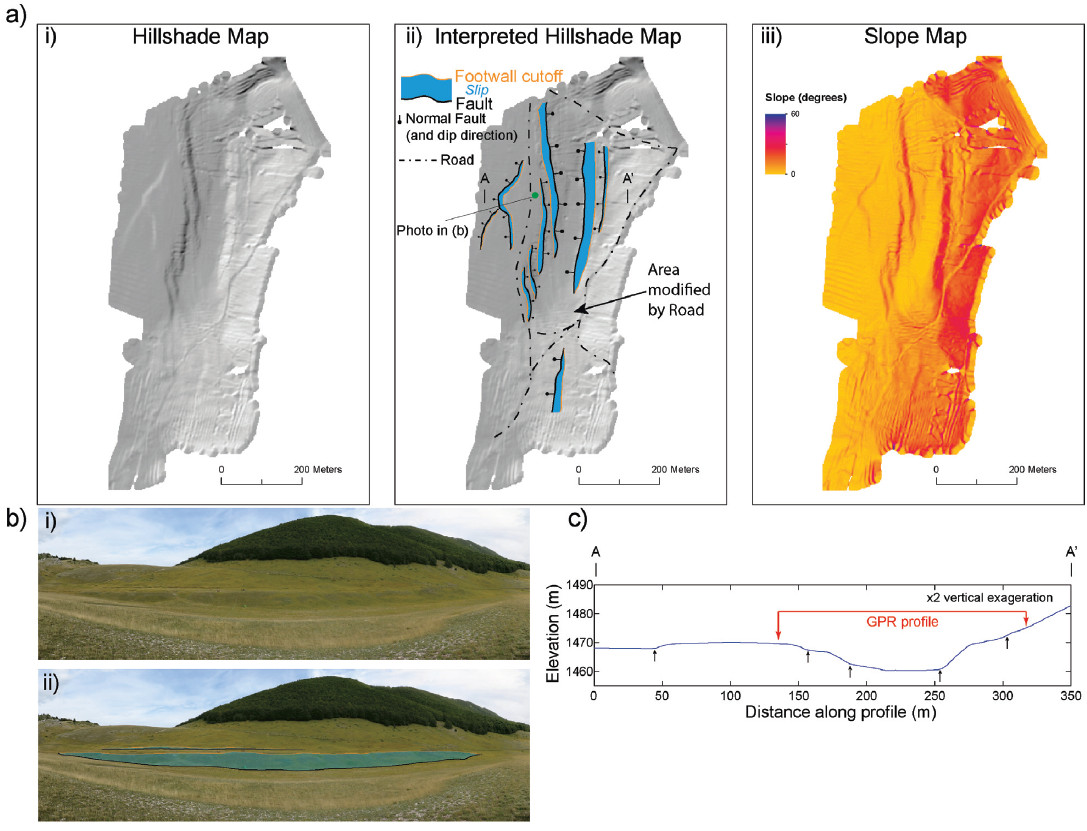
The aim of this project was to map the surface trace of the Aremogna Cinque-Miglia Fault using a RTK GPS survey, and measure the slip-rate. In conjunction with the GPS survey, we carried out a GPR survey using equipment from the UCL geophysical equipment pool. Mapping fault slip-rates and fault geometries can reveal data that can be used in seismic hazard assessments (e.g. Pace et al., 2006), and prior to this research, details on the Aremogna Cinque-Miglia fault was limited due to poor coverage by aerial photography, and limited previous studies on the fault. Geophysical surveys by other authors on other similar faults in the central Apennines have revealed the location and throw of the faults (e.g. Villani et al., 2015), In this study we choose a fault with a known earthquake history but for which the geometrical and slip-rate details were poorly constrained. We found a complicated structure (fig 2) with multiple fault scarps forming a horst-graben structure. Future work will be to use topographic profiles through the data to determine the slip on the fault in addition to combining this with more GPR data (e.g. fig 3).
Project Outcomes
Data collected with a vertical resolution of 0.25m and a horizontal spacing of 0.5m. In post-processing, the data was interpolated to produce a 2.5m resolution digital elevation model (DEM; Figure 2). The data was then analysed alongside field mapping carried out at the same time as the field survey to identify the faults in the region of study. The GNSS equipment used performed adequately for the task required. The faults can clearly be seen in the digital elevation model (Figure 2a) and in profiles extracted from the model (Figure 2c) - these observations match field observations (Figure 2b). Levels of accuracy on the order of 10cm are sufficient for the task of mapping offsets. This level of accuracy was also sufficient for combing with GPR data collected during the same field expedition. The level of accuracy was sufficient for this task. The detail of the processed data was such that features that were difficult to identify in the field were easily identifiable in the DEM produced (e.g. the easternmost fault scarps shown in Fig. 2).
Outputs
No publications have yet been produced using the data. Subsequent geophysical surveys using equipment from the UCL geophysical equipment pool is required to supplement the data in this report. The data will be used in Luke Wedmore’s PhD thesis which will be submitted for examination in 2016.
Data Archiving
When data processing has been completed, the data will be archived within the UCL data archive and the relevant NERC data centre. All publications that use this data will be open access.
References
Pace, B., Peruzza, L., Lavecchio, G. and Boncio, P. (2006) Layered Seismogenic Source Model and Probabilistic Seismic-Hazard Analyses in central Italy. Bulletin of the Seismological Society of America, 96(1), 107-132.
Villani, F., Tulliani, V., Sapia, V., Fierro, E., Civico, R., and Pantosti, D., (2015) Shallow subsurface imaging of the Piano di Pezza active normal fault (central Italy) by high-resolution refraction and electric resistivity tomography coupled with time-domain electromagnetic data. Geophysical Journal International, 203, 1482-1494.
Figures and tables


