Scientific Report 1026
This report is also available as a PDF document .
Abstract
Researchers have previously demonstrated correlations between seismic signals and fluvial processes (in particular discharge and bedload transport). This is an attractive finding because it suggests the possibility of an unobtrusive method to measure bedload transport. However, the range of rivers where this might work, the way in which seismic data might vary with channel type, and the strengths of any correlations between fluvial processes and seismic data are still unknown. We collected three sets of seismic data over 6 months adjacent to two different rivers (Trout Beck, a bedrockalluvial channel; and Bury Green Brook, an alluvial channel), along with concurrent discharge and bedload data. Initial analysis of the data suggests that the best correlation between seismic data and fluvial processes occurs in Trout Beck (seismometer TBU), where the seismometer was closely coupled to the bedrock that comprised the river channel. We identify dominant signals at 12 and 21 Hz; however, they are not caused exclusively by the discharge and bedload. The other seismometer at Trout Beck (TBU) was buried in mine waste, and fluvial processes are harder to identify in the noisier data. Data from Bury Green Brook (BGB) are dominated by diurnal signals, and require further processing before an assessment can be made.
Background
The aim of this project is to evaluate the use of seismic data for monitoring fluvial bedload transport. A range of techniques are currently used to measure bedload transport, but none of them enable data with a high temporal resolution to be collected from any river channel of interest. High temporal resolution data can currently only be collected through intensive, insitu measurements, or by installing infrastructure in the river channel. Alternative techniques that are easier to deploy only provide information on transport at the resolution of entire flood events.
Over the last few years, researchers have identified signals between 1 and 45 Hz in seismic data collected adjacent to rivers that have been interpreted as being caused by bedload transport (Govi et al., 1993; Burtin et al., 2008, 2011; Hsu et al. 2011; Schmandt et al., 2013). However, only a small number of recent projects have actually collected and compared concurrent measurements of seismic signals, flow and bedload transport, from one or two bedload transport events (Burtin et al., 2014; Barri re et al., 2015). It is very likely that bedload transport creates seismic noise, but there are still outstanding questions about what properties of bedload transport can be extracted from seismic data (e.g. timing, flux, grain size) and the types of river channels in which this technique can be applied. This study therefore aimed to address some of these questions by collecting data from two contrasting channels, over a longer time period of several months.
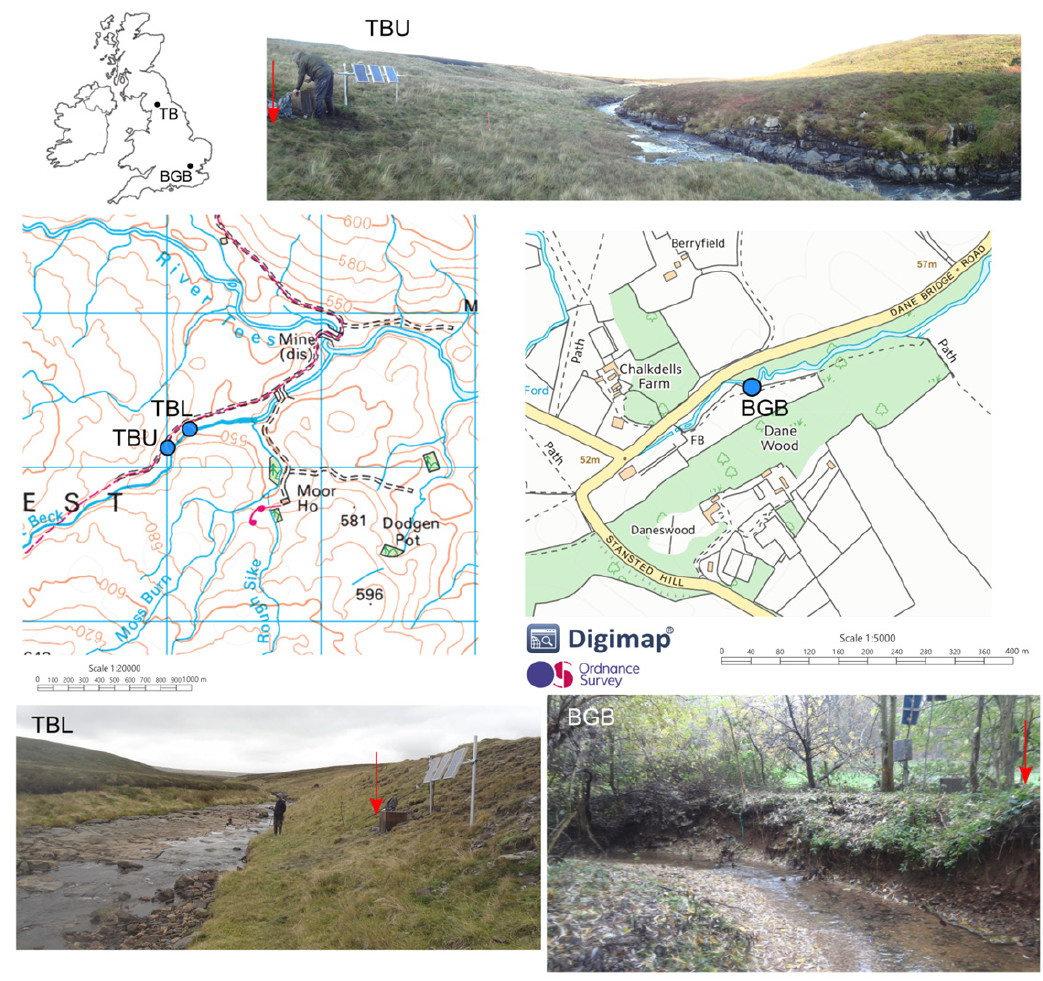
In this study, three Guralp CMG6TD seismometers supplied by SEISUK were installed at two different rivers (Figure 1); one at Bury Green Brook, Hertfordshire, UK and two at Trout Beck, North Pennines, UK. Bury Green Brook is a small alluvial channel with a median grain size of 30 mm. Trout Beck at this location has a predominantly bedrock bed and median grain size of 70 mm. Flow and sediment transport were already being monitored at both sites and so presented an ideal opportunity to collect concurrent seismic data with which to compare the ability of the different techniques to identify bedload transport.
Survey procedure
Seismometers - The Trout Beck seismometers were deployed on 06/10/14 and removed on 28/03/15, and the Bury Green Brook seismometer was deployed on 24/09/14 and removed on 06/04/15. For each seismometer, a 0.5 m deep hole was dug in a suitable location that was close to the channel (less than 10 m), but that would not be flooded. In Trout Beck an additional concern was finding a location that was not waterlogged. The Trout Beck locations were adjacent to impact sensors installed in the channel bed that were recording amounts of bedload transport. The three seismometers were each buried in different material; TBU was buried in a predominantly peaty soil, with < 0.5 m between the base of the seismometer and the underlying bedrock. TBL was buried in a bank of mine waste comprised of mixed shale pieces and soil. BGB was buried in consolidated floodplain soil.
Each seismometer was installed in the same way. A piece of paving slab was placed at the base of each hole, and the seismometer, in a heavy duty plastic sack, was orientated and levelled on the paving. A plastic bucket (with the end removed) was placed around the seismometer, with the cables being fed out under the side of the bucket. The space in the bucket around the seismometer and bag was filled with dry sand. During this process the orientation and level of the seismometer was checked to ensure that no disturbance had occurred. Once the bucket was filled with sand, the base of the bucket was used as a lid, and the hole around the bucket was backfilled. The breakout box, 12 V leisure battery and cables were installed in a wooden tea crate, adjacent to the seismometer. Above ground cables were protected with a split hosepipe. At all sites 3 20 W solar panels were installed to supply power.
Previous work (Burtin et al., 2011; Roth et al., 2014) has typically used a sampling rate of 200 sps, enabling analysis up to 100 Hz, which is within the flat response range of the CMG6TD. However, it was decided to also collect data at higher sampling rates, in order to assess whether higher frequencies contained any useful information about bedload transport. Consequently, TBU (16 GB storage) was set to record at 1000 sps (Z only), and 200 and 2 sps (N,E and Z). TBL (8 GB storage) was initially set to record at the same rates, but on 14/10/14 the highest rate was decreased to 400 sps (Z only). BGB was set to record at 1000 sps (Z only), and 200 and 10 sps (N,E and Z). One consequence of these high sampling rates was the amount of time that it took to flush the data. A flush of a full data store typically took about 2 hours for the 16 GB storage and one hour for the 8 GB storage; about 7 to 7.6 minutes per GB of data. David Hawthorn contacted Guralp about this, who thought that the slow download speeds were caused by the high sampling rates. One potential approach would have been to reduce the sampling rates before flushing, but as there were typically other tasks to perform at the field sites, the download time normally wasn’t an issue.
Analysis has confirmed the findings of previous field data and modelling work (e.g. Tsai et al., 2012), which is that there is little, if any, useful information contained in frequencies above 100 Hz. Therefore, in any future work I would only set the instruments to record at a maximum rate of 200 sps, which would also help with download times and potential issues losing data if the site is temporarily inaccessible.
Flow and bedload data - At both sites we planned to record concurrent flow and bedload transport data using a combination of pressure gauges (to measure water depth) and bedload impact plates (to record the number of impacts caused by moving sediment grains). At Trout Beck we recorded a complete discharge record for the study period, have a complete bedload record from the impact sensor adjacent to TBL, and an incomplete record from the sensor adjacent to TBU.
At Bury Green Brook we had problems with the pressure gauges and data logger, and so flow data are unavailable apart from the final 2 weeks of the study period, during which no bedload transport was recorded. We do have a continuous record of bedload from two impact sensors (one upstream and one downstream of the seismometer). We can therefore compare seismic data from periods with and without bedload transport, but we cannot account for differences in flow conditions.
Data quality
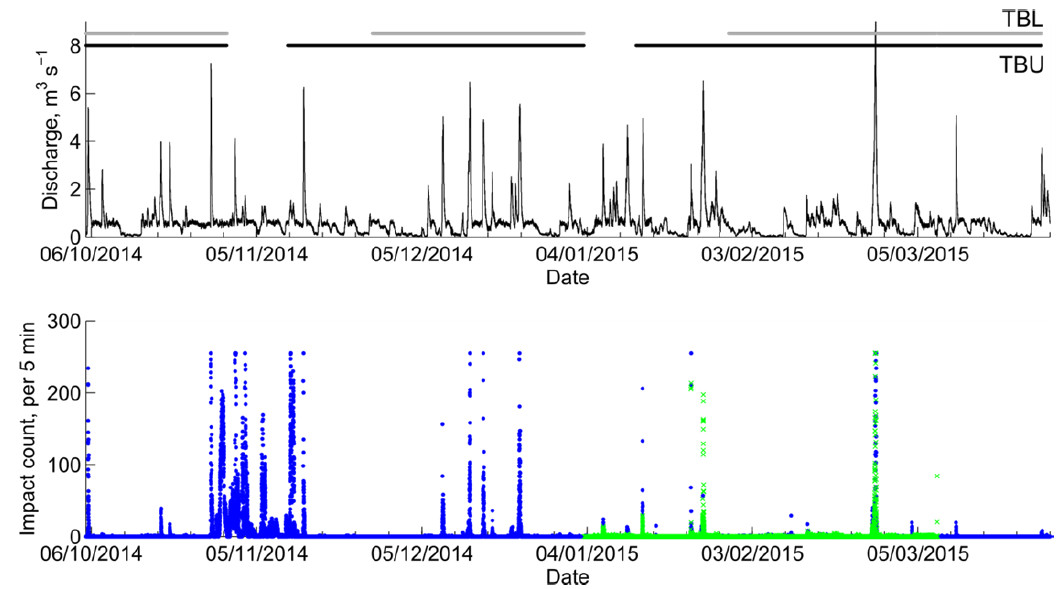
Neither field location was entirely without problems, which affected the amount and quality of the data. At Trout Beck, the main issue was snow and ice limiting access to the site. The high sampling rates that were being used meant that the memory in TBU and TBL were full in 55 and 39 days respectively. Consequently, there are stretches of missing data 12 days and 9 days long from TBU and 27 days and 26 days long from TBL (Figure 2). At both TBU and TBL there was also evidence that wildlife had nibbled the wires. This activity did not stop data being collected, but could potentially have affected the data quality. At Bury Green Brook the main issue was power from the solar panel. The panels were installed facing south, at an elevation of about 2.5 m off the ground, but with an area of wood < 100 m away to the south. The seismometer ran until 12/12/14, but then no data was collected until 18/01/15 (Figure 3). This is likely to be because the elevation of the sun dropped behind the trees during this time. After 18/01/15, data was collected intermittently, with continuous data only being recorded after 17/02/15.

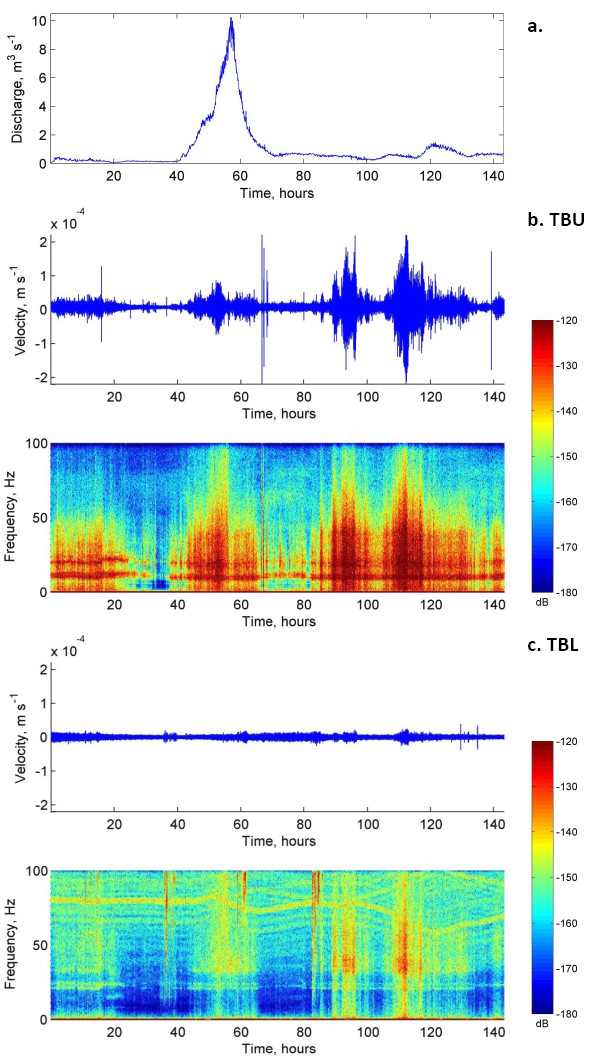
Data quality was initially checked using Guralp Scream to identify any gaps in the data, and to view the data spectrograms to check data quality. We focus on the vertical component of the data, as this has been argued to correlate best with bedload transport (Roth et al., 2014). Example unfiltered data and spectrograms from TBU and TBL for a period with varying discharge are shown in Figure 4. TBU shows a cleaner, stronger signal, which is likely to be because the seismometer is positioned just above the bedrock and hence has a high degree of coupling to the channel. TBL has weaker, far noisier signal, which may reflect the weaker coupling through the mine waste.
There are also differences in the dominant frequencies; TBU shows consistent peaks at around 12 and 21 Hz, with periods of increases in power over all frequencies up to 60 Hz. TBL shows quite a different pattern, although the peak at 21 Hz is still visible. There are also signals in TBL at about 40 Hz that have the same timing as the dominant signal in TBU, suggesting that they are caused by the same process. It is not entirely clear what this process is; the hydrograph in Figure 4 shows that the broadband increase in power at about 50 hours occurs at the same time as a flood peak, but later power increases do not correlate with flow events. The spectrogram also shows the noise in the TBL data. There are occasional high frequency bursts, and a signal in a high frequency band (60 100 Hz) that wanders over time; the causes of these signals in unknown and they do not seem to appear in the TBU data.
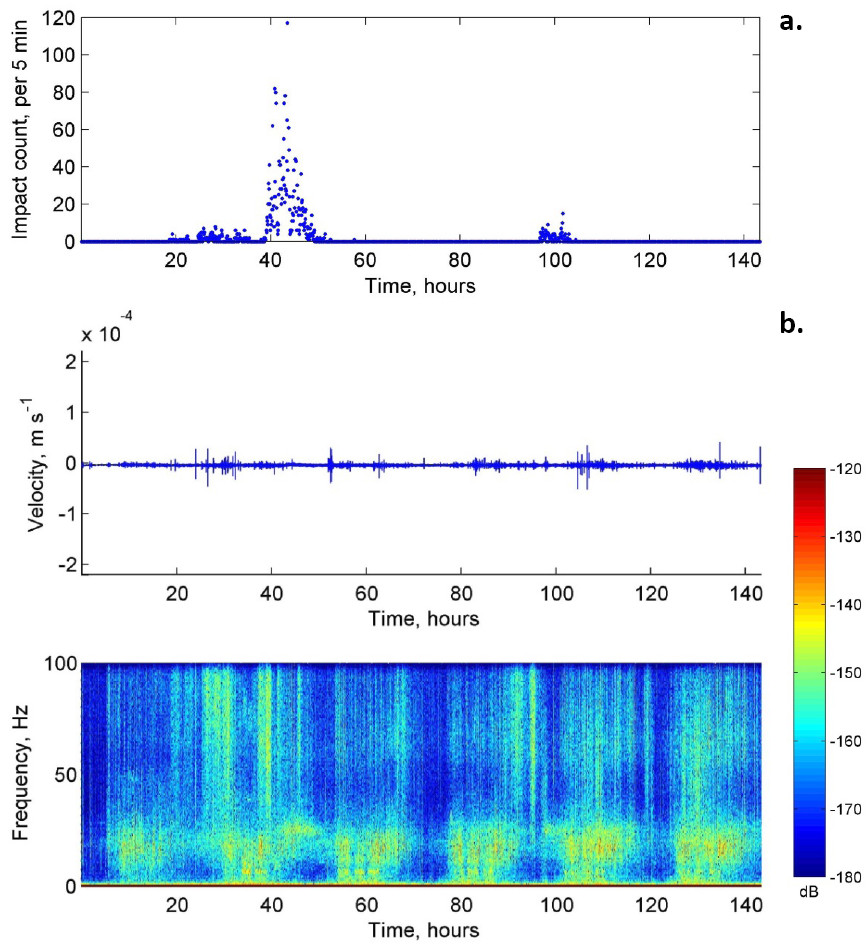
Data from BGB have a small amplitude, but the data are not as noisy as those from TBL (Figure 5). The predominant signal seen in the spectrogram is diurnal with a dominant frequency of around 20 Hz, which is likely to be produced by nearby road traffic. During the flood event at 40 hours, there is however an increase in power at frequencies of around 25 Hz, which does not occur at other times and therefore may be caused by fluvial processes.
Processing and modelling
Data processing is still at an early stage. The data from TBU appears to be the most promising for identifying a bedload signal (Figure 4). Data from TBL and BGB will require more extensive processing in order to reduce the noise in the data, and to remove the diurnal signal respectively. One possible approach for the BGB data is that taken by Barriere et al. (2015) who were analysing fluvial seismic signals from a similarly noisy location.
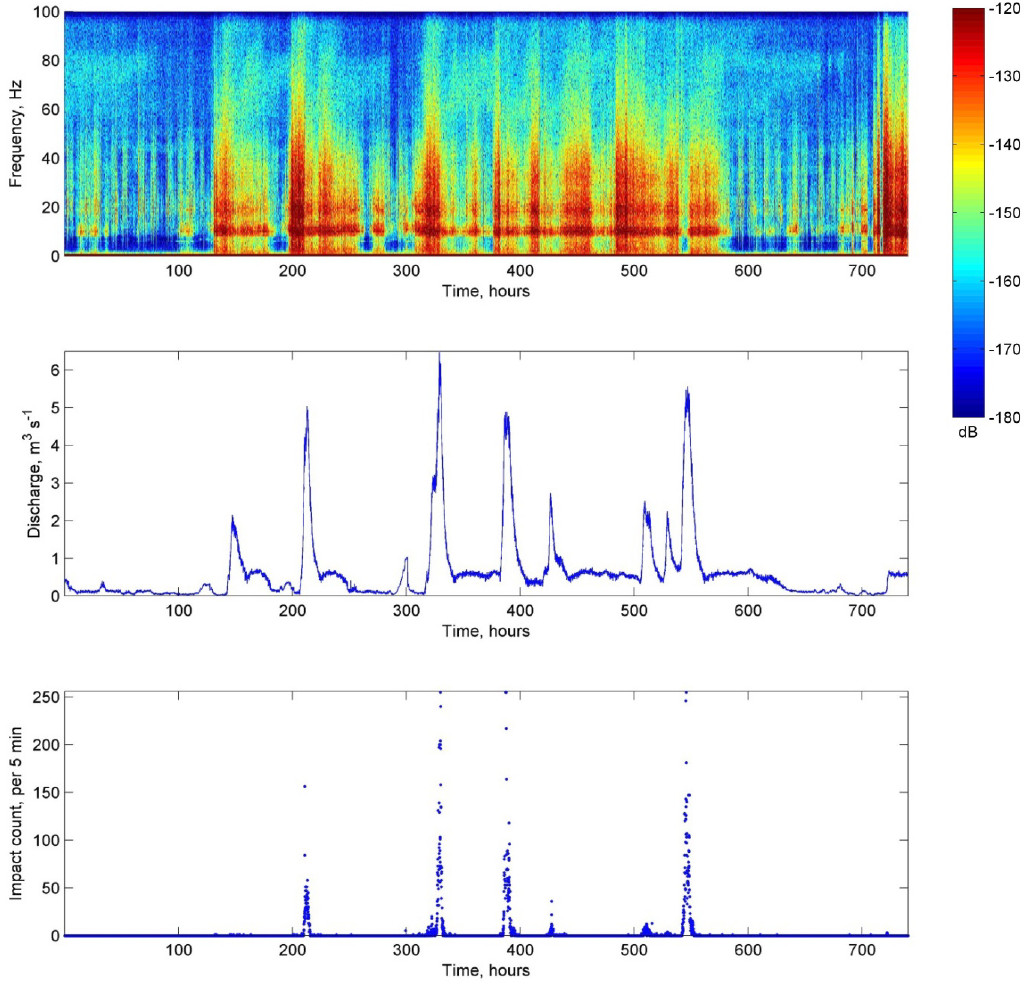
Processing so far has mainly taken the form of calculating spectrograms for the data, in order to visually identify the temporal pattern and frequency of dominant signals in the data. These data have been qualitatively compared with the concurrent discharge and bedload data; Figure 6 shows a comparison between the spectrogram from TBU, discharge and bedload data from a series of flood events that occurred in Trout Beck. There is a correlation between changes in discharge and bedload and the strength of the seismic signal, particularly between frequencies of 1and 50 Hz. However, as also shown in Figure 4, this is not a unique relationship, with additional peaks in seismic noise that do not correlate to events that were measured in the channel. One possible cause of these other peaks is rainfall; precipitation data collected adjacent to Trout Beck over this time period is being obtained, and will also be compared to the seismic data.
Future processing will:
- Investigate different approaches to data filtering, including steps to reduce the noise in TBL and the diurnal signal in BGB
- Use a Hilbert transform on the filtered data to calculate the signal envelope
- Undertake a quantitative comparison between the seismic data and other environmental data.
Interpretation to date and preliminary findings
Analysis of the data to date indicates that not all river channels are equally suitable for using seismic data to identify bedload transport. The predominantly bedrock channel and small depth of alluvium at TBU has produced a signal that shows some degree of correlation with the fluvial processes that are of interest. At the other sites, different factors (anthropogenic noise and the substrate under the seismometer) mean that the data requires more extensive processing before the strength of any relationship between the seismic data and fluvial processes can be established.
Conclusions and recommendations
Seismic data were collected from three different locations adjacent to river channels in order to assess the use of seismic data for quantifying bedload transport processes. Initial analysis suggests that data from TBU does contain a response to fluvial processes, but in a nonstraightforward way.
Data from TBL and BGB require further processing to remove noise before it is possible to establish the extent to which they also contain signals of fluvial processes. Future recommendations would be to collect data at a maximum sampling rate of 200 sps, in order to avoid data gaps when the site is inaccessible and because there do not seem to be fluvially relevant signals at higher frequencies. An alternative power source would also be recommended when there are trees blocking the horizon.
Publications
So far there are no publications from this work; future publications will depend on the results of further analysis. One possible outcome is an ESEX in Earth Surface Processes and Landforms.
References
Barriere et al., 2015. Geophys. Res. Lett. 2015GL063630.
Burtin et al., 2008. Journal of Geophysical Research: Solid Earth 113, B05301.
Burtin et al., 2011. Journal of Hydrology 408, 43 53.
Burtin et al., 2014. Earth Surface Dynamics 2, 21 33.
Govi et al., 1993. Hydrological Sciences Journal 38, 123 132.
Hsu et al., 2011. Geophys. Res. Lett. 38, L13407.
Roth et al., 2014. Earth and Planetary Science Letters 404, 144 153.
Schmandt et al., 2013. Geophys. Res. Lett. 40, 4858 4863.
Tsai et al., 2012. Geophys. Res. Lett. 39.

